Global Index Market Analysis — February 26, 2026 | Daily Briefing
All prices reflect the most recent session close or pre-market data as of 05:15 ET, February 26, 2026.
Here’s the rundown of what’s actually moving the needle this morning — the stories every active trader needs on their radar before the opening bell.
| Story | Source | Impact | What It Means for Traders |
|---|---|---|---|
| Nvidia Q4 Beat, Muted Rally | Bloomberg / CNBC | HIGH | NVDA reported EPS of $1.62 (vs $1.53 est.) and revenue of $68.1B (vs $66.2B est.), guiding Q1 FY27 to $78B. Shares barely moved after hours — the beat was fully priced in. Markets now wait for follow-through or Salesforce-led drag. |
| Salesforce Revenue Guidance Miss | CNBC / Reuters | HIGH | CRM fell 4–5% after hours on soft FY27 revenue guidance, reigniting AI disruption fears in the enterprise software space. Weighing on Dow futures this morning. |
| AI Rally Stalling | Bloomberg | HIGH | A stock rally is stalling as Nvidia’s earnings beat failed to ignite broader tech gains and investors pared risk ahead of US-Iran nuclear talks. Sentiment cautious at the open. |
| Trump Tariff Backdrop | Reuters / Trading Economics | MEDIUM | A 10% global import duty came into effect Tuesday. Trump’s State of the Union focused on domestic themes, not new escalations — a partial relief for markets but tariff risk remains structural. |
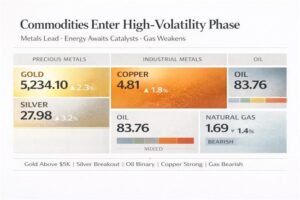
| Toyota $19B Share Sale | Bloomberg / Reuters | MEDIUM | Toyota plans to unwind ¥3 trillion in cross-shareholdings, reflecting Japan’s corporate reform push. Positive signal for Nikkei rerating over 2026. |
| UK CPI Cools to 3.0% YoY | TradingView Ideas | MEDIUM | UK inflation cooling has markets pricing ~80% chance of a Bank of England rate cut in March. Bullish for UK equities, supportive of FTSE’s rally to all-time highs. |
| AMD / Meta GPU Deal | CNBC | MEDIUM | Meta’s multi-year deal with AMD to deploy 6 GW of GPUs sent AMD up 8.8% Tuesday before paring gains. Reaffirms hyperscaler capex themes remain alive despite AI anxiety. |
| US Jobless Claims Due Today | Investing.com | HIGH | 8:30 ET release. Consensus is 217K vs prior 206K. Previous data showed a robust labor market. A miss to the upside could trim rate-cut expectations and pressure equities. |
Filtered to USA, UK, Eurozone, Japan, Australia, and China only. All times are US Eastern (ET).
| Time (ET) | Country | Event | Forecast | Previous | Impact |
|---|---|---|---|---|---|
| 08:30 | 🇺🇸 USA | Initial Jobless Claims | 217K | 206K | HIGH |
| 08:30 | 🇺🇸 USA | Continuing Jobless Claims | ~1,880K | 1,869K | MEDIUM |
| 10:00 | 🇺🇸 USA | Fed Governor Bowman Speech | — | — | HIGH |
| 10:30 | 🇺🇸 USA | Natural Gas Storage | −36B | −144B | LOW |
| 13:00 | 🇺🇸 USA | 7-Year Treasury Note Auction | — | Prev 3.625% | MEDIUM |
| All Day | 🇯🇵 Japan | Cabinet Office Leading Index (Jan) | Forward-looking | — | MEDIUM |
| All Day | 🇦🇺 Australia | RBA Quarterly Bulletin | Policy narrative | — | LOW |
| Overnight | 🇨🇳 China | Markets Fully Reopened (Post-LNY) | Risk-on flow | SSE +0.72% | MEDIUM |
| Ongoing | 🇬🇧 UK | BoE Rate Decision (March pricing) | ~80% cut probability | CPI 3.0% | HIGH |
| Ongoing | 🇪🇺 Europe | ECB Policy Narrative / Lagarde Succession | Easing bias | — | MEDIUM |
Technical readings are derived from Investing.com daily summary signals, TradingView community analysis, and proprietary indicator overlays. All levels are as of the February 25 close.
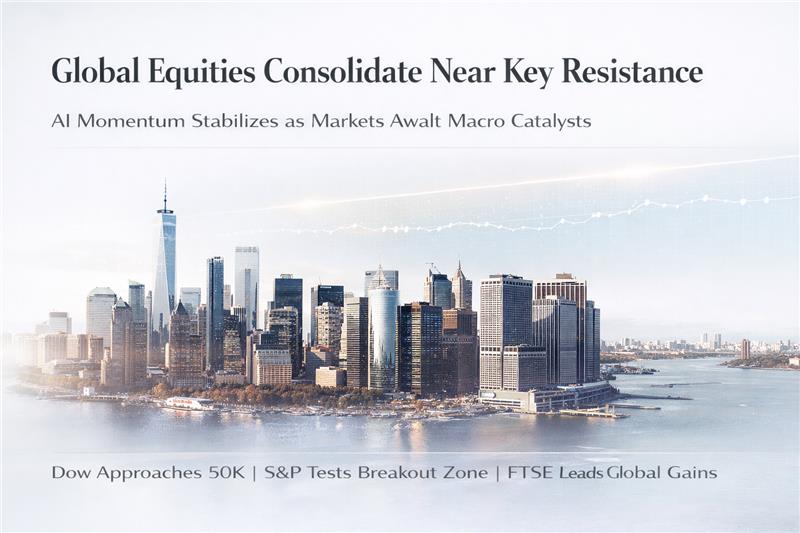
Dow Jones Industrial Average
The Dow extended its two-day rebound on Wednesday, lifted by UnitedHealth (+3.72%), IBM (+3.71%), and Salesforce (+3.12%) before the latter’s after-hours earnings miss. The index is consolidating in an ascending triangle structure, with the 50,000 psychological level serving as the critical resistance frontier. Futures have turned fractionally negative overnight as the CRM headwind filters through Dow components.
The Dow is tracing an ascending triangle on the daily chart — a classically bullish continuation pattern. Price action shows a flat upper resistance (~49,900) with a rising lower trendline, confirmed by progressively higher lows over the past three weeks. Wednesday’s close formed a bullish Marubozu body, indicating strong buyer conviction. The prior session had produced a Hammer candle off the 49,000 support zone, which has now been confirmed as a short-term reversal signal.
Rationale: Wait for the Salesforce/overnight futures drag to settle and look for a re-test of 49,100–49,250 in early US hours. A clean hold above the ascending trendline and pivot point (~49,264) with strong volume on the bid confirms the long. Avoid initiating longs above 49,800 with the 50K resistance looming and RSI starting to diverge negatively. Jobless claims data at 08:30 ET is the decision gate.
S&P 500 Index
The S&P 500 posted back-to-back gains after a sharp sell-off earlier in February. The index is now navigating the critical 6,900–7,000 zone — an area that has acted as both resistance and a magnetic attractor in recent weeks. The daily chart shows the index breaking marginally above the 6,900 resistance level, but Investtech flags a negative RSI divergence suggesting caution about continuation. Investtech notes that “an established break predicts a further rise” but RSI divergence “indicates danger of a reaction downwards.”
The S&P 500 is within a rising trend channel in the medium-to-long term. The key near-term pattern is a consolidation rectangle between 6,780 (floor) and 7,050 (ceiling). Wednesday’s price action formed a Strong Bullish Candle with above-average volume, suggesting genuine buying interest. However, the 7,000–7,050 zone has produced multiple rejections in prior sessions, creating a visible Double Top risk on the daily chart if the index fails to close convincingly above 7,000. The weekly chart remains in a clear uptrend with a bullish structure of higher highs and higher lows intact since Q4 2024.
Rationale: The 7,000–7,050 zone is the defining level of the current price action. A confirmed daily close above 7,050 with expansion volume would invalidate the bearish divergence signal and open the door to 7,200+. For today’s session, the range-trade approach is recommended: buy dips toward 6,830–6,870 with stops below 6,780, and fade rallies toward 7,000–7,050. A jobless claims beat (below 210K) would support the bull case; a miss (above 220K) would pressure the index toward S2.
FTSE 100
The FTSE 100 is the standout performer among major indices, trading at all-time highs in 2026. Cooling UK inflation (CPI 3.0% YoY) has turbo-charged BoE rate cut expectations for March, creating a powerful tailwind for UK equities. The index broke above the 10,600 resistance level decisively in February and has now pushed to 10,806 — a level that was highlighted as the next target in Wave Analysis from mid-February. Mining and defence stocks have been key drivers, with these companies collectively seeing their valuations surge by over $65 billion this year alone.
The FTSE 100 is displaying a textbook ascending channel on the daily timeframe — a sequence of higher highs and higher lows that has been intact since October 2025. The index recently broke the mid-channel diagonal resistance line, which now serves as dynamic support. Wednesday’s action produced a Bullish Engulfing candle, signaling fresh momentum. However, with RSI pushing into overbought territory (72–75), there is a growing risk of a short-term pullback. TradingView analysts note clear bearish divergence forming on the indicators, making a pullback toward 10,580–10,600 increasingly likely. The structural bullish trend remains intact, but this is not a level to chase aggressively on the long side.
Rationale: The FTSE’s overall structure is undeniably bullish — 12/12 moving averages on buy signals — but RSI at 72–75 means chasing momentum at current levels carries high reversal risk. The preferred approach is to wait for a pullback into the 10,735–10,600 zone and enter longs for the move toward 10,850–11,000. A confirmed daily close below 10,600 would invalidate the bullish structure and open downside to 10,520. For the aggressive short-term trader, the 10,735–10,756 short setup targeting 10,696–10,682 (as highlighted by TradingView contributors) is a clean intraday setup with clear risk definition. A BoE rate cut confirmation in March would be the structural bull catalyst for the next leg toward 11,000.
| Index | Region | Level | Day Change | WTD | Signal |
|---|---|---|---|---|---|
| Dow Jones | USA | 49,482 | +0.63% | +1.3% | Bullish |
| S&P 500 | USA | 6,946 | +0.81% | +1.5% | Neutral |
| Nasdaq Comp. | USA | 23,152 | +1.26% | +2.6% | Bullish |
| FTSE 100 | UK | 10,806 | +1.18% | +2.37% | Strong Buy |
| DAX | Germany / EU | 25,176 | +0.76% | +1.1% | Bullish |
| CAC 40 | France / EU | 8,559 | +0.47% | +0.9% | Bullish |
| EURO STOXX 50 | Eurozone | 6,173 | +0.93% | +1.4% | Bullish |
| Nikkei 225 | Japan | 58,753 | +0.29% | +0.7% | Bullish |
| Shanghai Comp. | China | 4,147 | +0.72% | +0.9% | Neutral |
| ASX 200 | Australia | 9,175 | +0.51% | +1.2% | Bullish |
| Hang Seng | Hong Kong | 26,460 | −1.14% | −0.5% | Neutral |
| Russell 2000 | USA (Small Cap) | 2,663 | +0.41% | +0.8% | Neutral |
| Theme | Direction | Analysis & Expected Market Impact |
|---|---|---|
| AI Trade Recalibration | Mixed | Nvidia’s beat confirmed AI infrastructure demand, but the muted share price reaction reveals that expectations had already been fully priced in. Salesforce’s soft guidance reactivates AI disruption fears for legacy software, while Anthropic’s “additive AI” positioning provides a partial offset. Expect intraday volatility in tech-heavy instruments (NQ, QQQ). |
| US Labor Market Data | Event Risk | Jobless Claims at 08:30 ET. The previous print of 206K was the best reading in months. Consensus at 217K is moderate. Market is already priced for “stable labor market” — a surprise either direction will move indices 0.3–0.8%. |
| UK Rate Cut Expectations | Bullish UK | With CPI at 3.0% and markets pricing ~80% odds of a March BoE cut, UK equities remain structurally bid. FTSE 100’s mining and defence components continue to attract global inflows. The GBP may weaken slightly if the BoE cuts, further boosting FTSE’s export-heavy constituents. |
| Tariff Risk / US-EU Trade | Latent Risk | Reports of Trump pushing for 15–20% minimum tariffs on EU goods weighed on EUR/USD. The 10% global import duty is now active. Markets have partially priced this in but any escalation or Supreme Court challenge failure would trigger a fast re-price lower in risk assets. |
| US-Iran Nuclear Talks | Risk-Off Trigger | High-stakes diplomatic talks between the US and Iran have caused investors to pare some risk exposure, according to Bloomberg. A breakdown would spike oil and gold while pressuring equity indices. A positive outcome would be broadly risk-positive. |
| Japan Corporate Reform | Bullish Japan | Toyota’s planned $19B cross-shareholding unwind is part of a broader Japanese corporate reform drive that is improving ROE and attracting foreign investors to the Nikkei. Nikkei 225 at 58,753 remains in an uptrend. |
| China Post-LNY Return | Neutral-Positive | Shanghai Composite returned +0.72% post-Lunar New Year. The IMF projects China GDP growth at 4.5% in 2026. Positive for commodities and EM broadly, but domestic policy stimulus remains the key variable to watch. |
Analyst Conclusion
February 26, 2026 opens with global equity markets in a constructive but increasingly fragile posture. The AI trade — which powered the bull run through much of 2025 and into 2026 — is entering a phase of honest recalibration. Nvidia confirmed that the infrastructure build-out is real and profitable, but the market’s muted reaction tells you something important: the easy money in the initial AI euphoria phase has already been made. Going forward, every earnings print from Salesforce, Alphabet, or Microsoft carries more binary risk than before.
The FTSE 100 remains the cleanest bull story among major indices — a rare combination of deeply discounted valuations relative to US markets, an imminent BoE rate cut, a weaker pound boosting exporters, and commodity price strength. The technical picture is bullish across every timeframe, but RSI at 75 means patient traders should wait for the pullback rather than chase.
The S&P 500 and Dow Jones are playing a critical technical battle at their respective resistance ceilings (7,000–7,050 for SPX; 50,000 for DJIA). How markets digest today’s jobless claims data and Fed Governor Bowman’s comments will determine the near-term direction. A break above 7,050 on the S&P 500 — confirmed on the daily close — is the bull signal experienced traders have been waiting for. Until then, disciplined range-trading and defined risk parameters remain the strategy of choice.
Stay sharp, protect your capital, and let the setups come to you. The next 24 hours will tell us a great deal about the market’s appetite for the next leg higher.