Black Gold: A Complete History of Oil Prices
Black
Gold
A complete history of crude oil — from $1 a barrel to -$37 to $147, through wars, revolutions, pandemics, and now the brink of a new global oil shock
The Lifeblood of
the Modern World
No commodity on earth has shaped the trajectory of civilization — its wars, its economies, its geopolitics, its very atmosphere — quite like crude oil. From a $1 barrel drilled in Titusville, Pennsylvania in 1859, to a moment in April 2020 when oil sellers were literally paying buyers $37 to take barrels off their hands, the price of oil is the most consequential number in global finance.
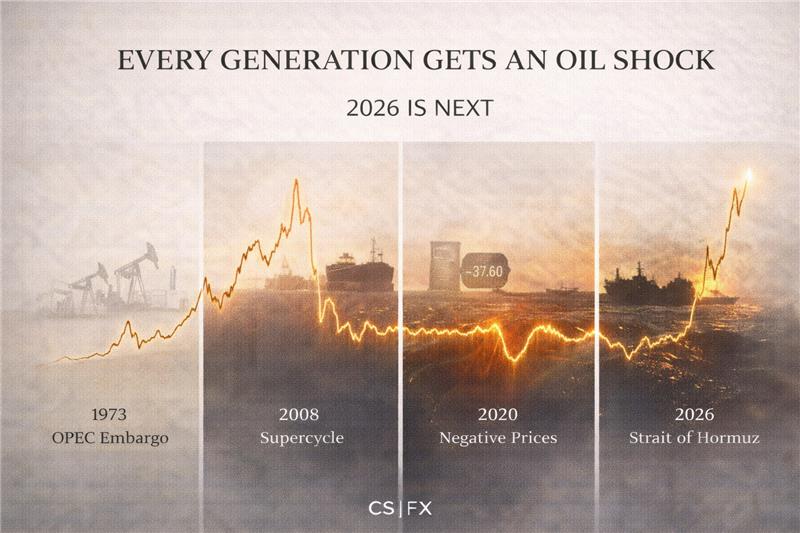
What follows is the complete story: 165 years of price history, the key events that sent oil screaming to stratospheric highs and crashing to historic lows, and the situation unfolding right now in 2026 — a military conflict that has placed a third of the world’s seaborne oil exports in jeopardy and reminded every trader, economist, and head of state exactly why crude oil remains, despite decades of clean energy promises, the irreplaceable axis of global power.
The Long Century
of Cheap Oil
The price of crude oil was, for the better part of a century, almost boringly stable. When Colonel Edwin Drake punched the world’s first commercial oil well in Titusville, Pennsylvania in 1859, petroleum quickly replaced whale oil in lamps — and its price was a few dollars per barrel, measured in nominal terms that would remain roughly in that range for over a hundred years.
For most of this period, the global oil market was dominated not by nation-states but by the “Seven Sisters” — a cartel of seven Western oil companies including Standard Oil (which became ExxonMobil, Chevron, and others), British Petroleum, and Royal Dutch Shell. They controlled production, pricing, and distribution with iron discipline across the Middle East, the Americas, and beyond.
In 1804, whale oil cost $21 per barrel — the equivalent of $575 in today’s money. Petroleum replaced it almost immediately, at a fraction of the cost. For a century, the world ran on cheap oil.
— Historical Price of Oil, Converted to 2025 DollarsThe United States, blessed with vast domestic reserves — from the Pennsylvanian oil fields to the Texas and California booms — could supply most of its own needs. Prices remained low, demand grew steadily, and oil companies reaped extraordinary profits without the geopolitical disruptions that would define the era to come. By 1970, a barrel of crude cost approximately $3.39 — a remarkable steadiness that lulled the industrialized world into total oil dependency.
The First and
Second Oil Shocks
On October 17, 1973, the world changed forever. In response to U.S. support for Israel during the Yom Kippur War, Arab members of OPEC launched an embargo that would permanently end the era of cheap oil. Within a year, prices had quadrupled.
The 1973 Arab oil embargo is the watershed moment in the history of crude oil prices. For decades, Western economies — particularly the United States — had enjoyed near-total energy security, relying on cheap domestic production supplemented by equally cheap Middle Eastern imports that cost less than $1 per barrel to extract. That security was obliterated overnight.
At an OPEC summit in Kuwait City on October 16, 1973, it was announced that the price of oil would jump from $3.01 to $5.12 per barrel — immediately. Two days later, following President Nixon’s request for $2.2 billion in emergency military aid to Israel, the Organization of Arab Petroleum Exporting Countries (OAPEC) announced a full oil embargo against the United States and Western Europe. By January 1974, the price had reached $11.65 per barrel — nearly four times its pre-embargo level. The era of the Seven Sisters was over; OPEC had seized control of the global oil market.
The economic consequences were devastating and long-lasting. Gasoline lines stretched for miles. The U.S. imposed a 55 mph national speed limit. Carmakers scrambled to produce fuel-efficient vehicles — Japanese manufacturers surged to dominance and, for the first time in history, surpassed American car production totals by 1980. Governments across the industrialized world launched frantic searches for alternative energy, accelerating nuclear power programs and beginning the early studies of solar and wind that would eventually bear fruit decades later.
Then, before the world had fully recovered, a second shock struck. The Iranian Revolution of 1978–1979 toppled the Shah, shut down Iran’s oil exports — roughly 3 to 4 million barrels per day — and sent panic through global markets even though the actual supply disruption was only around 4%. Markets do not run on logic alone; they run on fear. The price of crude more than doubled over 12 months, reaching $39.50 per barrel by mid-1979. When Iraq then invaded Iran in 1980, removing another 3 million barrels per day from the market, OPEC oil briefly spiked above $35 per barrel — equivalent to over $120 in today’s dollars. The “second oil shock” had arrived.
Shortages developed and competition in the spot market drove the price of crude barrels up through the $20 and $30 ranges to break $40 as the 1970s came to a close — equivalent to nearly $140 today.
— NPR Historical Energy Analysis, March 2022Every Major
Price Shock in History
Colonel Edwin Drake strikes oil in Titusville, Pennsylvania. Petroleum replaces whale oil. Prices begin at roughly $1–2/barrel and remain stable for a century.
OAPEC embargo against U.S. and Western Europe for supporting Israel. Oil price quadruples from $3/bbl to $12/bbl in four months. The era of cheap oil ends permanently. U.S. imposes 55 mph speed limit; gasoline rationing begins.
Islamic revolutionaries topple the Shah, shutting down Iran’s oil exports. The price more than doubles in 12 months. The subsequent Iran-Iraq War (1980-88) removes 6+ million barrels/day. WTI spikes above $35/bbl — over $120 in today’s dollars.
After years of cutting output to prop prices, Saudi Arabia reverses course in December 1985 and announces it will sell crude at market prices to claw back market share. Oil collapses from $28 to below $10/bbl. North Sea and U.S. shale producers suffer; OPEC loses grip.
Saddam Hussein’s invasion of Kuwait removes 4.3 million barrels/day from the market. Oil spikes to $65/bbl during the Gulf Crisis — then crashes back as coalition forces liberate Kuwait faster than markets expected. The spike was brief but intense.
The 1997 Asian financial crisis triggered a dramatic collapse in oil demand from the region’s fast-growing economies. Combined with oversupply, WTI fell below $11/bbl — its lowest level since the 1970s in nominal terms and the lowest in decades in real terms.
The “third oil shock”: a relentless bull market driven by explosive demand growth from China, India, and emerging economies. Venezuelan production disruptions and the U.S. invasion of Iraq add supply fears. From $30 in early 2003, oil nearly quintuples in five years.
The collapse of Lehman Brothers and the ensuing financial crisis destroys demand overnight. Oil crashes from $147 in July to $32 by December 2008 — a fall of nearly 80% in just six months. OPEC scrambles to cut production. Global demand contracts for the first time since 1982.
Strong global recovery sends oil back above $100. Arab Spring disruptions in Libya, Egypt, and Syria add geopolitical risk premium. Brent averages above $110 for three consecutive years (2011, 2012, 2013) — an unprecedented period of sustained high prices.
U.S. shale oil production doubles in five years, flooding global markets. Saudi Arabia refuses to cut output (to protect market share), and oil crashes 70% — the third largest decline since WWII. Over 150 U.S. oil companies go bankrupt. The oil price hits below $30 by February 2016.
COVID-19 lockdowns destroy 30 million barrels/day of demand. A simultaneous Russia-Saudi Arabia price war floods supply. Storage at Cushing, Oklahoma fills to 83% capacity. With May futures expiring and no storage available, holders pay others to take oil off their hands. WTI trades at negative $37.63/bbl — an event unprecedented in the history of commodity markets.
COVID vaccines trigger a massive demand rebound. Russia’s invasion of Ukraine in February 2022 removes Russian supply from Western markets. WTI spikes to $130+. The energy crisis reshapes European policy; Germany accelerates LNG terminal construction; inflation hits 40-year highs across the developed world.
Oil settles into a $70–90 range as the global economy achieves a “soft landing.” OPEC+ repeatedly cuts production to defend the floor. Growing AI data center energy demand adds a new long-term demand vector. WTI averages ~$77 in 2024, $74 in 2025.
U.S. and Israeli forces conduct strikes on Iran under “Operation Epic Fury,” killing senior Iranian leadership including the Supreme Leader. Iran retaliates with missiles across the Gulf. Tanker traffic through the Strait of Hormuz halts. UBS warns Brent could exceed $120/bbl. The world watches the most dangerous oil supply disruption since 1973.
The Day Oil
Went Negative
April 20, 2020 will stand forever in the annals of financial history as the day an impossibility became reality: crude oil — the world’s most traded physical commodity — fell to a price of negative $37.63 per barrel.
To understand the event, one must understand the mechanics of futures contracts. WTI crude oil is traded via contracts that require physical delivery of 1,000 barrels at Cushing, Oklahoma. On April 20, 2020, the May futures contract was hours away from expiry. Normally, traders either take delivery or sell the contract before expiry. But COVID-19 had accomplished something no previous crisis had managed: it had simultaneously destroyed demand (lockdowns eliminated nearly 30% of global oil consumption) and filled every available storage tank in the world to near capacity.
Storage at Cushing was at 83% of working capacity. Oil traders holding long positions on 108,593 contracts found themselves with a stark choice: take physical delivery of oil they had nowhere to store, or pay someone else to take it. They chose to pay. The price cascaded from $17.85 at market open to negative $37.63 at close — a drop of more than 300% in a single trading day.
The Russia-Saudi Arabia price war, which had erupted just weeks earlier when OPEC+ talks collapsed in early March 2020 — Saudi Arabia immediately slashed its April delivery prices by 20% and ramped production — had already flooded an oversupplied system. The COVID demand shock was the second blow, but it was the lack of storage that delivered the knockout punch.
By the following day, April 21, 2020, the June WTI contract traded at around $20 per barrel, and the spot price recovered to $10 — proving that the negative price was not a reflection of oil’s long-term value, but of a perfect storm of contract mechanics, logistics, and simultaneous unprecedented supply and demand shocks.
WTI crude oil became like “toxic waste or even garbage” to long traders without pre-booked storage on April 20, 2020. They deemed paying $37.63 per barrel to be a lesser loss than taking physical delivery.
— Merton (2020), citing Reuters analysis of the WTI negative price eventAmerica’s
Shale Revolution
Perhaps no single development changed the global oil order more profoundly than the American shale revolution. Using hydraulic fracturing (“fracking”) and horizontal drilling technologies refined through the 2000s, U.S. oil producers unlocked vast reserves in formations like the Permian Basin, Bakken, and Eagle Ford that had been considered economically unrecoverable.
Between 2008 and 2015, U.S. oil production nearly doubled — from 5 million barrels per day to over 9 million — a rise without precedent in the history of American oil. By 2015, the United States had become the world’s third largest oil producer and, for the first time in 40 years, resumed exporting crude oil upon repeal of its 40-year export ban.
The consequences for OPEC were profound. Saudi Arabia faced a binary choice: cut production and yield market share to American producers, or keep pumping and crash prices — hoping to bankrupt higher-cost shale producers. In November 2014, Saudi Arabia chose the latter. The result was the 2014–2016 oil price collapse, with WTI falling from $115 to below $27.
The World’s Most
Dangerous Chokepoint
Every oil crisis in history ultimately reduces to a single geographic question: can the world’s oil move freely to where it needs to go? In 2026, for the first time since 1973, that question has a genuinely uncertain answer.
Why 21 miles of water between Iran and Oman controls the global economy
Operation Epic Fury: The Crisis That Could Redraw the Oil Map
On February 28, 2026, U.S. and Israeli forces conducted military strikes on Iran under the code name “Operation Epic Fury,” killing several senior Iranian leaders. Iran retaliated by launching missiles and drones at Israel, the UAE, Qatar, Kuwait, Bahrain, Jordan, and Saudi Arabia — targeting the very heart of Gulf oil infrastructure.
Tanker traffic through the Strait of Hormuz has effectively ground to a halt as shipping companies take precautionary measures. At least three tankers have already been damaged in the Gulf. Stock futures tumbled in overnight trading — Dow futures dropped approximately 517 points and S&P 500 futures fell 1% — while gold jumped 2% as investors rushed to safe havens.
UBS analysts have warned that a material disruption to Hormuz traffic could send Brent crude above $120 per barrel. Analysts at J.P. Morgan, which had already placed the probability of a U.S. and global recession in 2026 at 35%, are now reassessing those odds dramatically upward. The parallels to 1973 are inescapable — and this time, the world is far more financially leveraged.
The Four
Scenarios for Oil
Based on the current Iran situation and historical precedents, here is how the oil market could evolve over the next 6-12 months:
| Scenario | Description | WTI Price Target | Probability | Comparable Event |
|---|---|---|---|---|
| De-escalation Ceasefire within weeks |
Iran and the U.S. agree to talks. Hormuz reopens. Gulf tankers resume operations. Risk premium fades rapidly. | $65–75 | 30% | 1990 Gulf War (brief spike, rapid recovery) |
| Prolonged Tension Months of uncertainty |
Intermittent disruptions; tankers reroute around Africa adding 12+ days. Insurance costs soar. Saudi Arabia and UAE export at reduced rates. | $85–105 | 40% | Iran-Iraq War 1980–88 |
| Full Closure Hormuz blocked 30-90 days |
Iran mines or physically blockades the Strait. Global recession risk escalates. Emergency SPR releases from U.S. and IEA members. Inflation spikes globally. | $120–150 | 22% | 1973 Arab Embargo (price quadruple) |
| Catastrophic War Full regional conflict |
Attacks on Saudi Aramco infrastructure (echoes of 2019 Abqaiq strike). Iranian missiles hit UAE/Kuwaiti infrastructure. Catastrophic supply destruction. | $160–200+ | 8% | No modern precedent |
Why Oil Always
Comes Back
For fifty years, the world has declared the imminent end of oil. The internal combustion engine would be replaced by the electric motor; coal and gas would be supplanted by solar and wind; petrochemicals would be superseded by bio-alternatives. None of it has happened fast enough to displace crude oil from the center of the global economy.
The reasons are structural and stubborn. Oil is not just a transportation fuel — it is the raw material for plastics, pharmaceuticals, synthetic fertilizers, lubricants, and over 6,000 other products. Global demand has grown in virtually every year since 1950, interrupted only by major recessions and the COVID pandemic. The International Energy Agency projects that even under ambitious clean energy transition scenarios, global oil demand will remain above 75 million barrels per day through 2035.
Oil’s Role in the Global Economy
Top 5 Oil Producers (2025)
The Iron Laws
of Oil Geopolitics
Studying the 165-year price history of oil reveals a set of almost immutable laws that govern how the price responds to the world around it:
Law 1 — Supply Disruptions Are Always Overpriced by Markets. In every major supply shock — 1973, 1979, 1990, 2003 — the actual reduction in supply was smaller than the price reaction suggested. Markets price fear, not just barrels. A 4% drop in supply (as in 1979) produced a 100% rise in price because traders didn’t know how bad it would get.
Law 2 — High Prices Sow the Seeds of Their Own Destruction. Every oil price spike has ultimately been brought down by the same mechanism: high prices incentivize new supply (shale, deepwater, alternative energy) and destroy demand (conservation, efficiency, substitution). The $147 peak of 2008 accelerated the shale revolution that crashed prices in 2014.
Law 3 — OPEC Is Powerful but Not Omnipotent. OPEC controls roughly 40% of global production and has shown repeatedly that it can influence prices — but cannot indefinitely override the economics of supply and demand. When OPEC tried to crush U.S. shale in 2014 by refusing to cut, they succeeded partly — but at the cost of member economies that depended on $100+ oil to balance their budgets.
Law 4 — Geopolitical Risk Premiums Come and Go; But the Next One Always Comes. Every generation declares the end of oil supply disruptions and every generation is surprised when the next one arrives. From 1973 to 1979 to 1990 to 2003 to 2011 (Arab Spring) to 2022 (Ukraine) to 2026 (Iran), the pattern is relentless.
The energy crisis of today is not merely an economic event. It is, as it has always been, a mirror held up to the geopolitical order of the world — and the fracture lines it reveals have never been more dangerous.
— Black Gold, March 2026The Road
Ahead for Oil
The 2026 Iran crisis arrives at a moment of extraordinary structural complexity in global oil markets — one that makes the outcome more uncertain, and the stakes higher, than at any point since the 1970s.
On the supply side, OPEC+ had already been cutting production aggressively to defend price floors, leaving the alliance with theoretically large spare capacity — but much of that capacity sits in the Gulf states that are now themselves under missile threat. Saudi Arabia, the UAE, and Kuwait are simultaneously the world’s spare capacity backstop and the targets of Iranian retaliation. The backstop may not backstop.
On the demand side, AI data centers have emerged as a major new electricity-consuming sector, indirectly supporting natural gas and, through it, oil markets via energy price linkages. China’s demand recovery from COVID remains more fragile than bulls expected, capping the upside — but India’s demand growth continues to surprise to the upside.
The clean energy transition is accelerating but not yet fast enough. Global electric vehicle sales are growing exponentially — reaching over 20% of new car sales in 2025 — but the world fleet of internal combustion vehicles is still expanding faster than EVs can replace them. Oil demand reduction from EVs amounts to perhaps 2-3 million barrels per day globally by 2025, against a total demand of 103 million barrels per day. The displacement is real but marginal.
The wildcard — as it always is — is geopolitics. If the 2026 Iran crisis resolves quickly, oil markets will normalize and the story will fade. If it escalates into a full Hormuz blockade, we could see price levels not seen since the 2008 crisis, with far worse consequences given the already-elevated level of global debt, sticky inflation, and the fragility exposed by the AI disruption in financial markets. The lesson of 165 years of oil price history is that what seems impossible often happens — and that the commodity markets always, eventually, find a new equilibrium. The only question is how much economic destruction occurs along the way.
The World Holds
Its Breath Again
In the spring of 2026, the global oil market stands at an inflection point as consequential as any in the past fifty years. The echoes of 1973 are not merely rhetorical — they are structural, geographic, and alarmingly precise.
History does not repeat, but it rhymes with extraordinary fidelity when oil is the subject. In 1973, a geopolitical conflict in the Middle East caused Arab producers to weaponize oil, quadrupling prices in four months and triggering a decade of inflation, economic stagnation, and a fundamental restructuring of the global energy order. In 2026, a military confrontation — this time initiated by the West rather than by Arab states — has placed the Strait of Hormuz, through which a third of the world’s seaborne oil flows daily, in a state of genuine operational paralysis for the first time in history.
The differences from 1973 are instructive. The United States is no longer a net oil importer — the shale revolution transformed it into the world’s largest producer. Strategic Petroleum Reserves exist and have been deployed before. The IEA member countries collectively hold emergency stocks of over 1.5 billion barrels. These buffers matter. But they do not neutralize the risk — they merely delay it. The SPR can bridge weeks, not months of a full Hormuz closure, and the tanker rerouting around Africa adds 15–20 days of supply chain lag to every Asian import.
What makes 2026 uniquely dangerous is the layering of crises. The Iran conflict does not land on a clean, stable global economy. It arrives into a world already straining under: U.S. tariff wars creating inflation and supply chain fragility; a private credit market showing systemic cracks; an AI-driven technology selloff eroding the wealth effect; sticky inflation that has already kept the Federal Reserve on hold; and a global debt load at historic highs. Oil at $120–150 per barrel in this environment does not merely raise gasoline prices — it tips already-fragile economies into recession while simultaneously preventing the rate cuts that might cushion the blow.
Every energy crisis in history has ultimately resolved. Markets find new equilibria. Supply adjusts. Demand adapts. But in the transition period between crisis and resolution, the economic destruction — to families, businesses, governments, and markets — is real, deep, and lasting.
— Black Gold, March 2026The optimistic reading — a 30% probability in our scenario analysis — is that this crisis, like the 1990 Gulf War spike, proves brief and resolves within weeks. Ceasefire talks begin, tankers resume passage, and the risk premium bleeds out of the price. Markets would rally sharply; the Fed would find its window to cut; and the 2026 Iran episode would become another chapter in the long chronicle of geopolitical crises that shook oil markets and then passed.
The realistic reading — a 40% probability — is prolonged tension lasting months. Rerouted tankers, elevated insurance premiums, intermittent Gulf strikes, and slow-burning diplomatic standoff. In this scenario, oil settles in the $85–105 range, inflation re-accelerates, recession risk rises materially, and J.P. Morgan’s 35% recession probability estimate looks conservative in hindsight.
The frightening reading — an 8% probability that has never felt more plausible in the 21st century — is a full regional war with catastrophic infrastructure destruction in the Gulf. Saudi Aramco’s Abqaiq facility, already struck by Iranian drones in 2019, processes approximately 7% of global oil supply at a single point. A successful strike there, in the context of a broader war, would produce an oil shock with no modern historical parallel. The 1973 embargo would be a footnote by comparison.
What this 165-year history teaches, above all else, is that oil’s story is never truly over. The metal of the 19th century was steel. The metal of the 20th century was oil. The metal of the 21st century may well be lithium or silicon — but the transition is decades long, and in the meantime, every barrel that flows through the Strait of Hormuz, every tanker that navigates the Gulf of Oman, every OPEC+ production decision made in Riyadh carries with it the weight of the entire global economy.
Black gold. It made the modern world. It has broken it repeatedly. And in March 2026, it is doing what it always does — reminding us, at the worst possible moment, just how dependent on it we remain.
Your Questions
Answered
As of early March 2026, WTI crude oil is trading around $70 per barrel, up sharply from the low $60s just days prior. The spike is directly attributable to the U.S.-Israeli military strikes on Iran under “Operation Epic Fury” on February 28, 2026, and the subsequent shutdown of normal tanker traffic through the Strait of Hormuz. Markets are pricing in a geopolitical risk premium — the additional cost above fundamental supply-demand value that reflects the possibility of further supply disruption. UBS analysts warn that a sustained closure of the Strait could send Brent above $120/barrel.
The Strait of Hormuz is a narrow waterway — just 21 miles wide at its narrowest point — separating Iran from Oman at the entrance to the Persian Gulf. Despite its size, it is the single most important oil transit chokepoint on Earth. Approximately 21 million barrels of oil per day pass through it — roughly 20% of global petroleum liquids and one-third of all seaborne oil trade. The primary destinations are Japan, South Korea, India, and China. Crucially, there is no viable short-term alternative route: rerouting tankers around Africa’s Cape of Good Hope adds approximately 15–20 days of transit time and massively increases shipping costs and insurance premiums. Any serious disruption to Hormuz is, effectively, a disruption to the entire global economy.
The parallels are striking and the differences equally important. Similarities: Both involve a military conflict in the Middle East triggering a sudden supply shock to an oil-dependent global economy; both arrive when inflation was already a concern; both involve an imminent threat to physical oil transit. Key differences: In 1973, Arab producers voluntarily chose to embargo the West — a political act that could be reversed politically. In 2026, the risk is physical military interdiction of the Strait, which is harder to reverse and harder to predict. On the other hand, the U.S. is now the world’s largest oil producer (not a net importer as in 1973), and the IEA strategic reserve system didn’t exist in 1973. The buffers are larger — but so is global dependency on Gulf oil in absolute barrel terms.
Yes — it happened on April 20, 2020, when WTI crude briefly traded at negative $37.63 per barrel. It’s important to understand this was a futures contract mechanics event, not a reflection of oil’s intrinsic value turning negative. The May 2020 WTI futures contract was expiring the following day, requiring holders to either take physical delivery of 1,000 barrels of crude oil at Cushing, Oklahoma — or sell the contract. Normally, traders roll their positions into the next contract. But on that day, Cushing storage was at 83% capacity, COVID lockdowns had destroyed roughly 30% of global oil demand, and a simultaneous Russia-Saudi Arabia price war had flooded markets with excess supply. Holders of long positions had nowhere to store the oil they would be forced to take delivery of — so they paid buyers up to $37.63 per barrel to relieve them of the obligation. The next day, the June contract traded at $20. The negative price lasted only for the final trading session of that specific contract.
WTI crude oil reached its all-time nominal high of $147.27 per barrel on July 11, 2008 — with Brent crude reaching $147.50 on the same day. The causes were multiple and compounding: a five-year bull market driven by explosive demand growth from China and India; significant supply disruptions (Venezuela, Nigeria, Iraq); a weakening U.S. dollar (oil is priced in dollars, so a weak dollar inflates the nominal price); rampant commodity speculation via newly accessible exchange-traded funds (ETFs) and index funds; and fear of “peak oil” — the belief that global oil production was approaching its permanent maximum. The crash came swiftly: by December 2008, the same barrel cost $32, as the global financial crisis collapsed demand virtually overnight. In inflation-adjusted (real) terms, the 1979–1980 oil price during the Iran-Iraq War era was actually roughly comparable to or slightly above the 2008 peak, depending on the deflator used.
The U.S. Strategic Petroleum Reserve (SPR), stored in underground salt caverns along the Gulf Coast, can hold up to approximately 714 million barrels and currently holds around 400 million barrels (following large drawdowns in 2022 to combat post-Ukraine energy price spikes that were only partially replenished). At maximum release rates of about 4.4 million barrels per day, the SPR can theoretically replace U.S. net oil imports for roughly 90 days. However, releasing the SPR does not address the global price — it addresses only U.S. domestic supply. Since oil is a globally traded commodity priced on international markets, even a full SPR release would moderate U.S. pump prices somewhat but would not prevent a global price spike from a Hormuz closure. The IEA member countries collectively have larger combined reserves, and coordinated IEA releases — as happened in 2022 — can be more market-moving, but still only a short-term bridge.
OPEC — and its expanded form OPEC+, which includes Russia and other non-OPEC producers — retains significant but not unlimited market influence. The alliance controls roughly 40% of global oil production and has repeatedly demonstrated the ability to influence prices through coordinated supply cuts. OPEC+ has made multiple rounds of production cuts since 2022 to defend price floors. However, its power has genuine limits: the U.S. shale industry acts as a “swing producer” that can ramp production relatively quickly when prices rise, capping the upside; member states frequently cheat on their quotas; and the alliance’s internal politics — particularly the Saudi-Russia relationship — are frequently strained. The 2020 price war between Saudi Arabia and Russia, which helped send oil to negative prices, demonstrated how devastating OPEC disunity can be. In the current 2026 crisis, several key OPEC members — the UAE, Saudi Arabia, Kuwait — are themselves targets of Iranian missile attacks, creating a deeply unusual situation where OPEC’s spare capacity sits in active conflict zones.
The transmission channels from oil price to the everyday economy are broad, deep, and fast. Directly: gasoline and diesel prices rise immediately — a $30/barrel increase in crude typically translates to roughly a $0.70/gallon increase at the pump in the U.S. Heating oil, jet fuel, and diesel for trucks and farm equipment all rise proportionately. Indirectly: virtually every product has an oil component in its supply chain — from plastic packaging to synthetic fertilizers to the diesel that powers delivery trucks. A major oil spike is therefore a tax on every consumer for every purchase. Macroeconomically: sustained high oil prices raise inflation, reducing consumer purchasing power and corporate margins. Central banks face a dilemma — raise rates to fight oil-driven inflation and risk recession, or hold rates and allow inflation to become entrenched. The 1973 and 1979 oil shocks gave rise to “stagflation” — the toxic combination of high inflation and stagnant growth — a scenario economists and central bankers now fear could recur in the 2026 crisis, particularly given that the Fed is already on hold with inflation above target.
Yes — but not quickly enough to be relevant in the current crisis or the next decade. Global electric vehicle sales reached approximately 20% of new car sales in 2025 — a remarkable achievement. But the global fleet of internal combustion engine vehicles exceeds 1.3 billion units, and EVs have only displaced an estimated 2–3 million barrels per day of oil demand globally, against total demand of approximately 103 million barrels per day. The IEA’s most optimistic net-zero scenario still requires approximately 24 million barrels per day of oil in 2050. The more nuanced reality is that oil’s role in transportation is declining gradually, but its role in petrochemicals — plastics, pharmaceuticals, synthetic materials — is actually growing. Renewable energy growth is also increasing the demand for energy-intensive materials whose production relies heavily on fossil fuels. The transition is real and accelerating, but measured in decades, not years. For the foreseeable future — certainly through the 2026 crisis and the 2030s — oil remains irreplaceable.
Oil price spikes create significant winners alongside the many losers. Countries that benefit: major net oil exporters including the United States (shale producers), Norway, Canada (oil sands), Brazil (deepwater pre-salt), and Gulf states — Saudi Arabia, UAE, Kuwait, Iraq — to the extent they can safely produce and export. Russia also benefits economically, though its ability to capture the windfall is constrained by Western sanctions. Sectors that benefit: Integrated oil majors (ExxonMobil, Shell, BP, Chevron, TotalEnergies) see dramatically higher revenues; oil services companies (Halliburton, SLB) boom; pipeline infrastructure operators benefit from increased throughput; defense contractors benefit from increased military procurement by energy-importing nations; gold and other hard asset prices typically rise as inflation hedges. Sectors that suffer most: Airlines (jet fuel is ~25–30% of operating costs); trucking and logistics; petrochemical manufacturers; consumer discretionary spending; and any emerging market economy that is a significant net oil importer — particularly India, South Korea, Japan, and many African nations.