Commodity Market Analysis — February 26, 2026 | Gold, Silver, Crude Oil, Natural Gas, Copper
Commodity Market Analysis
February 26, 2026
A comprehensive daily briefing covering Gold, Silver, WTI Crude Oil, Natural Gas, and Copper — with full technical analysis, economic calendar review, and four-pair forex trade setups for active traders navigating a geopolitically charged session.
Macro Overview & Market Context
As of 08:00 UTC, Feb 26 2026Commodity markets are entering the February 26 session carrying the weight of three converging forces: an unresolved nuclear standoff between the United States and Iran, a persistently soft US Dollar (DXY at 97.62), and a post-Supreme Court tariff ruling that has reshuffled the macro narrative for the week.
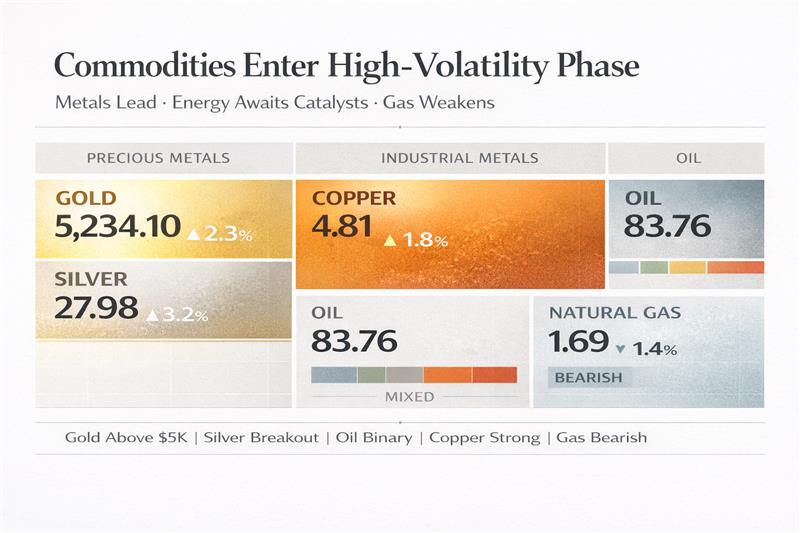
Gold has extended its fifth consecutive session of gains, consolidating above the psychologically critical $5,000 level after printing a fresh breakout high. Silver posted its sharpest single-day advance since early February on Tuesday, driven by both safe-haven demand and renewed industrial interest tied to AI infrastructure and solar energy applications. Crude oil is locked in a tense $65–$67.20 consolidation range, where the outcome of Thursday’s US–Iran nuclear talks in Geneva represents the single most explosive binary catalyst of the near-term session window.
Natural gas has definitively broken its ascending channel from 2023 lows — a technically significant development that aligns with post-winter demand contraction and recovering supply following the January freeze-off event. Copper, meanwhile, sits at historically elevated levels near $5.96/lb, underpinned by ongoing supply deficits and structural demand from AI data centres, EV manufacturing, and grid electrification.
Commodity Snapshot — Live Prices & Key Levels
Full Technical Analysis — Commodities
What the charts are actually saying today — without the noise.
| Instrument | Current Price | Trend (Daily) | Pattern | Key Support | Key Resistance | RSI (14) | Signal |
|---|---|---|---|---|---|---|---|
| Gold (XAU/USD) | $5,205 | Bullish | Higher swing high confirmed · Corrective pullback in progress | $5,000 / $4,841 | ATH Zone / $5,280 | 55.08 (Buy) | Strong Buy |
| Silver (XAG/USD) | $90.10 | Bullish | Breakout from descending TL · No new HH yet (watch $92.15) | $71.97 / $70.00 | $92.15 / $100 | ~60 (Bullish) | Buy — Hold Longs |
| WTI Crude (CL) | $65.56 | Slightly Bear | Double Top at $66 · Below 100-SMA resistance | $65.00 / $62–63 | $67.20 / $70.00 | ~42 (Neutral/Bear) | Neutral – Event Risk |
| Brent Crude | $70.88 | Neutral | Rangebound — geopolitical premium intact | $69.50 / $67.00 | $72.00 / $74.50 | ~44 (Neutral) | Watch US–Iran Talks |
| Natural Gas (NG) | $3.10 | Bearish | Ascending channel breakdown · 100-SMA crossed below 200-SMA | $2.936 / $1.900 | $3.179 / $3.25 | ~38 (Falling) | Sell Rallies |
| Copper (HG) | $5.96/lb | Bullish | Upper Bollinger Band hug · Trend expansion phase | $5.75 / $5.55 | $6.10 / $6.50 | ~58 (Bullish) | Buy Dips |
Gold Technical Narrative: Gold’s daily chart remains textbook bullish — it’s formed a higher swing high, confirming continuation of the primary uptrend. Price is currently undergoing a healthy corrective pullback that could retest the $5,000 psychological level. This level is not a threat to the bull trend; it’s a buying opportunity. All 12 moving averages from the 5-day to the 200-day are aligned bullishly (Strong Buy). The $4,841 level serves as the trade invalidation point for current longs. The megaphone/broadening wedge pattern that was flagged in early February has resolved to the upside. The next record high attempt is a matter of when, not if.
Silver Technical Narrative: Silver’s most significant technical development this week is the clean breakout above its descending trendline from the January highs, combined with a structural shift to higher swing formations. Silver surged approximately 24% from its Fibonacci wave-B support before finding the current consolidation zone. The $92.15 level is the immediate hurdle — a decisive weekly close above this converts silver into unambiguous price-discovery territory with technical extensions pointing to $100 and $120 sequentially.
WTI Crude Technical Narrative: Crude’s short-term chart shows a completed double top pattern near $66.00, with sellers defending this ceiling with conviction. Price is currently hovering just below the 100-SMA — a level that has flipped from support to dynamic resistance. The neckline of the double top sits at $65.00; a sustained break below this opens the door to the $62–$63 support zone. The counter-scenario (bull breakout above $67.20) would target $70 and above, but requires either a breakdown in US–Iran talks or a major EIA inventory draw.
Natural Gas Technical Narrative: The ascending channel from the 2023 lows has been definitively broken. The 100-SMA has crossed below the 200-SMA — a “death cross” confirmation that the structural uptrend is exhausted. Stochastic has pulled back sharply from overbought territory with ample room to fall, and RSI is trending lower from elevated levels without reaching oversold conditions yet. This means the path of least resistance is continuation lower toward the Fibonacci targets, with the multi-year $1.900 floor being the ultimate bear target if the decline accelerates.
High-Impact Economic Calendar
USA · UK · Japan · Australia · Europe · China — Feb 26, 2026| Time (UTC) | Country | Event | Impact | Forecast | Previous | Commodity Effect |
|---|---|---|---|---|---|---|
| 00:30 | 🇦🇺 Australia | CPI Monthly (Jan) | High | +2.6% YoY | 2.5% YoY | AUD / Gold safe-haven dynamic |
| 01:30 | 🇯🇵 Japan | Industrial Production (Jan, prelim) | High | — | — | USD/JPY direction; Copper demand signal |
| 02:00 | 🇨🇳 China | NBS Manufacturing PMI (Feb) | High | 50.3 | 50.1 | Copper, Iron Ore, Crude demand outlook |
| 02:45 | 🇨🇳 China | Caixin Manufacturing PMI (Feb) | High | 50.5 | 50.3 | Metals complex — key demand driver |
| 07:00 | 🇩🇪 Germany | GDP Q4 2025 (Final) | High | −0.2% QoQ | −0.3% QoQ | EUR/USD · Energy demand in Europe |
| 09:00 | 🇪🇺 Eurozone | CPI Flash Estimate (Feb) | High | 2.3% YoY | 2.5% YoY | ECB rate path · EUR/USD · Gold USD impact |
| 09:30 | 🇬🇧 UK | BoE Consumer Credit / Mortgage Approvals | Medium | — | — | GBP/USD; indirect |
| 13:30 | 🇺🇸 USA | Initial Jobless Claims (Weekly) | High | 215K | 219K | DXY direction · Gold inverse |
| 13:30 | 🇺🇸 USA | Durable Goods Orders (Jan) | High | +0.8% | −3.1% | Copper (industrial demand proxy) · USD |
| 13:30 | 🇺🇸 USA | Q4 2025 GDP Second Estimate | High | +2.3% annualized | +2.3% (1st est.) | All commodities · DXY · Fed rate path |
| 15:30 | 🇺🇸 USA | EIA Crude Oil Inventories (Weekly) | High | API suggested +13.4M bbls build | — | WTI/Brent — Most critical oil event today |
| TBD | 🇺🇸🇮🇷 USA/Iran | Nuclear Talks — Geneva (US Delegation / Iran FM) | High | Uncertain | N/A | WTI/Brent — +$15–20 tail risk on breakdown |
Four-Pair Forex Technical Analysis & Trade Setups
Currency markets are directly shaping the commodity complex right now — a weaker dollar lifts gold, a hawkish BoJ strengthens the yen and pressures carry trades, and EUR/USD direction signals risk appetite for the session. Here’s what the charts and fundamentals are telling us on all four major pairs today.
EUR/USD is trading at 1.1818, having bounced sharply after the US Supreme Court struck down Trump’s reciprocal tariff authority earlier this week. The pair is navigating in a well-defined range with 1.18 acting as a magnetic support and 1.1850 as the key resistance. The post-tariff ruling USD weakness has provided a near-term tailwind for EUR. Eurozone CPI (due today at 09:00 UTC) could be a major catalyst — a softer reading would reduce ECB hawkishness and may pressure EUR, while inline or hotter data supports upside continuation. The medium-term consensus points to 1.2110–1.2700 by end-2026.
GBP/USD is testing the 1.3520 area as BoE rate expectations support Sterling. The pair is retesting a major broken trendline amid the broader USD weakness narrative — a technically important level that, if held, confirms bullish continuation. The pound is also receiving support from BoE rate expectations. Above 1.3520, the next structure target is toward 1.3600–1.3650. A break below 1.3500 would shift the short-term bias back to neutral and suggest that the trendline retest failed.
USD/JPY is in a corrective phase after a sharp rally, holding above the 155.25 support cluster. The key complication today is a Mainichi report citing PM Takaichi expressing reservations about further BoJ rate hikes in her meeting with Governor Ueda — this yen-negative development is pushing USD/JPY above a key downward trendline. If the pair sustains above the trendline breakout, the next upside target is the 156.81 zone, followed by 157.65 resistance. Bulls eyeing this pair should note that a surprise hawkish BoJ signal or Japanese Industrial Production beat could quickly reverse gains. For gold traders: JPY strength generally benefits gold as a safe-haven correlation; further JPY weakness is relatively neutral.
XAU/USD is in a textbook bullish primary trend. Investing.com’s technical summary shows all 12 moving averages — from the 5-day to the 200-day — aligned as Buy or Strong Buy. The daily RSI at 55.08 suggests the market is bullish but not overbought, meaning there is substantial room for continuation before exhaustion signals appear. After the higher swing high breakout confirmed earlier this week, price is now pulling back in healthy correction mode. The $5,000 psychological level is the definitive line in the sand — a retrace to that area without forming a lower swing low would represent a textbook “buy the dip” opportunity. MACD at +4.05 confirms bullish momentum. Invalidation: daily close below $4,841.
Risk Environment & Geopolitical Map
| Risk Factor | Status | Commodity Impact | Direction | Time Horizon |
|---|---|---|---|---|
| US–Iran Nuclear Talks (Geneva) | Active · Ongoing | WTI Crude · Brent | $±15–20/bbl on outcome | Next 12–24 hrs |
| US Supreme Court Tariff Ruling | Resolved — USD Bearish | DXY · Gold · EUR/USD | USD Weakness → Gold Bullish | Near-term |
| EIA Crude Inventory (Today) | Pending 15:30 UTC | WTI · Brent · RBOB | API showed +13.4M bbl build (bearish) | Today |
| Fed Rate Path / US GDP | Q4 GDP est. due today | Gold · USD · All metals | Strong GDP = USD strength = Gold pressure | Today 13:30 UTC |
| China PMI (NBS + Caixin) | Due 02:00–02:45 UTC | Copper · Iron Ore · Oil | Above 50.3 = metals bullish impulse | Asian session |
| Eurozone CPI (Flash) | Due 09:00 UTC | Gold · EUR/USD | Lower CPI = ECB dovish = EUR weak = Gold uncertain | European session |
| BoJ Rate Path / Japan Econ Data | PM skeptical of hike | USD/JPY · Gold carry | PM Takaichi dampens BoJ hawkishness → JPY weak | Ongoing |
| World Bank Commodity Outlook 2026 | Bearish Long-Term View | Broad commodities | Prices to hit 6-year low; oil surplus 1.2M bbl/day | Full-year structural |
Today’s Trade Bias Summary
| Instrument | Bias | Entry Idea | Stop Loss | Target | Key Condition |
|---|---|---|---|---|---|
| Gold (XAU/USD) | Buy on Dip | $5,000–$5,050 | $4,841 | $5,280 → New ATH | No lower swing low forms |
| Silver (XAG/USD) | Hold Longs | Above $88 on pullback | $71.97 | $92.15 → $100 | HH breakout above $92.15 |
| WTI Crude | Neutral / Short Bias | Sell rally near $66–$66.50 | $67.30 | $62–$63 | Confirm EIA build; no Iran war premium |
| Natural Gas | Sell Rallies | $3.15–$3.18 resistance zone | $3.30 | $2.93 → $2.88 | Stays below descending TL |
| Copper | Buy Dips | $5.75–$5.80 | $5.55 | $6.10+ | China PMI holds above 50 |
| EUR/USD | Range Long | 1.1780–1.1800 | 1.1750 | 1.1850 → 1.1920 | Hold above 1.18 support |
| GBP/USD | Cautious Long | 1.3495–1.3510 | 1.3480 | 1.3555 → 1.3620 | Trendline holds |
| USD/JPY | Long Breakout | 155.50–155.70 | 155.20 | 156.81 → 157.65 | PM Takaichi keeps BoJ dovish |
| XAU/USD (Swing) | Strong Buy | Dip to $5,000–$5,050 | $4,841 | $5,280 | 12/12 MAs aligned bullishly |
Conclusion
The Session in Perspective — February 26, 2026
Today’s session is defined by a single, overriding theme: geopolitical binary risk. The US–Iran nuclear talks in Geneva carry the potential to reprice the entire energy complex by $15–20/bbl in either direction within hours. That reality demands that crude oil traders manage position size with unusual discipline today, regardless of what the chart patterns say.
Gold is the standout performer of the week, and rightly so. The combination of a structurally weaker dollar (post-Supreme Court tariff ruling), persistent geopolitical risk premium, and a technical chart that is literally signalling “Strong Buy” across every single moving average presents a rare alignment. The $5,000–$5,050 area is the buy zone; the $4,841 level is where the bull thesis is invalidated. Those parameters are clean, and that’s what active traders want.
Silver’s breakout is real and technically confirmed, though the $92.15 swing high remains an important hurdle. A weekly close above this level would signal that silver is entering full price-discovery territory — a genuinely rare setup that could see the metal press toward $100 in the coming weeks. Natural gas is the one commodity where the structural story has clearly shifted bearish following the ascending channel breakdown and the 100-SMA/200-SMA death cross.
On the forex side, the USD is caught between near-term weakness (post-SOTU, post-tariff ruling) and potential strength catalysts (Q4 GDP, Durable Goods, Jobless Claims all due today). The EUR/USD 1.18 magnet and GBP/USD trendline retest are the cleanest setups — range-defined, technically clear, and manageable from a risk perspective.
This report is for informational and educational purposes only and does not constitute investment advice. All prices referenced are sourced from Bloomberg, Reuters, FXDailyReport, RoboForex, and Investing.com as of the February 26, 2026 morning session. Always verify prices through your broker before executing any trade.