Commodity Market Analysis — February 27, 2026 | Expert Trading Report
Daily Market Intelligence Report
Commodity Market Analysis
Executive Summary
Commodity markets on February 27, 2026 are navigating a complex confluence of geopolitical uncertainty, dollar softness, and shifting macro expectations. Gold holds firm at historic levels near $5,180 after its late-January all-time high of $5,595. Silver surges sharply today, approaching the critical $92 resistance zone. WTI crude oil is staging a recovery within its ascending channel — trading at $66.25 — underpinned by lingering US–Iran nuclear tensions even as a third round of Geneva talks concluded without a deal. Natural gas remains under pressure at $2.89/MMBtu after an undersized EIA storage draw and warmer weather forecasts. The dollar index is modestly firmer at 97.80 yet remains near three-year lows. With major US economic data looming next week (NFP, ISM PMI), risk is skewed toward continued precious metals strength and crude oil consolidation.
Market-Moving News — Last 10 Hours
| Time (UTC) | Commodity | Headline | Impact |
|---|---|---|---|
| ~02:00 | WTI / Brent | US–Iran 3rd round of nuclear talks in Geneva ends without a deal; technical talks to resume in Vienna next week. Oman mediating; WTI settles ~$65–$66 range. OPEC+ widely expected to consider production ramp-up in upcoming meetings. | Mixed — eases war premium but no deal yet keeps geopolitical risk elevated |
| ~02:30 | Gold / Silver | Silver surges +3.2% on MCX (₹8,340/kg to ₹2,68,009). Safe-haven demand linked to Iran talks stalling + Pakistan-Afghanistan border tensions. Silver ETF holdings bounced strongly to 833.89 MOz on Feb 25 from multi-month low. | Bullish for precious metals — institutional dip-buying confirmed |
| ~03:00 | Gold | J.P. Morgan reiterates $6,300 gold target for year-end 2026; sees central bank demand averaging 585 tonnes/quarter. PBoC extends gold purchases for 15th consecutive month. | Strongly bullish — structural demand narrative reinforced |
| ~04:00 | Nat Gas | EIA weekly storage: draw of only −52 bcf vs. five-year average −168 bcf. Warmer weather forecast for most of US (March 3–12). Natural gas retreats to 5-month low in futures. | Bearish — supply overhang re-emerging as winter demand fades |
| ~05:00 | Copper | Copper futures at $6.10/lb (+1.75%). Trump expected to reintroduce copper tariff plans in 2026; pre-tariff stockpiling continues. COMEX inventories remain elevated. Silver Futures on Investing.com show +6.07% daily gain. | Bullish short-term on tariff front-running; long-term fundamentals mixed |
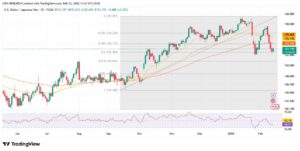
| ~06:00 | Forex / DXY | USD/JPY falls to three-year low after BoJ signals further rate hike potential; DXY near three-year lows at 97.80. Fed’s Goolsbee says rates can come down “but don’t want to front-load before inflation eases.” Markets price 2–3 Fed cuts in 2026. | Supportive for commodities — weaker dollar boosts dollar-denominated assets |
| ~07:00 | Crude Oil | OPEC+ likely to consider raising output at upcoming meeting; Goldman Sachs raised Q4 2026 oil forecast on tighter OECD inventories. IEA had warned supply may outpace demand, creating sizable surplus in 2026. WTI 52-week range: $54.98–$78.40. | Neutral to slightly bearish medium-term; short-term supported by Iran risk premium |
| ~07:30 | Silver | SEBI directs Indian mutual funds to use domestic spot prices (not LBMA) for gold/silver valuations from April 1, 2026. Silver ETF inflows to Indian markets likely to increase. Analyst Praveen Singh (Mirae Asset Sharekhan) targets $92–$96 for silver. | Bullish — regulatory tailwind from India’s large physical silver market |
Economic Calendar — High-Impact Events
The following events are scheduled for February 27, 2026 and the week ahead. All events carry potential to move commodity and forex markets. High-impact events are marked with a red dot.
| Date / Time | Country | Impact | Event | Forecast / Previous | Market Implication |
|---|---|---|---|---|---|
| Feb 27 — All Day | 🇯🇵 Japan | High | Tokyo CPI (MoM & YoY excl. Food & Energy) — Feb | YoY ~2.2% expected | BoJ rate hike expectations; Yen movement; USD/JPY direction |
| Feb 27 — 00:30 UTC | 🇯🇵 Japan | High | Tokyo CPI MoM (Excl. Food & Energy) | Previous: +0.4% | If hot → JPY strength → commodities pullback risk |
| Feb 27 — Morning | 🇬🇧 UK | High | GfK Consumer Confidence — February | Previous: −20 | GBP/USD direction; affects risk sentiment globally |
| Mar 2 — 09:00 UTC | 🇪🇺 Eurozone | High | Euro Area CPI Flash (YoY) — Feb | Previous 1.7% (Jan) | ECB rate path; EUR/USD; gold inverse correlation |
| Mar 2 — 15:00 UTC | 🇺🇸 USA | High | ISM Manufacturing PMI — February | Previous: ~49.0 (contraction) | Risk-off if miss → gold bullish; oil demand sentiment |
| Mar 4 — 13:15 UTC | 🇺🇸 USA | High | ADP Nonfarm Employment Change — Feb | Prev: 183K | Dollar direction; metals inverse; precursor to NFP |
| Mar 4 — 15:00 UTC | 🇺🇸 USA | High | ISM Services PMI — February | Prev: 52.8 | Broad risk sentiment; USD strength signal |
| Mar 4 — 19:00 UTC | 🇺🇸 USA | Med | Federal Reserve Beige Book | — | Qualitative Fed outlook; gold & USD volatility |
| Mar 5 — 13:30 UTC | 🇺🇸 USA | High | Initial Jobless Claims (weekly) | Prev: ~224K | Labor market health; Fed cut timing sensitivity |
| Mar 6 — 13:30 UTC | 🇺🇸 USA | High | Nonfarm Payrolls & Unemployment Rate — Feb | Prev: ~145K / 4.1% | Biggest event of the week; massive gold & dollar volatility |
| Mar 2–6 | 🇨🇳 China | High | National People’s Congress (NPC) / Government Work Report | GDP target ~5.0% | Copper & industrial metals; oil demand outlook; AUD/USD |
| Mar 3 | 🇦🇺 Australia | High | RBA Interest Rate Decision | Expected hold at 4.10% | AUD/USD; iron ore & copper indirect demand signal |
Forex Market Context
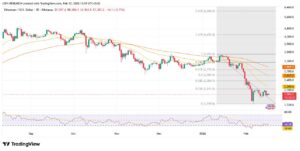
Currency markets are exerting a powerful influence on commodities today. The US Dollar Index (DXY) trades at 97.80 — near three-year lows — as BoJ rate hike signals and persistent Fed rate-cut expectations weigh on the greenback. This USD weakness is a structural tailwind for dollar-denominated commodities like gold, silver, oil, and copper. EUR/USD holds at 1.1811, and USD/JPY is under pressure as carry-trade unwind accelerates.
Deep-Dive Technical Analysis — 4 Major Commodities
Each commodity analysis below covers: current price, trend assessment, key support/resistance levels, candlestick patterns, technical indicators (RSI, MAs), and a specific trade setup for active traders operating in the next 24 hours.
Trend Analysis
Gold remains in a broad Broadening Wedge / Megaphone pattern on the daily chart — a formation reflecting intense bull/bear battles at historic price levels. After reaching an all-time high of $5,595.42 on January 29, price pulled back sharply to $4,401.72 on strong US jobs data, then stabilized and climbed back to current $5,180 levels by late February. The 100 SMA remains above the 200 SMA, confirming the primary bullish trend is intact. The price recently tested the midpoint of the megaphone pattern and is staging an ascending triangle breakout, currently above the key $5,100 support-turned-resistance level.
Candlestick Patterns
On the H4 chart, gold shows a bullish ascending triangle breakout confirmed earlier this week — consistent with the gold.com analysis noting the formation held for three consecutive weeks. The daily chart reveals two consecutive bullish engulfing candles from the $4,856 demand zone. On the H1, a hammer / doji consolidation near $5,150 suggests the market is gathering momentum before the next leg. No significant bearish reversal patterns present on short-term timeframes.
Key Price Levels
| Parameter | Long Setup | Short Setup |
|---|---|---|
| Entry Trigger | Break & close above $5,208 with volume | Rejection candle at $5,208–$5,210 on H4 |
| Target 1 | $5,266 | $5,100 |
| Target 2 | $5,320 | $5,037 |
| Stop Loss | $5,153 (below structure) | $5,228 (above resistance) |
| Risk/Reward | ~1:2.0 | ~1:1.8 |
| Bias | Preferred: Long above $5,208 | Await confirmation | |
Key driver: Fed rate-cut expectations remain the dominant macro force. Any dovish Fed commentary or weak US data out of next week’s calendar would push gold toward $5,320+. J.P. Morgan targets $6,300 by year-end.
Trend Analysis
Silver’s price action in 2026 has been extreme. The metal hit an all-time high of $121.636 on January 29, 2026 — a historic milestone driven by speculative fervor, CME margin hike-forced liquidation, then a dramatic crash. From that peak, silver corrected sharply before finding the $70 support level, which held fast. The subsequent rally — +9.3% in the week ending February 20 — brought the metal to ~$88–$90, and today’s surge brings it near the key $92 resistance zone. The weekly chart confirms a bullish trend with higher lows. EMA50 remains intact as dynamic support.
Candlestick Patterns
Today’s daily candle is shaping up as a strong bullish marubozu / large bullish body, confirming continuation buying momentum. On the H4, a morning star reversal pattern formed at the $84 support zone earlier this week, which preceded the current rally. The broader weekly chart shows a bullish engulfing from the $70 level. RSI showing negative divergence on the short-term (H4) near $90–$92, suggesting a brief pullback before the next push — a warning signal noted by analysts.
Key Price Levels
| Parameter | Long Setup | Short Setup |
|---|---|---|
| Entry Trigger | Pullback to $86–$87 support zone | Rejection at $92 with bearish RSI divergence |
| Target 1 | $92.00 | $87.00 |
| Target 2 | $96.00 | $84.00 |
| Stop Loss | $83.50 | $93.50 |
| Risk/Reward | ~1:2.3 | ~1:2.1 |
| Bias | Caution near $92 | Look for dip-buy at $86–$87 | |
Key driver: Structural supply deficit + solar/EV industrial demand + Indian market reform (SEBI pricing change). Silver is 25% YTD. Analyst consensus: $84–$92 near-term trading range. Next major resistance at $96 requires a fundamental catalyst.
Trend Analysis
WTI crude is trading inside a well-defined ascending channel, having pulled back recently to test the channel bottom and now staging a recovery. The 100 SMA remains above the 200 SMA — confirming the near-term path of least resistance is to the upside — though the broader medium-term trend since early 2025 has been a descending channel reflecting structural oversupply concerns. Today’s price of $66.25 is near the 38.2% Fibonacci extension at $65.63, with bulls targeting $66.26 (50% Fib) and $66.90 (61.8% Fib). The 52-week range spans $54.98–$78.40.
Candlestick Patterns
On the H4, yesterday’s session showed a long lower wick / hammer candle at the $65.00 structural support area — a textbook bullish rejection signal. Today’s follow-through candle is forming a bullish engulfing on the H1 chart. The daily chart recently printed a three white soldiers pattern off the $60–$61 low, which preceded the current recovery leg. The $65.00 level is acting as the pivot — sellers tried and failed to breach it, making it a well-tested support now.
Key Price Levels
| Parameter | Long Setup | Short Setup |
|---|---|---|
| Entry Trigger | Hold above $65.00 + break above $67.20 | Rejection at $67.20 with bearish candle |
| Target 1 | $67.20 → $67.68 | $65.00 |
| Target 2 | $68.95 (channel top) | $63.50 |
| Stop Loss | $64.50 (below channel base) | $67.90 |
| Risk/Reward | ~1:2.2 | ~1:2.0 |
| Bias | Preferred: Long above $65, target $67.20–$67.68 | |
Key drivers: US–Iran talks stalled (geopolitical premium stays); OPEC+ may raise production (bearish medium-term); EIA forecasts Brent at $58/bbl average for 2026. Short-term bullish inside channel; long-term supply overhang = headwind above $70.
Trend Analysis
Natural gas has plummeted from its January 2026 spike (when Henry Hub hit $4.875/MMBtu amid Winter Storm-driven record 360 bcf storage withdrawals) to a 5-month nearest-futures low of ~$2.89 today. The trend is firmly bearish on the short-term, driven by: (1) an undersized EIA draw of only −52 bcf vs. −168 bcf five-year average; (2) above-normal temperature forecasts for March 3–12; (3) rising Lower-48 production at 112.7 bcf/day (+6.5% YoY). The EIA projects 2% production growth in 2026. Support is being tested near the $2.85–$2.90 zone.
Candlestick Patterns
Natural gas is forming a falling wedge pattern on the short-term chart — a classically bullish reversal formation suggesting sellers are losing momentum as the lower highs and lower lows converge. Price is currently testing the 38.2% Fibonacci retracement at $3.068 from the recent swing high at $3.193. The daily chart shows a sequence of bearish marubozu candles but with shrinking range, which is a cautionary signal for shorts. A bullish breakout from the wedge would target $3.10–$3.19 first.
Key Price Levels
| Parameter | Falling Wedge Long | Continuation Short |
|---|---|---|
| Entry Trigger | Breakout above wedge resistance + close above $2.98 | Rejection at $3.068 with bearish candle |
| Target 1 | $3.068 (38.2% Fib) | $2.70 |
| Target 2 | $3.114 (61.8% Fib) | $2.55 |
| Stop Loss | $2.79 (below wedge) | $3.10 |
| Risk/Reward | ~1:1.9 | ~1:2.0 |
| Bias | Primary bias: Bearish | Secondary: Wedge breakout watch | |
Key driver: Warmer US weather is the decisive near-term bearish catalyst. LNG export flows remain near record highs (~18.5 bcfd), providing a demand floor. Watch temperature forecasts closely — any cold snap reversal could trigger a violent short squeeze given how extended the move lower has been.
Full Commodity Market Snapshot
| Commodity | Current Price | Daily Change | 52-Wk Range | YTD % | Trend | Signal |
|---|---|---|---|---|---|---|
| Gold (XAU/USD) | $5,180.41/oz | +0.82% | $2,915 – $5,595 | ~+25% | Bullish — consolidating | Buy Dips |
| Silver (XAG/USD) | $89.69/oz | +3.20% | $30 – $121.64 | ~+25% | Bullish — approaching resistance | Watch $92 |
| WTI Crude Oil | $66.25/bbl | +1.27% | $54.98 – $78.40 | ~−3% | Ascending channel — cautious | Buy $65 Hold |
| Brent Crude | $71.91/bbl | +1.72% | $60 – $79 | ~−4% | Recovery in progress | Neutral |
| Natural Gas (Henry Hub) | $2.89/MMBtu | −1.43% | $2.65 – $7.72 | ~−62% | Bearish — 5-month low | Avoid / Watch |
| Copper (COMEX) | $6.10/lb | +1.75% | $4.03 – $6.58 | ~+34% | Bullish — tariff-driven | Bullish |
| Platinum | ~$1,070/oz | +0.4% | $870 – $1,150 | ~+12% | Moderate recovery | Hold |
| Corn (CBOT) | ~$475/bu | +0.40% | $400 – $510 | ~−5% | Sideways / recovery | Watch |
| Wheat (CBOT) | ~$545/bu | +0.75% | $490 – $620 | ~−8% | Bearish / slight bounce | Sell Rally |
| Soybean Oil | ~$48.5¢/lb | +1.71% | $38 – $55¢ | ~+8% | Mild recovery | Watch |
Fundamental Drivers — What’s Moving Markets
| Driver | Current Status | Impact | Primary Commodity Affected |
|---|---|---|---|
| US–Iran Nuclear Talks | 3 rounds completed; no deal. Vienna technical talks next week. Trump deadline looming. | Geopolitical risk premium ongoing; war risk unresolved | WTI / Brent 🔼 · Gold 🔼 |
| Federal Reserve Policy | 2–3 rate cuts priced for 2026. Goolsbee: “can come down but no front-loading.” Powell term ends May 2026. | Dollar weakness = commodity tailwind; gold structural support | Gold 🔼 · Silver 🔼 · DXY 🔽 |
| OPEC+ Production Decision | Likely to consider output increase at upcoming meeting. IEA warns of supply surplus in 2026. | Bearish medium-term for crude | WTI / Brent 🔽 (medium-term) |
| PBoC Gold Purchases | 15th consecutive month of buying in January. Central bank demand structural. | Structural floor for gold; 585 tonnes/quarter demand expected | Gold 🔼 (structural) |
| US Copper Tariffs | Trump reintroducing copper tariff plans; pre-tariff stockpiling accelerating. COMEX inventories elevated. | Near-term bullish; creates artificial demand pull-forward | Copper 🔼 (short-term) |
| BoJ Rate Hike Signals | Carry trade unwind driving USD/JPY to 3-year low. Yen strengthening. | USD weakness = commodity supportive; potential volatility spike | All commodities via USD 🔼 |
| US Weather (Natgas) | Above-normal temperatures forecast across US for March 3–12. EIA draw −52 bcf vs. −168 avg. | Strongly bearish for natural gas demand | Natural Gas 🔽 |
| China NPC / GDP Target | NPC session begins March 2. GDP target expected ~5%. Policy support for metals industry. | Copper, industrial metals, oil demand support | Copper 🔼 · Oil 🔼 · AUD 🔼 |
| Silver Industrial Demand | Solar PV sector + EV + AI hardware driving structural deficit. ETF inflows rebounding. | Structural bull case; supply cannot keep up | Silver 🔼 (structural) |
Frequently Asked Questions
Conclusion — Today’s Market in Perspective
February 27, 2026 is shaping up as a day that crystallizes the dominant commodity market themes of early 2026: precious metals in a historic structural bull market, crude oil caught between geopolitical risk and supply reality, and natural gas pricing in the end of winter.
Gold at $5,180 remains one of the most compelling structural longs in the commodity complex — not because of speculation, but because the combination of dollar weakness, central bank demand, and rate-cut expectations creates a fundamental floor well above $5,000. Silver’s 25% YTD gain is equally legitimate in its structural drivers, though the volatility profile demands respect. The $84–$87 dip-buy remains the preferred trade setup before the next leg toward $96.
Crude oil’s situation is arguably the most nuanced: within the ascending channel it’s a buy above $65; at the macro level, OPEC+ supply increases and a potential Iran deal could reset the medium-term narrative toward $55–$60. Natural gas is the contrarian play to watch — the falling wedge pattern is technically valid, but fundamentals won’t support a meaningful recovery until either cold weather returns or summer LNG demand materially tightens supply.
For experienced active traders, the key discipline over the next 24–72 hours is managing position size around next week’s US economic data calendar. Tokyo CPI today, ISM PMI on March 2, and NFP on March 6 are all capable of generating outsized moves in both directions. Precious metals remain the highest-conviction longs; crude oil is a range-trade; natural gas is a patient contrarian watch.