Commodity Market Analysis — March 2, 2026 | Gold · Oil · Copper · Natural Gas
Commodity Market Analysis
Monday, March 2, 2026 — Asia/London Open Edition
Live Market Snapshot — Monday Open
As trading desks open across Asia and London, commodity markets are navigating the sharpest geopolitical shock in years. The US-Israel military campaign against Iran — dubbed “Operation Epic Fury” — killed Supreme Leader Ali Khamenei over the weekend, and the resulting disruption to Strait of Hormuz shipping has sent energy markets into freefall mode. Everything else is secondary today.
Top Market-Moving News — Last 10 Hours
Here’s the intelligence briefing that’s actually moving prices today. These are not background stories — each of these has direct trade implications in the next 24 hours.
| Story | Commodity Impact | Severity | Source |
|---|---|---|---|
| 🔴 US & Israel strike Iran — Khamenei killed; Operation Epic Fury underway | Brent +9–13%. WTI +8–9%. LNG +sympathy. Gold +safe-haven bid. | Extreme | Bloomberg, CNBC, CNN, NPR — 0–10 hrs |
| 🔴 Strait of Hormuz tanker traffic halts — Lloyd’s of London cancels war risk coverage | ~20M bbl/day flow at risk. GS targets $110. JP Morgan $120–$130. | Extreme | Fortune, Reuters, Oilprice.com — 2–10 hrs |
| 🟠 OPEC+ increases output by 206K bbl/day for April — meeting pre-planned | Partially offsets Iran disruption; only ~3M bbl/day bypass capacity via pipelines | High | NPR, Reuters — 9 hrs |
| 🟠 US PPI data surprised to the upside: headline +0.5% m/m, core +0.8% m/m | Reinforces “sticky inflation” narrative. Delays Fed rate cuts. Supports Gold structural bid. | High | Grain Central — 6 hrs |
| 🟠 Manufacturing PMIs due today from China, Japan, UK, Eurozone, US — “PMI Monday” | Services follow Wednesday. Data divergence thesis (US slowdown vs Asia/Europe) confirmed = weaker USD = bullish metals. | High | Investing.com, CSFX — 2 days ago |
| 🟡 AUD/USD drops below 0.7020 — flight to USD safety on Iran escalation | Supportive for USD-denominated commodities that are inversely correlated with AUD | Medium | Grain Central — 6 hrs |
| 🟡 Drone strike on Russian nitrogen fertilizer plant — bullish fertilizer sentiment | Natural gas feedstock disruption concern ahead of NH spring application season | Medium | Grain Central — 6 hrs |
| 🟡 Palm oil output in Sabah (Malaysia) expected to fall due to flooding | Vegetable oil market tightening. Canola futures at multi-month highs. | Medium | Grain Central — 6 hrs |
| 🟡 Chicago wheat +19.50, Kansas wheat +21.25, May Chicago up 3% to $5.91½ | Short-covering + funds reducing speculative short base. Dryness/wildfire risks in US Midwest | Medium | Grain Central — 6 hrs |
High-Impact Economic Calendar — March 2, 2026
These are the scheduled data releases and events from the US, UK, Japan, Australia, Europe, and China that carry the highest market-moving potential today and through the week. The Iran crisis has elevated ALL commodity-linked events.
| Time (UTC) | Country | Event | Forecast | Previous | Impact | Commodity Angle |
|---|---|---|---|---|---|---|
| 00:30 | 🇯🇵 Japan | S&P Global Manufacturing PMI (Feb Final) | — | In contraction | High | JPY strength / copper demand signal |
| 01:45 | 🇨🇳 China | Caixin Manufacturing PMI (Feb) | ~50.5 | 50.1 | High | Copper, iron ore, crude demand signal |
| 07:55 | 🇩🇪 Germany | HCOB Manufacturing PMI (Feb Final) | ~46.6 | 45.0 | Medium | EUR/USD — industrial metals indirect |
| 08:00 | 🇪🇺 Eurozone | S&P Global Manufacturing PMI (Feb Final) | ~47.3 | 46.6 | High | Energy demand, EUR FX, gold inverse |
| 09:30 | 🇬🇧 UK | S&P Global Manufacturing PMI (Feb Final) | ~47.0 | 48.3 | Medium | GBP/USD move; industrial metals indirect |
| 14:45 ET | 🇺🇸 USA | S&P Global US Manufacturing PMI (Feb Final) | 51.2 | 52.4 | High | USD direction → ALL commodities |
| 15:00 ET | 🇺🇸 USA | ISM Manufacturing PMI (Feb) | ~52.5 | 52.6 | High | Key USD driver. Sub-indices: New Orders & Prices Paid most critical. A miss = Gold ↑, Oil ↑ (weaker USD) |
| 15:00 ET | 🇺🇸 USA | ISM Manufacturing New Orders (Feb) | ~55 | 57.1 | High | Leading demand indicator — copper & energy sensitive |
| TBC | 🇦🇺 Australia | S&P Global Australia Manufacturing PMI (Feb Final) | — | Released Mar 1 | Medium | AUD; iron ore, coal, LNG demand proxy |
| All Day | 🌍 Multi | Iran Crisis — Hormuz Shipping Status Updates | Binary | Closed Mar 1–2 | Extreme | $15–20/bbl move possible on any single headline. Monitor continuously. |
“The week of March 2–6, 2026 is a genuinely high-stakes trading week — not because of a single event, but because of the intersection of multiple independent catalysts that could each move markets significantly in isolation. The Iran situation has turned ‘high stakes’ into a potential regime-level shift in commodity pricing.”
— Capital Street FX Research, Weekly Intelligence Report
Deep Technical Analysis — 4 Major Commodities
The following analysis covers Gold (XAU/USD), WTI Crude Oil (CL1), Copper (HG1), and Natural Gas (NG1). Each commodity card includes trend structure, key levels, candlestick patterns, momentum indicators, and a fully defined trade setup. All entries, stops, and targets are for informational purposes only — see risk disclaimer.
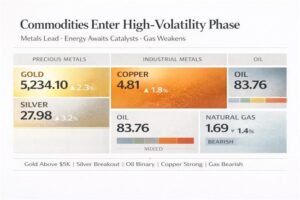
Market Context: Gold is firing on every cylinder. The Iran-Hormuz crisis adds a fresh layer of safe-haven demand on top of an already-bullish structural setup. Central bank purchases (863 tonnes in 2025), DXY weakness (97.85 and falling), sticky US inflation, and falling real yields are all lining up. The February 2 low at $4,402 marked a correction bottom, and price has reclaimed $5,207+ — a 61.8% Fibonacci retracement of the January ATH-to-low waterfall. The 12 out of 12 moving averages (MA5 to MA200) are on a Buy signal as of this morning.
Gold is in a primary uptrend — printing higher highs and higher lows on the daily timeframe. The symmetric triangle breakout noted on the 4H chart (from the TradingView community) has price targeting $5,300+. The minor ascending channel (lower boundary $5,046, upper boundary $5,448) remains intact. The corrective rebound from the Feb 2 low has now crossed the 61.8% Fibonacci level, suggesting the next leg could target the prior ATH at $5,595. Trend bias: Bullish above $5,046
Hammer (Feb 10–12): Formed near $5,107–$5,153, signaling bullish reversal from the correction. Confirmed with a Bullish Engulfing pattern on the weekly chart, reinforcing buying pressure. A Doji near $5,153 followed — market paused before resuming upward. On the current 4H chart, price is compressing in a tight range (often a pre-breakout structure) just below the symmetric triangle apex, with the breakout target around $5,300+. Watch for a closing engulfing candle above $5,320 as the confirmation trigger.
Rationale: Buy pullbacks into the $5,150–$5,200 demand zone (Fibonacci confluence + 50% retracement). A close below $5,046 (20-DMA pivotal support) negates the near-term bullish structure and exposes $4,960. Overbought RSI at 75.4 makes chasing the breakout risky — wait for a retest. Iran safe-haven flow provides a new fundamental floor. Do NOT short gold today.
Market Context: This is a once-in-a-cycle event for crude traders. WTI ended Friday at ~$65.21, then gapped up to $72+ at Sunday’s open (+8%), and is now trading around $73.10 in Monday’s Asian session — a 2026 high. Brent hit $82.37 intraday before settling near $79–80. The Iran-Hormuz disruption has completely overridden all pre-existing technical structures. A 20% of global oil supply is now at risk. Goldman Sachs targets $110/bbl. JP Morgan sees $120–$130 if disruptions persist. Investing.com’s technical indicators have flipped to Strong Buy on crude today (open: $74.74).
The pre-existing technical range ($65–$67.20) has been completely invalidated by the geopolitical gap-up. WTI has now printed what TradingView traders are calling a Break of Structure (BOS) — confirming a shift from the descending channel that had been in place since early 2025. Prices are now in price-discovery territory between $70–$82. The descending channel’s upper boundary (previously capping all rallies at lower highs) has been decisively broken. This is a structural regime change, not a temporary spike — unless the Iran conflict resolves within days.
Massive Gap-Up (Sunday–Monday open): A gap-up of 8–13% is the highest-conviction bullish pattern in technical analysis when supported by fundamental drivers of this magnitude. The prior week’s candle ended with a strong bullish close (+2.78%) on Friday, followed by the gap — a classic Bullish Continuation Gap. On the 4H, expect high-volatility Doji/spinning top candles as buyers and sellers negotiate the new range. Any pullback that forms a hammer or bullish engulfing near $70–$71.50 is a reentry signal.
Critical Warning: Reduce position size by at least 50% vs normal. Gap moves can reverse violently — if Iran nuclear talks resume or a ceasefire is announced, Brent can fall $15–20 in minutes. Use options hedging if your broker allows. Do NOT enter at the Monday open; wait for an intraday pullback and a bullish 4H candle confirmation. The $70 zone (gap fill) is the ideal entry. Short entries require a confirmed 4H close below $67 — do not short into geopolitical premium.
Market Context: Copper is arguably the most structurally bullish commodity in 2026, independent of the Iran crisis. A projected 1-million-metric-ton supply deficit is building as AI data centers and EV infrastructure demand accelerates. LME copper hit $13,238/ton in January 2026 — a historical LME high. JP Morgan and Citigroup maintain market consensus of $11,000–$14,000/ton, with bullish scenarios above. Investing.com’s daily signal is Strong Buy with today’s open at $6.03/lb. This is the “pick and shovel” trade for AI infrastructure, and the Iran crisis indirectly supports it by reinforcing USD weakness (DXY below 98.68).
Copper is printing a classic long-term uptrend with higher highs and higher lows since early 2025. The monthly chart shows prices hugging the upper Bollinger Band — a signal of trend expansion, not mean reversion. The structural demand driver is AI: data centers require up to 10x the copper of traditional facilities. Supply cannot keep up — global mine output and scrap recovery cannot match the pace of electrification demand. China’s recovery (Feb PMI: ~50.5 expected today) is the key short-term trigger. Any reading above 50 will confirm demand-side support. Bias: Strongly Bullish — structural
Upper Bollinger Band Ride: When price consistently walks the upper BB with only minor pullbacks, this indicates a strong trend phase — NOT overbought reversals. This pattern has persisted for copper since Q3 2025. On the 4H chart, look for Bullish Flag formations — consolidation triangles after impulsive moves up — as optimal entries. Any red candle that closes above the midpoint of the prior bullish candle is a continuation signal. Watch today’s China Caixin PMI (01:45 UTC) as a potential catalyst for the next impulsive leg.
Rationale: Today’s China Caixin PMI (01:45 UTC) is the primary short-term catalyst. A reading above 50.5 validates the demand thesis and could push copper above $6.10 today. Entry on any pullback toward the $5.85–$5.95 demand zone (prior resistance-turned-support) with a bullish 4H confirmation candle. The structural deficit is not going away — this is a strong buy the dip market. Iran conflict indirectly supports copper via USD weakness and safe-haven metal flows.
Market Context: Natural gas sits in a contrarian position today. The technical structure is decisively bearish — price broke and confirmed below the $3.00 key support level last week, and Investing.com’s daily signal is Strong Sell. However, the Iran conflict introduces a geopolitical wildcard: Hormuz disruption affects LNG shipping routes, and a drone strike on a Russian fertilizer plant (a major nitrogen gas consumer) adds bullish pressure. Today’s open is $2.83. The tension between the bearish technical structure and bullish geopolitical flows makes this the most nuanced commodity to trade today.
Natural gas confirmed a bearish breakdown below the critical $3.00 psychological support in the last week of February. Multiple daily closes below this level activated bearish targets. The descending channel structure (price making lower highs and lower lows) has been intact since the late-January highs. Warmer-than-normal weather forecasts and larger-than-expected inventory builds had been the fundamental driver before the Iran escalation. The US natural gas storage surplus remains a structural headwind. Bias: Bearish — unless $3.00 is reclaimed on a daily close
Confirmed Support-Break candle (Feb 26–27): Price broke $3.00 with multiple bearish close candles — the textbook “support-becomes-resistance” setup. Any intraday pop back to $2.90–$3.00 is a potential short entry — look for a Bearish Engulfing or Shooting Star at that zone to confirm rejection. However, the Iran LNG wildcard means you should watch for an abnormal gap-up above $3.00 — if that occurs with a strong daily close, it invalidates the bearish thesis entirely and requires a long pivot. Geopolitical candles override all prior patterns.
Rationale: The technical structure favors short entries on retests of the broken $3.00 level. The fundamental supply surplus and warming weather support the bearish thesis. However, monitor LNG shipping news from the Hormuz region — any confirmed route disruption affecting LNG exports could spike gas +15–20% in a single session. Keep position size small. An alternative long setup triggers if price breaks and holds above $3.00 on a daily close, targeting $3.45.
The Week’s Macro Narrative — What Experienced Traders Need to Know
The week’s strategic picture is clearer than usual, even if the tactical picture is wildly unpredictable. The structural backdrop — DXY weakness, metal supply deficits, Fed on hold, global PMI divergence — favors commodities broadly. The Iran shock adds a violent near-term impulse that could either last days (diplomatic resolution) or weeks (prolonged conflict). Experienced traders should be thinking in two modes simultaneously: the geopolitical volatility trade (oil, LNG) and the structural macro trade (gold, copper). These require very different position sizing and risk management approaches.
Frequently Asked Questions
Conclusion — Monday, March 2 Intelligence Summary
The Playbook for Today
Monday, March 2, 2026, is the kind of trading day that separates prepared traders from reactive ones. The Strait of Hormuz crisis is the headline story, but the structural commodity bull market — led by gold and copper — was already firmly in place before the first missiles flew over Tehran. Today’s session requires both tactical awareness (the geopolitical premium in oil could evaporate as fast as it was added) and strategic conviction (the underlying commodity bull case built on DXY weakness, supply deficits, and central bank demand is unchanged).
Gold: The safest and cleanest long bias in the commodity complex. Buy dips toward $5,150–$5,200. Target the ATH at $5,595. Keep positions sized appropriately given RSI is in overbought territory.
WTI Crude Oil: The most volatile and highest-potential trade, but also the most dangerous. Reduce position size, use options if available, and never enter without a defined stop. Wait for an intraday pullback toward $70–$71.50 rather than chasing the gap open. Upside targets of $80–$90+ are realistic if the Hormuz closure extends beyond a week. A diplomatic breakthrough makes $65 support the next test.
Copper: The cleanest structural long in the commodity space. The 1-million-ton deficit story is not going away. Wait for China’s Caixin PMI (today) as a catalyst confirmation. Buy $5.85–$5.95 with a stop at $5.70.
Natural Gas: Technically bearish, but geopolitically binary. Short cautiously at $2.90–$3.00 resistance, with an immediate pivot plan if price closes above $3.00 on the day.
The week’s defining events are: PMI sweep today, Iran conflict newsflow continuously, and NFP on Friday. Position sizing should reflect the elevated uncertainty. The underlying commodity cycle is bullish — but this week, risk management is not optional.
NEXT UPDATE: Tuesday, March 3 — Services PMI + Iran overnight developments | COVERAGE: March 2–6, 2026