Crypto Market Analysis – March 16, 2026 | BTC, ETH, XRP, SOL Daily Intelligence Report
Crypto Market Analysis
March 16, 2026
Comprehensive daily intelligence for active traders — covering BTC, ETH, XRP & SOL with technical setups, macro calendar, and FOMC-eve trade ideas for the next 24 hours.

- 01 · Executive Summary02
- 02 · Market News & Catalysts03
- 03 · Macro & Economic Calendar04
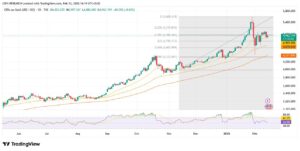
- 04 · BTC/USDT Technical Analysis05
- 05 · ETH/USDT Technical Analysis07
- 06 · XRP/USDT Technical Analysis09
- 07 · SOL/USDT Technical Analysis11
- 08 · Market Sentiment Dashboard13
- 09 · Frequently Asked Questions14
- 10 · Conclusion & Outlook15
Executive Summary
Monday, March 16, 2026 opens with the crypto market in a curious state of tension: prices are rising, yet the Fear & Greed Index sits stubbornly at 15 — marking the 39th consecutive session in Extreme Fear territory. This divergence tells a powerful story. Sentiment has not caught up with price action. The “smart money” has been quietly accumulating throughout this fear cycle, and the current bounce — BTC reclaiming the $72K handle, SOL surging nearly 5%, and ETH breaking above the $2,100 level — suggests that the worst may be behind us.
The dominant macro force this week is the FOMC meeting (March 17–18). The Fed is expected to hold rates at 3.5–3.75%, but traders will dissect every word of Powell’s press conference for clues on the rate trajectory given persistent geopolitical pressures from the Hormuz Strait and elevated oil prices. Crypto has decoupled positively from equities this month — while the S&P 500 dropped 0.61% on the day, crypto markets added $120B in market cap — a statistically significant divergence that institutional players are watching closely.
Bitcoin’s weekly gain of 4.2% holding above $71K despite the Trump administration’s warnings of potential strikes on Iran’s oil-rich Kharg Island signals that BTC is increasingly being treated as a partial geopolitical hedge alongside gold. Strategy Inc. (formerly MicroStrategy) confirmed purchase of over 17,000 BTC at an average price near $70,946, bringing total holdings to 738,731 BTC — a structural signal that institutional conviction remains intact.
Market News & Catalysts (Last 10 Hours)
| Story | Source | Impact | Bias | Pairs Affected |
|---|---|---|---|---|
| FOMC Day 1 — March 16–17 Meeting Begins Fed holds rates at 3.5–3.75% expected; SEP dot-plot will be closely watched for 2026 cut signals. Decision + presser on March 18 at 2PM ET. |
Federal Reserve / MNI | ★★★ HIGH | Neutral / Volatile | All pairs |
| Bitcoin Holds $71K Despite Iran Kharg Island Strike Warnings Trump administration warned of potential strikes on Iran’s oil infrastructure; BTC outperformed equities — up 4.2% on the week vs S&P -0.61%. |
CoinDesk / Reuters | ★★★ HIGH | Bullish BTC | BTC, ETH |
| Strategy Inc. Purchases 17,000+ BTC Near $70,946 Avg Total holdings now 738,731 BTC. Institutional accumulation at current levels signals strong structural floor around $70K–$71K. |
Bloomberg / CoinDesk | ★★★ HIGH | Bullish BTC | BTC |
| BlackRock Transfers 2,200 BTC ($149M) + 2,417 ETH to Coinbase Large Arkham-tracked transfer; signals continued institutional infrastructure activity and adds buying momentum to both assets. |
Arkham Intelligence / BSCN | ★★ MED | Bullish | BTC, ETH |
| Crypto Market Adds $120B as Stocks Slide: Negative Correlation Emerges Total market cap now $2.59T (+3.1% 24h). BTC/S&P 500 correlation turned -0.43 — first significant decoupling in over 6 months. |
CoinGecko / EGW News | ★★★ HIGH | Bullish Macro | All pairs |
| Bitcoin’s 20 Millionth Coin Mined — Supply Scarcity Enters New Phase BTC’s 20M supply milestone (March 9) marks a structural turning point. Only 1M BTC remains to be mined over the next ~100 years. Scarcity narrative accelerates. |
BingX / Multiple Sources | ★★ MED | Long-term Bullish | BTC |
| XRP ETF Products Draw $1.3B+ in Cumulative Inflows US-listed XRP ETFs continue to attract capital despite price consolidation. Exchange balances down 57% signaling long-term holder accumulation. |
Bloomberg ETF / CoinShares | ★★ MED | Bullish XRP | XRP |
| Tether CIO Richard Heathcote Steps Down Tether confirmed its CIO departure. Stablecoin market remains stable; USDT/USDC combined market cap unchanged. Minimal direct market impact expected. |
Investing.com | ★ LOW | Watch | USDT pairs |
The most consequential theme entering today’s session is the decoupling of crypto from US equities. The S&P 500’s continued slide amid tariff uncertainty and Iran war risk has historically dragged crypto down in tandem. The fact that BTC has added 4.2% while stocks fell is a regime-change signal worth monitoring closely. If this divergence holds through the FOMC decision, it could invite a fresh wave of institutional allocation into crypto as a portfolio hedge — a narrative last seen prominently in Q4 2024.
Economic Calendar — High-Impact Events
| Date & Time (ET) | Country | Event | Previous | Forecast | Impact | Crypto Effect |
|---|---|---|---|---|---|---|
| Mar 16, Day 1 | 🇺🇸USA | FOMC Meeting Begins (Day 1 of 2) | 3.5–3.75% | Hold expected | ★★★ HIGH | Pre-FOMC positioning; caution advised |
| Mar 16, 9:15 AM | 🇺🇸USA | Industrial Production & Capacity Utilization (Feb) | +0.5% MoM | +0.3% MoM | ★★ MED | Weak data = dovish FOMC bias = BTC bullish |
| Mar 16, 1:00 PM | 🇺🇸USA | H.6 Money Stock Measures | M2 growth data | — | ★ LOW | Liquidity signal; indirect BTC impact |
| Mar 17 (early AM) | 🇯🇵Japan | Bank of Japan Policy Rate Decision | 0.5% | Hold 0.5% | ★★★ HIGH | JPY volatility → risk-off = potential BTC dip |
| Mar 17 (early AM) | 🇯🇵Japan | Japan CPI (Feb YoY) | 3.2% | 3.0% | ★★ MED | High inflation → JPY weakness → crypto neutral |
| Mar 17 | 🇬🇧UK | UK CPI & Core CPI (Feb) | 2.8% / 3.6% | 2.9% / 3.5% | ★★★ HIGH | Above-est = GBP rise, USD weak = crypto tailwind |
| Mar 17 | 🇬🇧UK | UK Labour Market / Unemployment Rate | 4.4% | 4.4% | ★★ MED | Stable labor = BoE hold = neutral for crypto |
| Mar 17 | 🇦🇺Australia | RBA Meeting Minutes | Rate held 4.1% | Dovish tilt expected | ★★ MED | AUD weakness on dovish = risk-on sentiment boost |
| Mar 17 | 🇨🇳China | Industrial Output, Retail Sales & Fixed Investment (Feb) | IP +5.4% / RS +3.7% | IP +5.5% / RS +4.0% | ★★★ HIGH | Better-than-est = global risk-on = altcoin rally fuel |
| Mar 18 | 🇪🇺EU/ECB | ECB Meeting Accounts (February Meeting) | Rate at 2.5% | — | ★★ MED | Euro rate path signals liquidity outlook |
| Mar 18, 2:00 PM | 🇺🇸USA | FOMC Rate Decision + SEP Dot Plot | 3.5–3.75% | Hold; 1–2 cuts in 2026 dot-plot | ★★★ CRITICAL | Dovish = BTC +5–8%; Hawkish surprise = BTC −5% |
| Mar 18, 2:30 PM | 🇺🇸USA | Powell Press Conference | — | Tone monitored for cut timeline | ★★★ CRITICAL | Each word moves BTC ±$1K–$3K in real-time |
The most nuanced macro variable is the oil shock equation. With WTI crude hovering around $95–$110/bbl driven by Hormuz crisis tensions, the Federal Reserve faces a classic stagflation dilemma — high energy-driven inflation while growth slows. Markets currently price in a hold with mild dovish language. If Powell signals fewer cuts than the market expects (current pricing: 1–2 cuts in 2026), crypto will face a sharp sell-off. A dovish surprise — acknowledging the need for eventual easing — could unlock the $74K–$80K range for BTC.
BTC/USDT — Technical Analysis & Trade Setup

ETH/USDT — Technical Analysis & Trade Setup
XRP/USDT — Technical Analysis & Trade Setup

SOL/USDT — Technical Analysis & Trade Setup

Market Sentiment & On-Chain Dashboard
Fear & Greed Index: Extreme Fear (15/100) — March 15, 2026
This marks the 38th consecutive day in the Extreme Fear zone, the longest sustained run since the post-FTX collapse in late 2022. Historically, when this index stays below 20 for 30+ days, the forward 30-day Bitcoin return has been positive in ~80% of historical instances. This is a contrarian accumulation signal — but patience is required through FOMC.
| Metric | BTC | ETH | XRP | SOL | Reading |
|---|---|---|---|---|---|
| 24h Change | +1.95% | +3.81% | +2.89% | +4.75% | Broad Rally |
| 7-Day Performance | +4.2% | ~+5% | ~+3% | ~+8% | Recovering |
| Funding Rate | +0.004% | -0.0076% | — | — | Mixed / Low leverage |
| ETF Flows (7d) | +11,213 BTC | +$38.7M | +$1.3B cumul. | +$43.6M | Positive |
| BTC Dominance | 58.78% (Rising — Bitcoin Season confirmed) | BTC Season | |||
| Total Market Cap | $2.59 Trillion (+3.1% in 24h, +$120B) | Expanding | |||
| 24h Volume | $91.2 Billion (CoinGecko) | Moderate | |||
| BTC Exchange Balances | Declining — long-term holders absorbing supply | Bullish Supply | |||
| Signal Type | Current Reading | Historical Context | Implication |
|---|---|---|---|
| Fear & Greed | 15 — Extreme Fear | 38 days below 20 (longest since FTX) | Contrarian buy zone |
| BTC vs S&P Correlation | -0.43 (negative) | Rare decoupling event | Hedge demand rising |
| Corporate BTC Buying | Strategy: 738,731 BTC total | Largest ever corporate holder | Supply floor established |
| BTC Spot ETF Inflows | Counter-trend buying during dip | Long-only mandates deploying | Structural accumulation |
| Oil / Geopolitical Risk | WTI ~$95–$110/bbl | Hormuz crisis driving energy risk | Stagflation tail risk |
Frequently Asked Questions
Conclusion & 24-Hour Outlook
The Accumulation-Before-Ignition Setup
March 16, 2026 presents active crypto traders with a rare and nuanced setup: technically improving price action wrapped inside deeply fearful sentiment. The Fear & Greed Index at 15 is not a warning signal — at this stage in the cycle, it’s a feature, not a bug. Smart money has been buying for 38 consecutive “fear” days while weak hands have been selling. The result is a market where exchange balances are falling, ETF inflows are counter-trend buying, and institutional names like Strategy Inc. are publishing 738,000+ BTC purchase records near current levels.
The FOMC meeting is the decisive catalyst. Everything in the next 24–48 hours pivots around whether the Federal Reserve provides enough dovish cover to let crypto bulls run. Our base case: hold at 3.5–3.75% with one or two 2026 cut projections in the dot plot. This would be mildly bullish for BTC and likely to confirm the $74,000 breakout attempt within 48 hours of the decision.
Among the four pairs, SOL/USDT has the most compelling technical setup — a textbook rounding bottom, ascending triangle breakout, and the highest institutional inflow conviction of the group. BTC/USDT remains the anchor trade for those who want exposure with lower risk. ETH/USDT offers asymmetric short-squeeze potential if the $2,150 level holds. XRP/USDT is a patience trade — accumulate range bottom, wait for the confirmed daily close above $1.46 before sizing up.
The narrative is clear: crypto is finding its floor after a brutal Q1. The 20 millionth Bitcoin mined, institutional ETF buying, growing corporate treasury adoption, and a negative correlation with equities during geopolitical stress all point toward a structural shift in how this asset class is perceived. The traders who position correctly in the next 7–14 days — with defined risk and FOMC-aware sizing — may look back at this period as one of the better risk/reward windows of the year.
Next report: Tuesday, March 17, 2026 — covering post-Day 1 FOMC positioning, Japan rate decision impact, UK CPI release, and updated technical levels across all four pairs.
| Pair | Price | 24h | Trend | Entry Zone | Target 1 | Target 2 | Stop Loss | R:R | Bias |
|---|---|---|---|---|---|---|---|---|---|
| BTC/USDT | $72,597 | +1.95% | Bullish | $71,000–72,000 | $74,000 | $80,000 | $69,200 | 1:2.8 | Cautious Long |
| ETH/USDT | $2,175 | +3.81% | Recovery | $2,050–2,100 | $2,200 | $2,400 | $1,980 | 1:2.1 | Spec Long |
| XRP/USDT | $1.45 | +2.89% | Sideways | $1.38–1.42 | $1.46 | $1.55 | $1.30 | 1:1.5/3.0 | Range Trade |
| SOL/USDT | $92.03 | +4.75% | Strong Bull | $88–90 | $99 | $110 | $82.50 | 1:3.0 ★ | High Conv. Long |