CSFX Weekly Commodity Market Report | March 21, 2026 | Gold · Silver · Crude Oil · Natural Gas
Weekly Commodity Market Report
Weekly Market Overview — Macro Intelligence
Week Ending March 21, 2026The Recalibration: When Safe-Haven Meets a Hawkish Fed
The week ending March 21, 2026 will be remembered as the moment commodity markets recalibrated after the euphoric Hormuz Shock spike. Gold — which had surged past $5,100 in early February on safe-haven demand driven by the Iran-related closure of the Strait of Hormuz — posted its worst weekly performance since 2020, losing over 6.5% to close near $4,690.
The trigger: the U.S. Federal Reserve’s March FOMC decision to hold rates steady at 3.50–3.75% with the dot plot projecting only one rate cut in all of 2026. The dollar index (DXY) surged to a 10-month high above 100.40, squeezing non-yielding assets mercilessly.
Silver’s collapse was even more dramatic — down 10.4% on the week and nearly 21% from its March highs — as industrial demand fears met a surging dollar. WTI crude, which had been trading near $100 on geopolitical premium, retreated to $94.57 as IEA emergency reserves released 400 million barrels. Natural Gas remained the quiet outlier — supported by a structurally elevated U.S. Henry Hub price environment averaging $3.80/MMBtu for 2026 per EIA forecasts.
Economic Calendar — Week of March 23–28, 2026
High-Impact Events · Commodity RelevanceThe coming week carries critical macro releases that will directly influence commodity positioning. The most significant are U.S. Flash Manufacturing and Services PMI on Monday — given gold’s sensitivity to growth signals — alongside UK CPI (Tuesday), Germany’s Ifo Business Climate, and the U.S. Consumer Sentiment index (Friday). With the Fed anchored on hold, any surprise in PMI data or consumer sentiment could reignite or suppress dollar strength, directly impacting gold and silver.
| Date | Region | Event | Impact | Forecast | Commodity Implication |
|---|---|---|---|---|---|
| Mon 23 Mar | 🇪🇺 Euro Area | Flash Manufacturing PMI (Mar) | HIGH | ~48.2 (Prev: 47.6) | Weak EU PMI = USD strength = Gold/Silver pressure |
| Mon 23 Mar | 🇺🇸 USA | S&P Global Flash Manufacturing PMI | HIGH | ~52.1 (Prev: 52.7) | Most critical: soft miss → dollar softens → Gold bullish |
| Mon 23 Mar | 🇩🇪 Germany | Ifo Business Climate (Mar) | MED | ~86.8 (Prev: 86.2) | EUR proxy — impacts gold indirectly via DXY |
| Tue 24 Mar | 🇬🇧 UK | Consumer Price Index YoY (Feb) | HIGH | 2.9% (Prev: 3.0%) | Sterling inflation = BoE hawkishness = GBP/USD impact on gold crosses |
| Tue 24 Mar | 🇺🇸 USA | CB Consumer Confidence (Mar) | MED | ~96.5 (Prev: 98.3) | Weak confidence = risk-off = safe-haven gold demand |
| Wed 25 Mar | 🇺🇸 USA | Durable Goods Orders MoM (Feb) | HIGH | −0.9% (Prev: 3.1%) | Weak capex = dollar softness = gold supportive |
| Wed 25 Mar | 🇨🇳 China | Industrial Profits YoY (Jan–Feb) | MED | ~4.2% (Prev: 5.9%) | China demand proxy — critical for silver’s industrial use case |
| Wed 25 Mar | 🇺🇸 USA | EIA Crude Oil Inventories | HIGH | ~−0.5M (Prev: −1.448M) | Build = WTI bearish toward $87; draw = validates bounce to $97.50 |
| Thu 26 Mar | 🇺🇸 USA | Initial Jobless Claims | HIGH | ~220K (Prev: 223K) | Rising claims = growth fears = mixed for gold/silver |
| Thu 26 Mar | 🇺🇸 USA | EIA Natural Gas Storage | HIGH | — | Build = NG bearish; draw = supports $3.033 floor |
| Fri 27 Mar | 🇺🇸 USA | U. of Michigan Consumer Sentiment | HIGH | ~64.0 (Prev: 64.7) | Soft = risk-off; deterioration + Hormuz = gold safe-haven demand |
| Fri 27 Mar | 🇺🇸 USA | PCE Price Index MoM (Feb) | MED | ~0.3% (Prev: 0.3%) | Hot print = more dollar strength = gold headwind |
| All Week | 🌐 Global | Middle East / Hormuz War Updates | CRITICAL | No schedule | Oil & gas supply disruption monitoring — overrides all scheduled data |
| All Week | 🇺🇸 USA | Fed Speaker Watch — FOMC Members | HIGH | — | Any dovish pivot signal = Gold bullish catalyst |
| All Week | 🌐 OPEC+ | IEA Emergency Reserve Release Updates | MED | 400mb release cap | Impact on WTI geopolitical premium — cap enforcement |
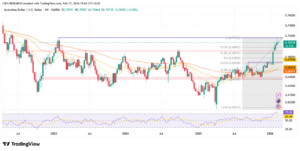
Au — Gold (XAU/USD)
COMEX Futures · Weekly Chart · Corrective BearishGold’s weekly candle (Open: $5,004.60 → Close: $4,690.15) forms a textbook bearish engulfing, with the wide range swallowing the prior week’s body entirely. This is a high-probability reversal signal at resistance. Price printed a new multi-week high at $5,044 before reversing sharply — a “Shooting Star” variant on higher timeframes. The upper wick penetration of $5,044 and close near $4,690 confirms seller dominance at the 0.236 Fib zone.
High volume on the decline (open interest ~160,469 contracts) validates the distribution phase, not just profit-taking by weak hands.
RSI (14, Weekly): ~52 — Cooling. MACD: Bear Cross. DXY Correlation: Inverse (−0.87). 50-Week MA: ~$4,100. Weekly bias: Corrective Bearish.
| Fib Level | Price ($) | Status / Role |
|---|---|---|
| 1.000 (ATH Area) | $5,020+ | Rejected |
| 0.236 | $4,948.84 | Broken Below |
| Current | $4,690.15 | Falling |
| 0.382 — Key Pivot | $4,556.71 | Next Target |
| 0.500 — Major Support | $4,239.77 | Demand Zone |
| 0.618 — Golden Ratio | $3,922.84 | Deep Support |
Fed hawkish hold: 3.50–3.75%, dot plot: only 1 cut in 2026. DXY at 10-month high (100.40+) directly suppresses gold. ETF outflows accelerating as rate cut bets scaled back. J.P. Morgan long-term target: $5,000/oz by Q4 2026 — structural bull case remains intact. Geopolitical paradox: rising bond yields (10Y at 4.21%) overpowers safe-haven bid.
Primary: Short — Corrective Phase
Bullish Reversal Trigger
Ag — Silver (XAG/USD)
Spot Silver · Weekly Chart · Bearish — 0.500 Fib TestSilver’s current candle (O: $80.01 → C: $72.18) after printing a high of $82.52 is an outside week lower — a pattern statistically associated with continuation of the decline into the next 2–3 weeks. Silver collapsed 5.6% on a single session (March 19) — the worst single-day drop since the pandemic. It behaves as both a safe-haven and industrial metal; in a dollar-surge + growth-fear environment, both components are negative simultaneously.
0.382 Fib Breakdown Confirmed: Price decisively closed below $85.27 — a critical pivot. The Gold/Silver Ratio at 66.3 (rising) confirms silver is underperforming gold — a sign of risk-off rotation and industrial demand deterioration fears.
RSI (14, Weekly): ~42 — Declining. Weekly Trend: Sharply Bearish. Industrial demand weakening. $65 floor watch: Multiple analysts cite $65/oz as key technical and psychological floor.
| Fib Level | Price ($) | Status |
|---|---|---|
| 1.000 (ATH Zone) | $121.42 | Rejected |
| 0.236 | $99.09 | ATH Resistance |
| 0.382 — Broken | $85.27 | Broken Below |
| Current | $72.18 | Below 0.500 |
| 0.500 — Testing | $74.10 | Immediate Test |
| 0.618 — Golden Ratio | $62.93 | Next Major Support |
Concerns about slowing Chinese industrial output and global manufacturing PMIs contracting weigh on silver’s 60%+ industrial use base. J.P. Morgan long-term view: Silver target $58/oz for full-year 2026 average. $65 floor: critical technical and psychological level — weekly close below opens 0.618 Fib at $62.93.
Primary: Short — Dead-Cat Bounce Fade
Bullish Reversal Trigger
🛢 WTI Crude Oil (USOil)
NYMEX WTI Futures · Weekly Chart · Pullback in UptrendWTI printed a weekly high of $101.61 — touching but failing to close above $100 — then retreated to close at $94.57. This is a textbook shooting star / supply zone rejection at a major psychological level, compounded by the 0.382 Fib at $94.99 acting as both previous resistance and now wobbling support.
The week’s open at $101.23 vs. close at $94.57 creates a large bear body. The prior 7-week surge from $60.53 to $100+ was driven by the Strait of Hormuz closure (IEA: “largest supply disruption in the history of the global oil market”). The pullback is a natural correction — not a trend reversal — as long as the Strait remains functionally impaired.
RSI (14, Weekly): ~65 — Overbought cooling. IEA Emergency Reserve Release: 400mb active. 52-Wk Range: $54.98–$113.41. Geopolitical premium: ~$25–30/bbl embedded.
| Fib Level | Price ($) | Status |
|---|---|---|
| 1.000 (ATH) | $120.10 | Top |
| 0.236 | $104.58 | Price Below |
| Current | $94.57 | At 0.382 Fib |
| 0.382 — Key | $94.99 | Testing Now |
| 0.500 — Support | $87.23 | Next Support |
| 0.618 — Golden Ratio | $79.48 | Strong Support |
Hormuz closure: IEA — “largest supply disruption ever.” At least 10 mb/d curtailed; IEA 400mb reserve release provides physical cap. EIA Forecast: Brent stays above $95 for next 8 weeks, then below $80 in Q3 2026. U.S. shale: 13.6 mb/d avg 2026. Geo-premium de-escalation scenario: WTI could rapidly return to $65–70 range.
Primary: Sell Bounce Into Supply Zone
Bullish Re-entry / Long-Term
NG — Natural Gas (NG1/NYMEX)
Henry Hub Natural Gas Futures · 1D Chart · Range-Bound / Watch $3.033After the dramatic Jan–Feb 2026 spike that took Natural Gas from $2.764 to $7.105 (2.618 Fib Extension) — the largest weekly spike since the 2022 energy crisis — price has been tracing a bearish impulse wave back toward the base. The current area ($3.095) sits between the critical $3.033 support and $3.155 resistance.
The current day’s candle shows a momentum reversal signal (Lightning Bolt on the CSFX chart). CSFX’s March 19 analysis noted Nat Gas “quietly staged a 3.82% breakout” even as all other commodities fell — this divergence is significant and suggests gas may be finding a structural floor before others.
RSI (14, Daily): 47.32 — Neutral. Stochastic: 46.49 — Neutral. Moving Averages: Below declining MAs — Bearish. Support: $3.033–$3.000. Resistance: $3.464–$3.868.
| Fib Level | Price ($) | Status |
|---|---|---|
| 2.618 (ATH Zone) | $7.105 | Feb 2026 High |
| 1.618 Extension | $5.447 | Extended Bull |
| 1.0 Extension | $4.422 | Bull Case |
| 0.786 | $3.897 | Extension Target |
| 0.500 | $3.393 | Next Resistance |
| 0.336 | $3.155 | Immediate Resist |
| Current | $3.095 | Range |
| Support | $3.033 – $3.000 | Critical Floor |
| 0 (Base) | $2.764 | Bear Target |
Primary: Cautious Long at Support
Bear Case / Key Risks
Frequently Asked Questions — Trader FAQ
Commodities Analysis · March 2026Weekly Conclusion — CSFX Research Desk
Commodities Weekly · Issue #53 · Vol. II · 21 March 2026Decisive Inflection: Geopolitical Bull Meets Macroeconomic Wall
The week of March 21, 2026 marks a decisive inflection point for commodity markets. What began as a geopolitical-shock-driven bull surge across energy and precious metals has run headlong into a reinforced macroeconomic wall — a hawkish Fed, a surging dollar, and rising real yields. The result is a violent correction that, while painful for long-positioned traders, is technically healthy and creates strategic opportunities for disciplined participants.
Gold at $4,690 is in a corrective phase, not a structural reversal. The 0.382 Fib at $4,556 is the next key decision point. Short-term bias is bearish, but the medium-term bull case ($5,000 by Q4 2026 per J.P. Morgan) remains structurally intact.
Silver at $72.18 faces deeper corrective risk — down to the $62–65 zone — before the industrial demand thesis reasserts itself.
WTI Crude at $94.57 is recalibrating from an extreme Hormuz spike; the $87 and $79 Fibonacci levels are the gravitational anchors for the coming weeks, with the conflict’s duration being the supreme variable.
Natural Gas at $3.095 is the quiet outlier — it shows relative strength and, at the $3.033 support, offers the most favorable risk/reward of the group.
Manage positions with strict risk management. Use the economic calendar events — particularly U.S. Flash PMI (Monday) and EIA inventories (Wednesday) — as trigger points, not afterthoughts. Stay informed on Hormuz developments daily.
— CSFX Commodities Research Desk · Issue #53 · Volume II · 21 March 2026 · London/Dubai/Mumbai Edition