Market Overview: Commodity markets are trading with a cautiously supportive tone as investors are balancing escalating Middle East geopolitical risks against key upcoming U.S. economic data. Gold and Silver are consolidating near multi-year highs, WTI Crude Oil is remaining underpinned by US–Iran tensions and Houthi supply disruption fears, while Natural Gas is hovering in a compressed range amid ample production. Traders are closely watching the U.S. Core PCE Price Index and Q4 GDP report — data which are shaping Federal Reserve rate-cut expectations and, in turn, the direction of Dollar-denominated commodities.
Metals
Gold XAU/USD
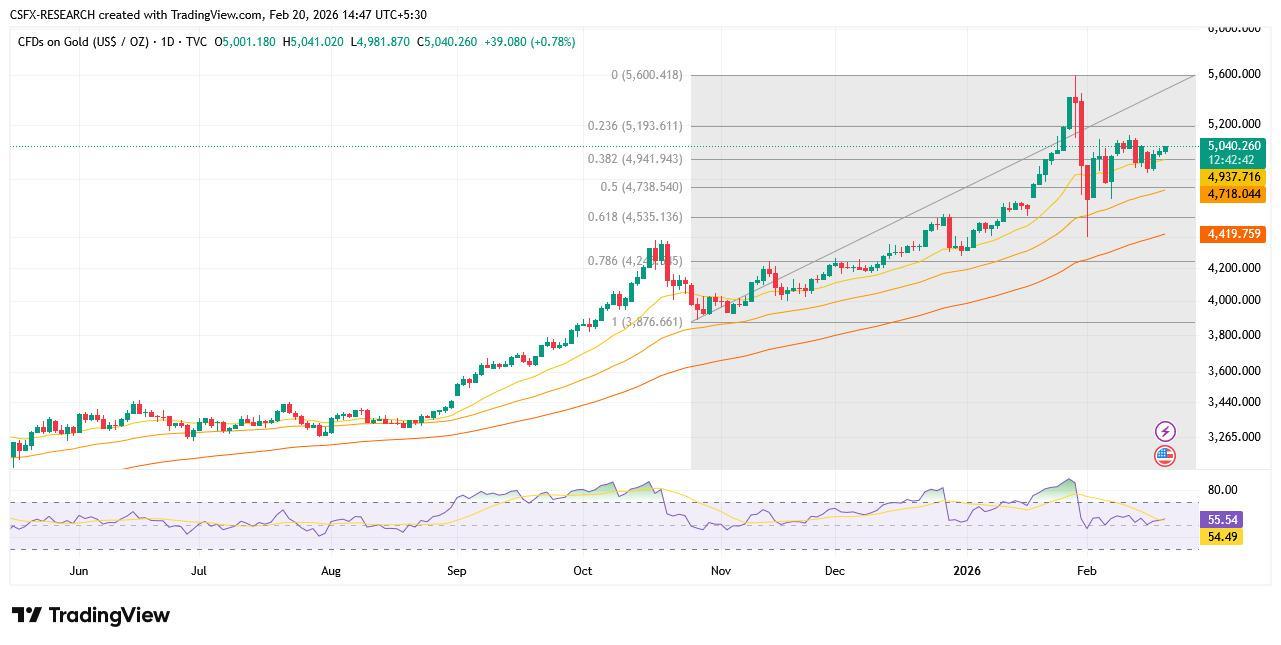
Gold is holding onto its upward momentum above the $5,000 mark — buyers are remaining cautious as attention shifts to U.S. PCE and GDP data.
🇺🇸 Fed Rate Watch
🇮🇷 US–Iran Nuclear Standoff
🇾🇪 Houthi Red Sea Disruptions
🇨🇳 China Central Bank Gold Buying
🇷🇺 Russia–Ukraine Ceasefire Talks
Gold (XAU/USD) is extending its positive tone for a third consecutive session on Friday, though upside momentum is remaining limited amid a mixed fundamental backdrop. Traders are refraining from taking fresh directional positions ahead of the advance Q4 GDP report and the Personal Consumption Expenditures (PCE) Price Index — figures which are expected to shape the Federal Reserve’s rate-cut trajectory and, in turn, the non-yielding precious metal.
Geopolitical tensions are providing a firm layer of safe-haven support. U.S. President Donald Trump is warning Iran to reach a nuclear deal within 10 to 15 days or face serious consequences. Iran is responding by telling UN Secretary-General Antonio Guterres that it does not seek conflict but would treat any military aggression as a trigger to strike hostile bases in the region. Concurrently, Yemen’s Houthi movement is continuing to threaten Red Sea shipping lanes, and Saudi Arabia–Houthi ceasefire negotiations are stalling, keeping oil-linked geopolitical risk elevated. Russia–Ukraine ceasefire talks are also generating mixed signals — with European nations increasing defence budgets — which is further boosting Gold’s appeal as a safe-haven. Meanwhile, China’s People’s Bank of China (PBoC) is continuing its steady monthly Gold accumulation, providing structural demand support from the world’s largest central bank buyer.
Exponential Moving Averages
EMA 104985.77 ▲ Bullish
EMA 204937.18 ▲ Bullish
EMA 504717.80 ▲ Bullish
Simple Moving Averages
SMA 104998.77 ▲ Bullish
SMA 205010.13 ▲ Bullish
SMA 504680.70 ▲ Bullish
Momentum Oscillators
RSI (14)55.57 — Buy Zone
Stochastic64.52 — Neutral
Overall Signal
SentimentBullish ▲
DirectionBUY
| Level | R2 | R1 | S1 | S2 |
|---|
| Price (USD) |
$5,731.18 |
$5,426.94 |
$4,442.03 |
$4,137.79 |
Entry (Limit Buy)$5,053.00
Take Profit$5,334.00
Stop Loss$4,934.00
Direction⬆ BUY
Bullish All EMAs & SMAs are aligned above price — trend is intact.
Metals
Silver XAG/USD
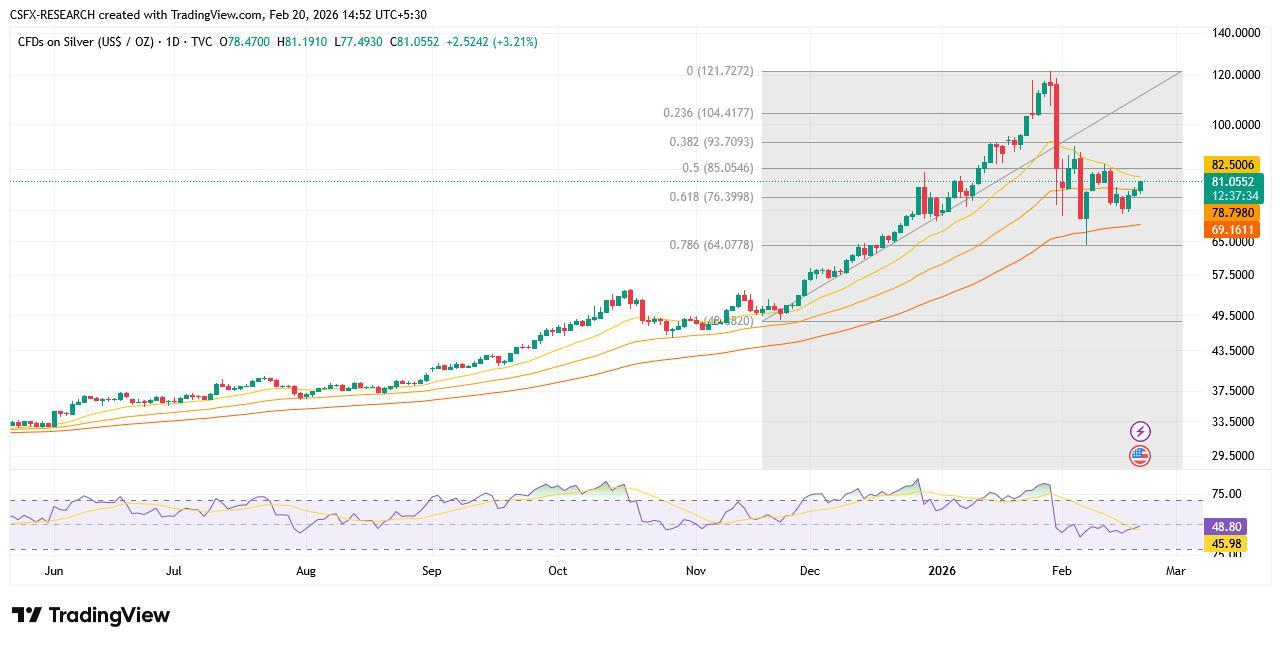
XAG/USD is trading in consolidation below the mid-$78.00 area, with the broader bullish outlook remaining intact.
🏭 Industrial Demand — Solar & EVs
🇺🇸 Fed Rate Expectations
🇨🇳 China Manufacturing PMI
⚡ Green Energy Transition
Silver (XAG/USD) is failing to build on the gains posted over the previous two sessions and is moving within a tight range during Friday’s European trade, hovering around the $78.25–$78.30 area. Unlike Gold, Silver is also carrying significant industrial demand exposure — global solar panel installations are accelerating, electric vehicle production is ramping up, and semiconductor demand is remaining elevated, all of which are underpinning Silver’s medium-term demand outlook even as macroeconomic headwinds temper near-term momentum.
Technically, this week’s breakout above a short-term ascending channel resistance — aligned with the 100-hour Simple Moving Average near $76.32 — is providing an important bullish catalyst. The MACD is remaining slightly below the signal line near the zero threshold. The RSI is standing around 55, reflecting neutral conditions. Sustained trading above the 100-period SMA is continuing to support the breakout framework. On pullbacks, the former descending channel barrier near $75.58 may be providing initial support, with stronger backing around $70.31.
Exponential Moving Averages
EMA 1082.50 ▼ Bearish
EMA 2078.79 ▲ Bullish
EMA 5069.90 ▲ Bullish
Simple Moving Averages
SMA 1087.48 ▼ Bearish
SMA 2080.65 ▲ Bullish
SMA 5065.72 ▲ Bullish
Momentum Oscillators
RSI (14)48.72 — Neutral
Stochastic52.84 — Neutral
Overall Signal
SentimentNeutral ↔
DirectionBUY (Dip)
| Level | R2 | R1 | S1 | S2 |
|---|
| Price (USD) |
$110.75 |
$90.30 |
$72.33 |
$64.14 |
Entry (Limit Buy)$77.90
Take Profit$89.23
Stop Loss$72.62
Direction⬆ BUY
Neutral Mixed MA signals — medium-term trend remains bullish; near-term consolidation is likely.
Energy
WTI Crude Oil XTI/USD
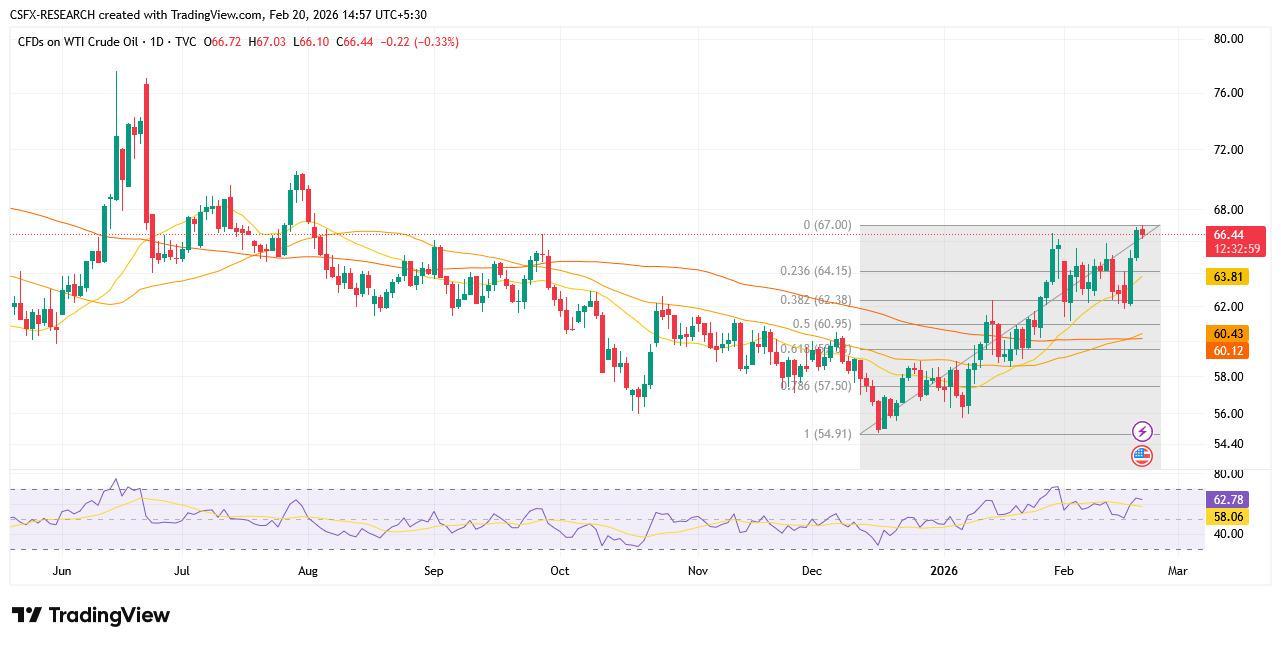
WTI is holding above the mid-$66.00 level, hovering near a six-month high as escalating US–Iran tensions are supporting prices.
🇮🇷 US–Iran Nuclear Ultimatum
🚢 Houthi Red Sea Attacks
🇸🇦 OPEC+ Production Policy
🇷🇺 Russia–Ukraine War (Sanctions)
📦 U.S. EIA Inventory Data
West Texas Intermediate (WTI) crude prices are recovering from a modest dip below $66.00 during the European session and are rebounding toward their highest level since August 4, reached earlier on Friday. The benchmark is on course for weekly gains of more than 5% and is remaining supported by escalating US–Iran tensions that are heightening concerns over potential supply disruptions in the Middle East.
On the geopolitical front, U.S. President Donald Trump is warning Iran to reach a nuclear agreement within 10–15 days or face severe consequences. Iran is responding by telling UN Secretary-General Antonio Guterres it would not tolerate military aggression, with hostile regional assets becoming legitimate targets if attacked. Simultaneously, Yemen’s Houthi movement is continuing to attack commercial vessels in the Red Sea, with recent strikes forcing additional shipping rerouting around the Cape of Good Hope — adding days to transit times and pressuring Brent-WTI spreads. OPEC+ is maintaining its current voluntary output cuts through mid-2026, and Russian seaborne crude exports are facing renewed Western scrutiny following fresh EU sanction discussions targeting the “shadow fleet.” These supply-side dynamics are reinforcing the bullish case even as demand concerns linger amid softer Chinese manufacturing PMI data.
Exponential Moving Averages
EMA 10$64.59 ▲ Bullish
EMA 20$63.63 ▲ Bullish
EMA 50$61.85 ▲ Bullish
Simple Moving Averages
SMA 10$64.34 ▲ Bullish
SMA 20$63.94 ▲ Bullish
SMA 50$60.56 ▲ Bullish
Momentum Oscillators
RSI (14)61.95 — Buy Zone
Stochastic88.83 — Overbought
Overall Signal
SentimentBullish ▲
DirectionBUY
| Level | R2 | R1 | S1 | S2 |
|---|
| Price (USD) |
$69.27 |
$66.74 |
$58.56 |
$56.03 |
Entry (Limit Buy)$64.93
Take Profit$69.60
Stop Loss$62.62
Direction⬆ BUY
Bullish Full EMA/SMA alignment bullish — 200-day SMA at $62.24 is acting as a key floor.
Energy
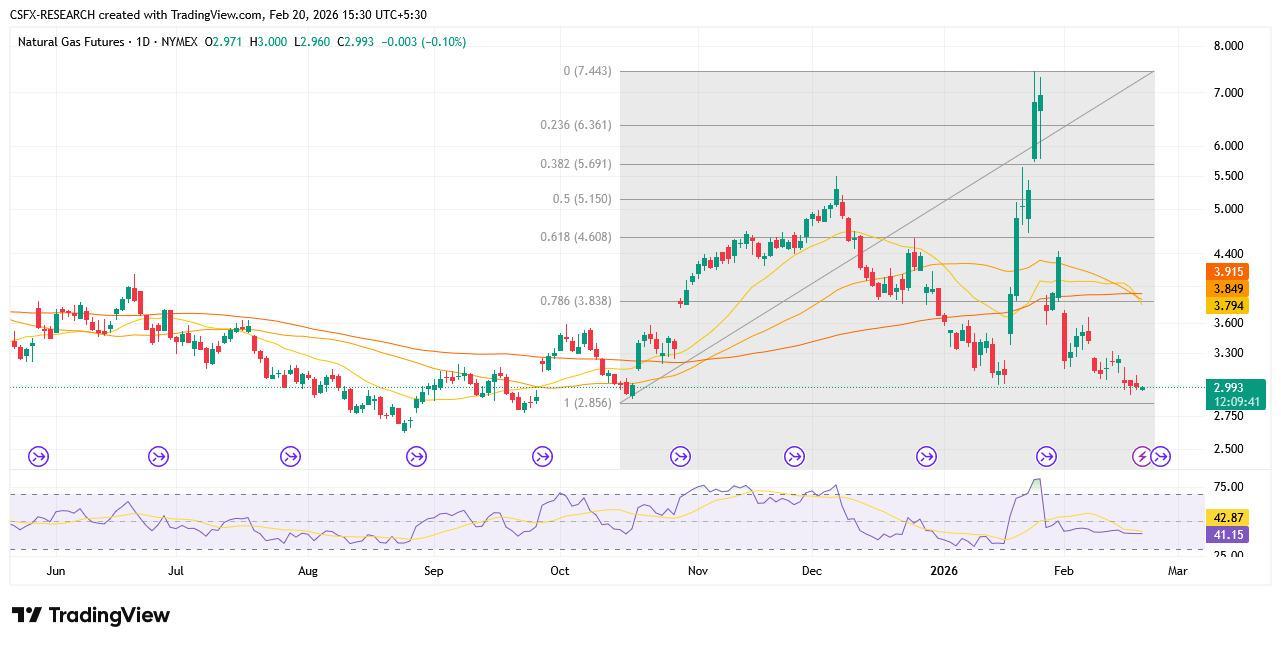
Natural Gas XNGAS/USD
Natural Gas is staying under pressure in the near term, hovering close to the $3.10 critical resistance area.
🏭 U.S. EIA Supply Surplus
🌡 Late-Winter Weather Demand
🇪🇺 European LNG Imports
🔋 U.S. LNG Export Terminal Capacity
Natural Gas is staying under pressure in the near term, with price action compressing around the $3.10 area. Recent data from the U.S. Energy Information Administration (EIA) is continuing to point to strong domestic production, reinforcing the view that supply remains sufficient even as late-winter weather is intermittently boosting demand. U.S. dry gas production is running near record highs above 104 Bcf/day, which is keeping storage inventories relatively comfortable.
On the demand side, Europe is continuing to draw on LNG imports as it is managing post-Ukraine conflict energy security, providing some structural floor for U.S. LNG export demand. However, this support is being offset by mild European temperatures and high continental gas storage levels. New U.S. LNG export terminal capacity coming online through 2026 is providing a medium-term bullish structural case, but near-term price action is remaining capped. The market is approaching a potential turning point as oscillators are stabilizing after previously weak readings, indicating that bearish momentum is easing rather than accelerating.
Exponential Moving Averages
EMA 103.5712 ▼ Bearish
EMA 203.8518 ▼ Bearish
EMA 504.0000 ▼ Bearish
Simple Moving Averages
SMA 103.5340 ▼ Bearish
SMA 204.2199 ▼ Bearish
SMA 504.0137 ▼ Bearish
Momentum Oscillators
RSI (14)35.44 — Sell Zone
Stochastic2.91 — Oversold
Overall Signal
SentimentBearish ▼
DirectionSELL
| Level | R2 | R1 | S1 | S2 |
|---|
| Price (USD) |
$6.84 |
$6.15 |
$3.89 |
$3.20 |
Entry (Limit Sell)$3.08
Take Profit$2.88
Stop Loss$3.20
Direction⬇ SELL
Bearish Full MA negative crossover — near-term sell bias intact; watch for oversold bounce at $3.20.
📊 Elsewhere in Commodity Markets
Gold (XAU)
▲ +0.59% · $5,030.31
Silver (XAG)
▲ +2.33% · $80.36
Palladium
▲ +2.04% · $1,712.64
Platinum
▲ +1.43% · $2,111.05
Brent Crude
▼ −0.83% · $71.33
WTI Crude
▼ −1.05% · $66.03
🗓 Key Economic Events — Today
| Currency | Event | Forecast | Previous | Time (GMT) |
|---|
| USD | Core PCE Price Index MoM (Dec) | 0.3% | 0.2% | 19:00 |
| USD | GDP (QoQ) Q4 — Advance | 2.8% | 4.4% | 19:00 |
| USD | New Home Sales (Dec) | 732K | 737K | 20:30 |
Start Trading Commodities with Capital Street FX
Access Gold, Silver, Crude Oil & Natural Gas with 0.0 pip spreads and up to 1:10,000 leverage.
Open Live Account
Try Free Demo
Frequently Asked Questions — Commodity Trading
Why is Gold (XAU/USD) rising above $5,000 in 2026?
Gold is trading above $5,000 due to a confluence of drivers including escalating US–Iran geopolitical tensions, ongoing Russia–Ukraine uncertainty, continued central bank gold buying (particularly the PBoC), and investor hedging ahead of key U.S. PCE inflation and GDP data. The expectation that the Federal Reserve may begin cutting rates is also reducing the opportunity cost of holding non-yielding Gold, supporting the bullish trend.
What is driving WTI Crude Oil higher toward six-month highs?
WTI Crude Oil is being supported by the threat of military escalation between the U.S. and Iran — a scenario that could disrupt Strait of Hormuz flows carrying approximately 20% of global oil supply. Concurrent Houthi attacks in the Red Sea are forcing shipping detours. OPEC+ is maintaining its voluntary cuts and Russian export volumes are being constrained by Western sanctions. These supply-side risks are combining with a technically bullish chart structure — price is holding firmly above the 200-day SMA at $62.24.
Why is Natural Gas underperforming while energy markets are broadly strong?
Natural Gas is facing a different supply-demand dynamic than crude oil. U.S. domestic dry gas production is running near record highs above 104 Bcf/day, keeping inventories comfortable despite late-winter weather-related demand. Unlike crude oil, natural gas supply disruptions from Middle East tensions have limited direct impact. Additionally, mild European temperatures are reducing LNG import urgency. The bearish technical setup — with all major MAs in negative crossover — reflects this oversupply environment.
How does the U.S. PCE Index affect commodity prices?
The PCE Price Index is the Federal Reserve’s preferred inflation gauge. A higher-than-expected reading would signal persistent inflation, potentially delaying rate cuts and strengthening the U.S. Dollar — which typically puts pressure on Dollar-denominated commodities like Gold and Silver. Conversely, a softer PCE reading could accelerate rate-cut expectations, weaken the Dollar, and lift commodity prices. Today’s release is therefore a critical catalyst for both metals and energy markets.
How can I trade Gold and Oil with Capital Street FX?
Capital Street FX is offering access to Gold (XAU/USD), Silver (XAG/USD), WTI Crude Oil, Brent Crude, and Natural Gas as CFDs through its ALTX and FXYFI platforms. The Zero account is offering 0.0 pip spreads with no commissions. Leverage of up to 1:10,000 is available. You can open a live account with a minimum deposit of $100 (Basic) or try a risk-free demo account immediately.
What does a “Limit Buy” trade suggestion mean in this report?
A “Limit Buy” is an order placed below the current market price, allowing you to enter a long position at a better (lower) price if the market dips to that level. For example, the Gold Limit Buy at $5,053.00 means the trade triggers only if price pulls back to that entry level — potentially improving risk-to-reward compared to entering at market. Always combine any trade suggestion with your own risk management framework and never risk more than you can afford to lose.
Risk Disclaimer: This daily commodity analysis is produced by Capital Street FX for informational purposes only and does not constitute investment advice. Trading CFDs on commodities carries a high level of risk to your capital and may not be suitable for all investors. Leverage can work against you. Past performance is not indicative of future results. Please ensure you fully understand the risks involved and seek independent financial advice if necessary. Capital Street FX does not accept liability for any loss or damage arising from reliance on this material.