Monday 23 February 2026 · Daily Commodity Report · Asian–European Session Update
Daily Commodity Overview: Commodity markets are opening the week mixed as trade-war uncertainty and geopolitical tensions are driving safe-haven demand while simultaneously clouding global growth prospects and energy demand outlooks. Gold and Silver are remaining supported near recent highs — Gold pausing after climbing to a fresh monthly high above $5,150, while Silver extends its four-day rally to $87.10 — as persistent tariff fears, a newly imposed 15% Section 122 global tariff from Trump, and growing Federal Reserve dovish expectations are fuelling precious metals demand. WTI crude oil, by contrast, is struggling near the mid-$65 zone on concerns that escalating trade tensions will dampen global energy demand. Natural Gas is gaining ground, climbing 2.17% on near-record LNG export volumes and revised colder weather forecasts for the next two weeks.
🌍 Macro Context
Today’s Commodity Market Drivers
Trade policy, geopolitics, and Federal Reserve expectations are setting commodity direction this session
🏛️ SCOTUS IEEPA Ruling + Trump 15% Section 122 Tariff (20–22 Feb): The Supreme Court’s 6-3 decision striking down IEEPA tariffs — which collected $164.7B now subject to potential $175B in refund claims — is creating multi-directional commodity impacts. Gold and Silver are benefiting from the resulting USD weakness and fiscal uncertainty. WTI crude is absorbing demand-destruction fears from Trump’s replacement 15% Section 122 tariff. Natural gas markets remain relatively insulated, driven more by LNG export volumes and weather forecasts than tariff policy.
The commodity market’s reaction to the most significant US trade policy shift in years is revealing and asymmetric. Precious metals are the primary beneficiaries of the tariff ruling’s aftermath — the dual forces of Dollar weakness and heightened safe-haven demand are creating a powerful and self-reinforcing dynamic for both Gold and Silver. The December PCE data showing 2.9% headline inflation (3.0% core) is a secondary bullish factor: it reinforces the view that the Fed will hold in March but will be motivated to cut later in the year, reducing real yields and lowering the opportunity cost of holding non-yielding metals.
For energy markets, the picture is more complex. Escalating trade tensions are the dominant near-term headwind for crude oil — the prospect of retaliatory tariffs, supply chain disruptions, and a global growth slowdown is weighing on demand expectations. US–Iran tensions — with Trump having indicated that limited military action remains an option — are simultaneously providing a geopolitical floor that is preventing a clean bearish breakdown below $65/bbl. Natural gas, operating on a separate demand dynamic from crude, is benefiting from the specific combination of near-record LNG exports and a weather system driving colder-than-expected temperatures.
🏛️ SCOTUS IEEPA Struck Down
📜 Trump 15% Section 122
📉 PCE 2.9% Core 3.0%
🏦 Fed 2 Cuts Priced 2026
🇺🇸🇮🇷 US–Iran Tensions
🔥 LNG 18.6 bcfd Record
📉 US GDP 1.4% Q4
Precious Metals Analysis
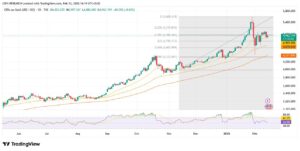
Gold (XAU/USD) Daily Analysis XAUUSD
Monthly high confirmed — four-day rally extending as tariff fears, Middle East risk, and dovish Fed expectations converge
Trading near
$5,152
+0.87% · Fresh monthly high earlier in the session
Bullish
🥇 Monthly High Confirmed
📜 Trump Tariff Uncertainty
🏦 Fed Dovish Expectations
💵 Dollar Weakness
⚔️ Middle East Geopolitical
Gold is taking a brief pause after climbing to a fresh monthly high earlier on Monday, yet the broader fundamental environment continues to support the possibility of extending its four-day rally. The metal is benefiting simultaneously from several distinct demand streams that are rarely active simultaneously: safe-haven inflows driven by trade-war escalation, structural central bank accumulation at twice the 2015–19 historical average, a softening US Dollar following the SCOTUS IEEPA ruling, and growing expectations of Federal Reserve rate cuts later in 2026.
US President Trump unveiled a new 15% global tariff framework under Section 122 of the 1974 Trade Act after the Supreme Court curtailed his IEEPA authority — but this has done little to resolve market uncertainty. The new framework is legally weaker (limited to 150 days without Congressional extension), more narrowly scoped (based on balance-of-payments grounds), and has been characterised by Treasury Secretary Bessent himself as “not as efficient and not as powerful” as IEEPA. This persistent policy ambiguity is continuing to fuel safe-haven demand. The December PCE data — with core at 3.0% year-on-year — reinforced expectations for a March Fed hold while keeping June cut expectations alive, a combination that structurally supports gold.
Middle East geopolitical risk is an additional premium layer. US–Iran tensions remain elevated with Trump indicating military action remains an option if diplomatic talks — currently ongoing — fail to produce results. Any escalation in the region would likely trigger fresh gold buying across both institutional and retail channels simultaneously, potentially providing the catalyst for a move toward the $5,427 resistance zone.
📊 Technical Overview — Moving Averages
Exponential Moving Averages
EMA 10$5,027.39Bullish ✓
EMA 20$4,964.16Bullish ✓
EMA 50$4,737.65Bullish ✓
Simple Moving Averages
SMA 10$5,024.71Bullish ✓
SMA 20$5,022.06Bullish ✓
SMA 50$4,701.09Bullish ✓
RSI (14)
59.00
Zone: Neutral Zone · Neutral
Stochastic Oscillator
83.95
Zone: Elevated / Neutral
| Level | R2 | R1 | S1 | S2 |
|---|
| XAU/USD |
$5,731.18 |
$5,426.94 |
$4,442.03 |
$4,137.79 |
Bullish
All six moving averages are aligned bullishly — a powerful technical confirmation of the structural bull trend. Stochastic at 83.95 is elevated but not yet at extreme levels. The $5,110 dip-buy zone offers tactical re-entry aligned with the trend. A break above $5,427 (R1) would signal the next leg toward $5,731. The primary risk: de-escalation of US–Iran tensions or unexpected Fed hawkishness could trigger profit-taking toward $4,914.
Silver (XAG/USD) Daily Analysis XAGUSD
Fourth consecutive session of gains — India trade delay, EU trade uncertainty and Middle East risk amplifying safe-haven inflows
Trading near
$87.10
+2.21% at $86.47 · targeting $87.50
Bullish / Volatile
🥈 4-Day Rally Extending
🤝 India-US Trade Delay
🌍 EU Trade Reassessment
🏭 Industrial + Safe-Haven
💵 Dollar Weakness Support
Silver (XAG/USD) is extending its rally for a fourth straight session, hovering near $87.10 per troy ounce during European trading hours on Monday. Demand for safe-haven assets including Silver has strengthened as persistent tariff uncertainty continues to rattle global markets. The repercussions of the SCOTUS ruling and Trump’s pivot to a 15% Section 122 tariff have spread far beyond US borders: India has delayed scheduled trade negotiations with the United States due to uncertainty surrounding the tariff framework, slowing progress toward a potential interim deal. Simultaneously, European policymakers are reassessing trade commitments, with several partners seeking clarification on the status of existing agreements under the new legal regime. This broad-based trade disruption is increasing investor uncertainty and benefiting Silver’s appeal as a defensive asset.
Silver’s dual nature as both an industrial metal and a safe-haven asset is particularly relevant in the current environment. On the industrial demand side, the AI infrastructure supercycle continues to drive structural demand for silver in solar panel manufacturing, semiconductor packaging, and EV battery systems — demand that is largely insensitive to short-term price moves. On the safe-haven side, Silver is attracting capital alongside gold as investors reduce exposure to risk assets amid mounting trade frictions and economic uncertainty. Heightened geopolitical tensions in the Middle East — with Trump maintaining that military action against Iran remains on the table — are adding a further premium to the precious metals complex.
Exponential Moving Averages
EMA 10$83.22Bullish ✓
EMA 20$79.25Bullish ✓
EMA 50$69.58Bullish ✓
Simple Moving Averages
SMA 10$85.84Bullish ✓
SMA 20$81.20Bullish ✓
SMA 50$66.10Bullish ✓
RSI (14)
52.96
Zone: Buy Zone · Bullish
Stochastic Oscillator
87.65
Zone: Elevated · Positive
| Level | R2 | R1 | S1 | S2 |
|---|
| XAG/USD |
$104.71 |
$90.62 |
$77.93 |
$63.88 |
Bullish / Volatile
All six moving averages are uniformly bullish — a technically emphatic confirmation of the uptrend. RSI at 52.96 suggests momentum without the overbought risk that the Stochastic at 87.65 implies. The $83.96 entry represents a tactical pullback toward the EMA 10 / SMA 20 confluence zone. Given Silver’s inherent volatility, position sizing is critical — the $77.25 stop represents a meaningful drawdown from entry that traders must be prepared to absorb.
WTI Crude Oil Daily Analysis WTIUSD
Bearish gap opening and demand fears from trade-war escalation weigh — US–Iran tensions preventing deeper breakdown
Trading in
Mid-$65
–1.0%+ · Gap down from Friday’s $68.00 high
Range / Cautious
📉 Trade-War Demand Fears
🇺🇸🇮🇷 Iran Risk — Price Floor
💵 Softer USD Cushions
📊 Fed March Hold Priced
⚠️ Global Supply Chain Fears
West Texas Intermediate (WTI) prices have started the new week on a notably negative note, opening with a bearish gap and pulling back further from last Friday’s peak near $68.00 — the highest level since 4 August. During the Asian session, the benchmark hovered in the mid-$65 range, down more than 1% on the day, as renewed trade-war concerns cloud the outlook for global economic growth and energy demand. The Supreme Court’s IEEPA ruling and Trump’s subsequent 15% Section 122 tariff are perceived by energy markets as introducing a fresh round of global economic disruption risk — tariff wars historically correlate with industrial activity slowdowns and reduced fuel consumption.
A generally softer US Dollar is helping cushion the decline in USD-denominated oil prices. Meanwhile, the advance US GDP report revealing 1.4% annualised growth in Q4 2025 is sustaining expectations of potential Fed rate cuts later in 2026, which is weighing on the Dollar and providing a modest secondary support mechanism for crude. However, market participants largely expect the Fed to hold in March — a view reinforced by the December PCE data — which is preventing a clean Dollar reversal that would more meaningfully support oil prices.
The primary geopolitical counterweight to the bearish demand picture remains US–Iran tensions. Diplomatic talks are ongoing, but Trump’s stated willingness to consider limited military action is maintaining a risk premium within WTI pricing. Approximately 20% of global oil supply transits the Strait of Hormuz — any credible escalation risk can produce $5–10/bbl rapid repricing that would overpower the fundamental demand concerns on an intra-day basis.
Exponential Moving Averages
EMA 10$64.85Bullish ✓
EMA 20$63.85Bullish ✓
EMA 50$62.01Bullish ✓
Simple Moving Averages
SMA 10$64.50Bullish ✓
SMA 20$64.20Bullish ✓
SMA 50$60.72Bullish ✓
⚠️ Note on WTI MAs vs Price Action: Despite all six moving averages showing bullish crossovers (reflecting the recovery from multi-year lows), Monday’s gap-down open and intraday momentum are clearly bearish. The MAs are lagging indicators and reflect last week’s bounce to $68 — not the current session’s deterioration. Fundamental and sentiment signals are overriding the technical MA picture in today’s trade.
RSI (14)
60.27
Zone: Buy Zone · Bullish
Stochastic Oscillator
89.17
Zone: Elevated / Neutral
| Level | R2 | R1 | S1 | S2 |
|---|
| WTI ($/bbl) |
$69.27 |
$66.74 |
$58.56 |
$56.03 |
⚠️ Risk Note on WTI Buy Setup: This is a tactical counter-trend buy from a technical support zone. The intraday momentum and fundamental backdrop (trade-war demand fears, IEA 4 mb/d surplus projection for 2026) are both bearish. The $63.28 stop must be strictly respected. US–Iran headline escalation is the primary potential upside catalyst. Traders should treat this as a short-duration technical trade only.
Range / Bear Bias
The fundamental backdrop for crude is bearish — trade-war demand destruction risk and a structural 4 mb/d surplus dominate the medium-term outlook. The $66.74 resistance is key: a sustained break above would be required to restore bullish short-term momentum. The mid-$64 zone is acting as tactical support where the limit buy is positioned. US–Iran headline developments are the highest-impact intra-session catalyst.
Natural Gas (Henry Hub) Daily Analysis NATGAS
Gaining 2.17% on record LNG export flows and revised colder weather forecasts — storage data tempers stronger gains
Henry Hub
+2.17%
LNG flows 18.6 bcfd · Near Dec record highs
Cautiously Bullish
🚢 LNG 18.6 bcfd — Record
❄️ Colder Weather Forecast
📦 144 bcf Draw — EIA Week
📈 Output 108.7 bcfd Up
⚖️ Production Offsetting Demand
Natural gas prices are climbing 2.17% today, buoyed by near-record LNG export volumes and revised forecasts pointing to colder temperatures and stronger heating demand over the coming two weeks. Gas flows to eight major US LNG export facilities are averaging 18.6 billion cubic feet per day (bcfd) in February — approaching December’s record highs and offering firm underlying demand support. The strength of LNG export demand is reflecting broad global appetite for US natural gas as European and Asian buyers continue to lock in supply amid geopolitical energy uncertainty.
However, the upside is being meaningfully tempered by two offsetting forces. First, rising domestic production: output across the Lower 48 states has averaged 108.7 bcfd this month, up from 106.3 bcfd in January and approaching December’s record peak levels — a supply-side response that limits how much the LNG export demand can push prices higher. Second, the EIA reported a 144 billion cubic foot storage draw for the week ended 13 February. While this confirms ongoing demand, it is notably smaller than the 182 bcf withdrawal recorded during the same period last year and slightly below the five-year average seasonal decline — suggesting that post-Storm Fern demand normalisation is proceeding faster than some bulls had anticipated.
The medium-term trajectory remains cautiously supportive. EIA forecasts for full-year 2026 Henry Hub averaging $4.30/MMBtu remain intact, underpinned by Permian basin pipeline expansion in H2 2026 and the structural data-centre electricity demand creating a new baseload gas consumption driver. Today’s price action is primarily a weather-and-LNG story rather than a macro or tariff-driven move — making natural gas the relative “quiet corner” of commodity markets this session.
Exponential Moving Averages
EMA 10$3.53Bearish ✕
EMA 20$3.81Bearish ✕
EMA 50$3.98Bearish ✕
Simple Moving Averages
SMA 10$3.49Bearish ✕
SMA 20$4.11Bearish ✕
SMA 50$4.00Bearish ✕
RSI (14)
37.60
Zone: Neutral Zone · Neutral
Stochastic Oscillator
6.24
Zone: Oversold · Neutral
| Level | R2 | R1 | S1 | S2 |
|---|
| Henry Hub ($/MMBtu) |
$6.84 |
$6.15 |
$3.89 |
$3.20 |
Bearish / Oversold
All six moving averages are bearishly aligned and positioned above current price — a technically uniform bearish signal. The Stochastic at 6.24 is deeply oversold, and RSI at 37.60 is approaching oversold territory, which may limit immediate downside continuation in the very near-term. Today’s +2.17% bounce is a weather/LNG-driven counter-trend move. The $3.89 support and $3.43 limit sell entry are the key technical levels. EIA storage data Thursday is the week’s primary directional catalyst.
📊 Overall Commodity Market View — Monday 23 February 2026
Gold is the standout asset in today’s commodity landscape, with all six moving averages aligned bullishly and fresh monthly high confirmation above $5,100. The convergence of tariff uncertainty, Middle East risk, dovish Fed expectations, and structural central bank demand is making every dip a tactical accumulation opportunity. The $5,110 limit buy is the session’s highest-conviction tactical trade.
Silver is sharing Gold’s structural tailwinds while adding its own industrial demand dimension from the AI supercycle. The $83.96 buy entry provides a meaningful pullback opportunity with a defined $77.25 stop. Volatile intraday swings are the primary risk — position sizing must account for Silver’s characteristic amplification of Gold’s moves.
WTI crude oil is caught in a bear-fundamentals/geopolitical-floor tension that is likely to keep the market range-bound between $64 and $67 intra-session. The limit buy at $64.86 is a tactical technical trade, not a fundamental conviction position. US–Iran headline risk and Thursday’s EIA report are the primary catalysts capable of breaking the range decisively in either direction.
Natural gas is bouncing on today’s LNG and weather catalysts, but the technical picture remains bearish across all six moving averages. The $3.43 limit sell is aligned with the structural downtrend and is supported by the EIA storage data showing a smaller-than-average draw. Thursday’s weekly storage report will be the definitive directional signal for the week.
📊 Elsewhere in Commodity Markets
Gold (XAU)
▲ +0.87% at $5,152.00
Silver (XAG)
▲ +2.21% at $86.47
Palladium
▲ +0.71% at $1,637.76
Platinum
▲ +0.85% at $2,014.75
Brent Crude
▼ –0.81% at $71.13
WTI Crude
▼ –0.17% at $66.24
🗓 Key Events Today
| Currency | Event | Time (EST) | Forecast | Previous | Impact |
|---|
| NZD | Retail Sales (QoQ) — Q4 | 03:15 | +0.6% | +1.9% | Medium |
| CHF | PPI (MoM) — January | 13:00 | +0.1% | –0.2% | Medium |
| USD | Fed Governor Waller Speaks | TBC | — | — | High · Gold Catalyst |
| GBP | BoE External Member Taylor Speaks | TBC | — | — | Medium |
Trade Gold, Silver, Oil & Gas with Capital Street FX
All major commodities — ultra-tight spreads, leverage up to 1:10,000, and over 2,000+ instruments. Zero account: 0.0 pip spreads on gold from just $5,000 minimum.
Open Live Account
Try Free Demo
Frequently Asked Questions — Daily Commodity Analysis
Why is gold holding near monthly highs in February 2026?
Gold is maintaining near monthly highs above $5,100 on 23 February 2026 due to escalating trade-war concerns following Trump’s new 15% Section 122 tariff, growing expectations of a dovish Federal Reserve (two 25bp cuts priced for 2026), persistent Middle East geopolitical tensions, and broad US Dollar weakness following the Supreme Court’s invalidation of IEEPA tariffs. All six moving averages (EMA and SMA across the 10, 20, and 50 periods) are showing bullish positive crossovers, technically confirming the structural uptrend. December PCE at 3.0% core reinforces the case for Fed cuts later in the year, providing a real-yield tailwind for gold.
What is driving Silver higher today?
Silver (XAG/USD) is extending its rally for a fourth consecutive session near $87.10 on safe-haven demand driven by tariff uncertainty, US–Iran geopolitical tensions, and spillover from gold’s strength above $5,100. The Supreme Court’s curtailment of Trump’s broad tariff authority has intensified investor concerns about global trade disruption: India has postponed US trade negotiations, while European policymakers are reassessing trade commitments — both increasing economic uncertainty that benefits Silver’s dual role as a safe-haven asset and industrial metal. The AI infrastructure supercycle (solar panels, semiconductor packaging, EV batteries) continues to provide structural industrial demand that is price-inelastic at current levels.
Why is WTI crude oil falling despite geopolitical tensions?
WTI crude oil is opening the week with a bearish gap, trading in the mid-$65 range, down over 1%, because trade-war concerns from Trump’s new 15% global tariff are clouding the global economic growth and energy demand outlook. While US–Iran tensions are providing some support — preventing deeper losses below $64 — the dominant force is demand-side pessimism: escalating trade tensions historically correlate with industrial activity slowdowns and reduced fuel consumption. The IEA’s projected 4 million barrel-per-day global supply surplus for 2026 is the underlying structural headwind that prevents any sustained recovery.
What is supporting Natural Gas prices today?
Natural gas prices are climbing 2.17% supported by two primary factors: near-record LNG export volumes averaging 18.6 bcfd at eight major US export facilities in February (approaching December’s record highs), and revised weather forecasts pointing to colder temperatures and stronger heating demand over the next two weeks. However, the upside is tempered by rising domestic production (108.7 bcfd in February, up from 106.3 in January) and an EIA-reported 144 bcf storage draw for the week ended 13 February — smaller than the 182 bcf year-ago figure and below the five-year average. Despite today’s bounce, all six technical moving averages remain bearishly aligned, confirming this as a counter-trend move.
How do the SCOTUS ruling and Trump’s new 15% tariff affect commodity markets?
The SCOTUS IEEPA ruling on 20 February 2026 is affecting commodities asymmetrically. For Gold and Silver: it is bullish — the ruling creates USD weakness, potential $175 billion in refund obligations, and heightened uncertainty that increases safe-haven demand. For Crude Oil: it is net bearish — Trump’s replacement 15% Section 122 tariff and ongoing trade-war fears are clouding global growth and energy demand prospects, overriding the mild USD weakness support. For Natural Gas: relatively neutral — LNG export demand and domestic weather patterns are the primary near-term drivers, with tariff uncertainty having limited direct impact on gas market fundamentals.
What are the key technical levels for Gold (XAU/USD) today?
Gold’s key technical levels are: Resistance R1 at $5,426.94 and R2 at $5,731.18; Support S1 at $4,442.03 and S2 at $4,137.79. All three EMAs (10: $5,027, 20: $4,964, 50: $4,738) and all three SMAs (10: $5,025, 20: $5,022, 50: $4,701) are showing bullish positive crossovers. RSI at 59.0 confirms neutral-to-bullish positioning. The trade suggestion is a limit buy at $5,110.73 targeting $5,458.00, with a stop loss at $4,914.00. Today’s session high above $5,150 represents the fresh monthly high.
Risk Disclaimer: This Daily Commodity Analysis is produced by Capital Street FX for informational purposes only and does not constitute investment advice or a solicitation to trade. Commodity and CFD trading involves significant risk of loss and may not be suitable for all investors. Leverage can amplify both profits and losses. Past performance is not a reliable indicator of future results. Trade suggestions, entry points, take profit and stop loss levels are for illustrative purposes only. Gold, Silver, Oil and Natural Gas markets can be significantly affected by geopolitical developments, weather events, and policy announcements that are difficult to predict. Capital Street FX accepts no liability for trading losses arising from this report. Data correct as of 23 February 2026. All institutional forecasts cited represent those organisations’ publicly available research.