
Daily Crypto Analysis
Bitcoin Is Testing Critical Support as Geopolitical Risks Mount
BTC is heading for its fifth consecutive weekly decline. Ethereum, XRP, and Dogecoin are all trading under bearish pressure as US–Iran tensions and Fed hawkishness are tightening financial conditions.
Crypto Markets Are Consolidating Under Bearish Pressure
Major cryptocurrencies are trading in consolidation mode this Friday as a convergence of bearish macro forces is keeping traders cautious and risk appetite suppressed. Bitcoin is stabilising after defending key support, while Ethereum and XRP are hovering near critical technical levels. Dogecoin is remaining under pressure, with bearish momentum continuing to cap recovery attempts across the broader crypto market.
The macro backdrop is weighing heavily. Bitcoin is on course to record its fifth consecutive weekly decline — a streak last seen during the March to May 2022 bear market. The drivers are well-defined: an escalating US–Iran geopolitical standoff, a stronger US Dollar approaching 97.84 on the Dollar Index, hawkish Federal Reserve signals emanating from Wednesday’s FOMC minutes, and institutional ETF outflows that are indicating a selective risk reduction among even the largest market participants.
BlackRock’s IBIT Bitcoin ETF is recording net outflows on February 17, suggesting that even institutional players are currently reducing rather than adding crypto exposure. Bitcoin’s correlation with the Nasdaq and tech stocks is remaining elevated, making the asset increasingly sensitive to any deterioration in broad risk sentiment.
Bitcoin (BTC/USD)
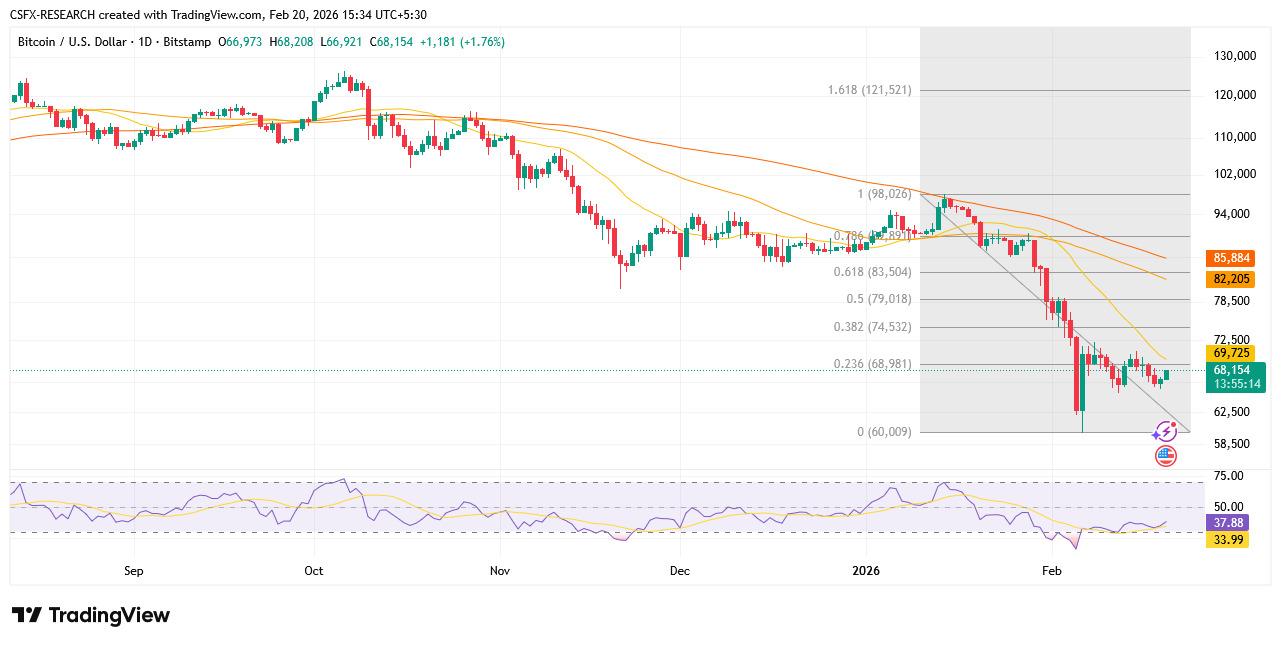
Bitcoin is bouncing after revisiting the lower boundary of its 13-day consolidation range. The price is moving sideways within a defined channel between $65,729 and $71,746 since February 7. BTC is beginning the current week on a weaker footing, slipping during the first half before staging a modest rebound on Thursday after testing the lower boundary.
As of Friday, Bitcoin is trading near $67,200, with the intraday bounce providing temporary relief. However, the broader trend remains under pressure. All exponential moving averages — the 10-, 20-, and 50-day — are recording negative crossovers, collectively confirming bearish momentum across multiple timeframes.
A daily close below $65,729 would be a technically significant bearish signal, opening the door to a deeper pullback toward the major psychological support at $60,000. Conversely, if buyers continue to defend the lower boundary with conviction, BTC may mount another attempt toward the upper range near $71,746.
Technical Indicators — BTC/USD
Trade Suggestion — BTC/USD
Ethereum (ETH/USD)
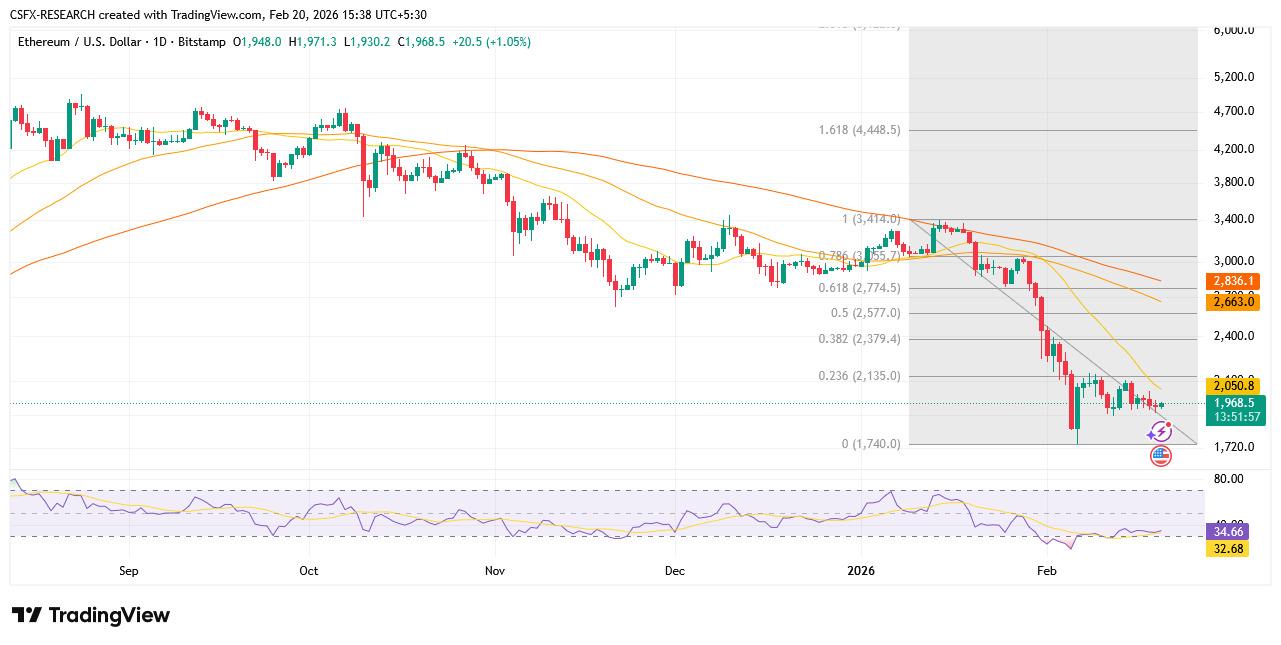
Ethereum is facing rejection near the upper boundary of its consolidation range at $2,149, falling 5.75% in a single session on Sunday. The asset is continuing to edge lower through the week and is now, as of Friday, approaching the lower end of its range. A daily close below the $1,747 support zone could accelerate losses toward the next key level at $1,669.
Momentum signals are presenting a mixed picture. The RSI is sitting at 34.47, which is building bearish pressure and approaching oversold territory. However, the MACD’s bullish crossover from Saturday is remaining intact, indicating that the broader underlying structure has not yet been fully negated.
All six moving averages are registering negative crossovers, painting a uniformly bearish technical picture for ETH. The $1,747 level is the critical near-term decision point.
Technical Indicators — ETH/USD
Trade Suggestion — ETH/USD
XRP / Ripple (XRP/USD)
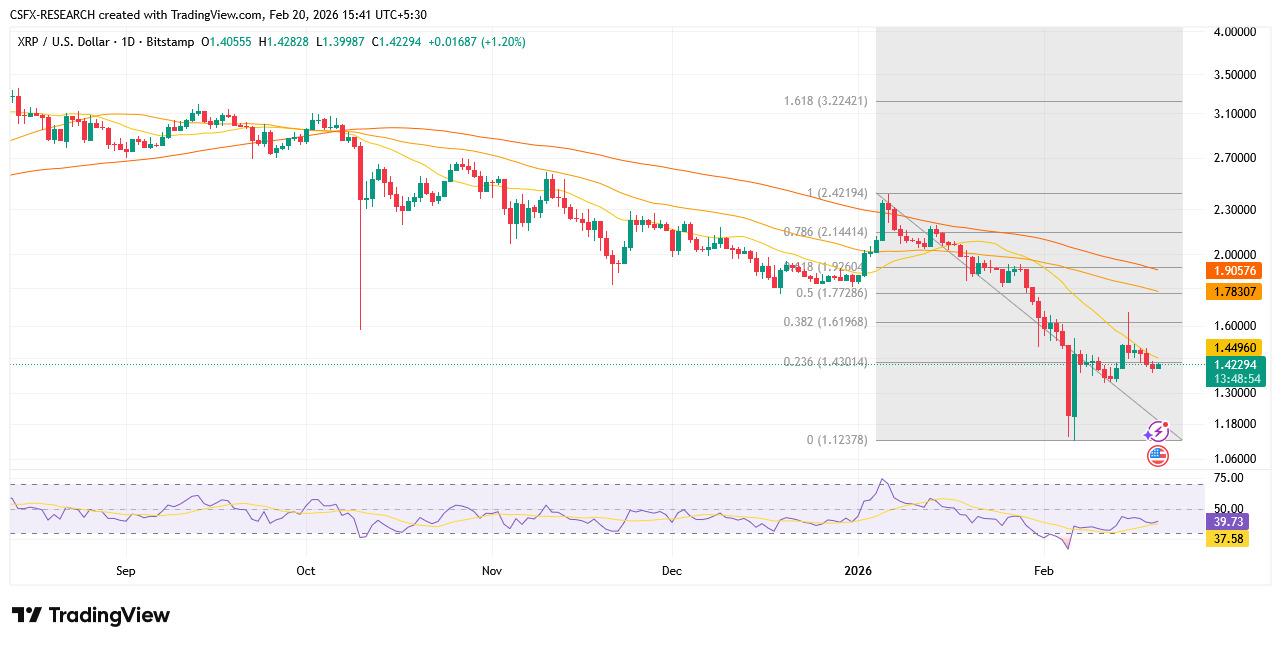
XRP is moving above the lower trendline of a falling wedge on Saturday before edging lower the following session, where it is finding support near that same level. The token is stabilising around the trendline through the week and is trading near $1.42 as of Friday.
A sustained move lower, confirmed by a daily close below the trendline, could see XRP extend losses toward the weekly support around $1.30. On the upside, if the falling wedge trendline continues to hold, XRP could attempt a recovery toward the 50-day EMA near $1.68.
Technical Indicators — XRP/USD
Trade Suggestion — XRP/USD
Dogecoin (DOGE/USD)
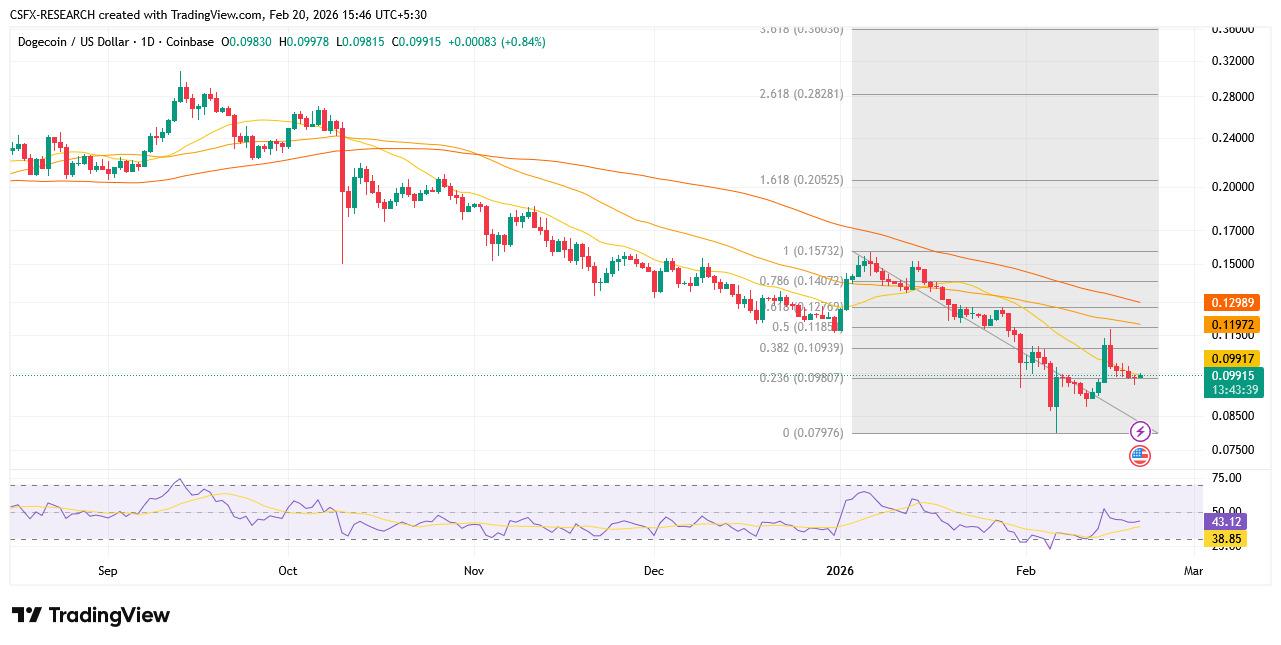
Dogecoin is resuming its decline after slipping below the $0.1050 area. The sell-off is pushing prices beneath the psychological $0.10 mark, with a low forming around $0.0955.
Immediate support is sitting near $0.0955, followed by the next key support around $0.0920. On the upside, a sustained move above the $0.1040 resistance could open the door for a rebound toward $0.1065.
Technical Indicators — DOGE/USD
Trade Suggestion — DOGE/USD
Live Crypto Market Snapshot
Key Economic Events Impacting Crypto Today
| Release | Forecast | Previous | Impact on Crypto |
|---|---|---|---|
| Core PCE Price Index (MoM) | 0.3% | 0.2% | HIGH — hawkish print = BTC downside |
| US GDP (QoQ) Final Q4 | 2.8% | 4.4% | MEDIUM — weak print may lift risk appetite |
| Weekly Jobless Claims | ~225K | — | MEDIUM — higher claims = looser Fed = BTC bullish |
| US–Iran Geopolitical Development | Ongoing | — | HIGH — escalation triggers risk-off |
| DXY Dollar Index Movement | ~97.84 | 97.70 | HIGH — stronger dollar = BTC bearish |
Crypto Market FAQs
© 2026 Capital Street FX. All Rights Reserved. | License No. C112010690.