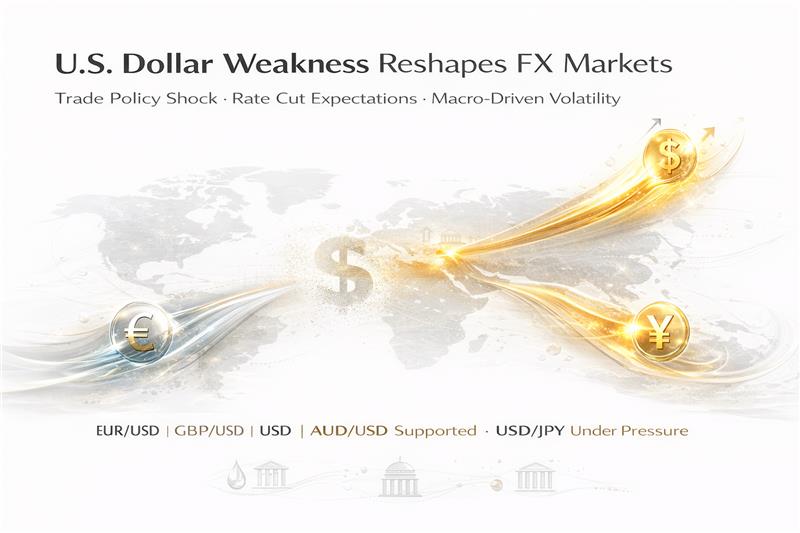
Daily FX Overview: Major currency pairs are opening the week on a firm footing as broad US Dollar weakness dominates market sentiment. The Supreme Court’s landmark 6-3 ruling on 20 February 2026 striking down IEEPA tariffs — estimated to have illegally collected $164.7 billion — has created a powerful USD headwind, even as President Trump swiftly responded by invoking Section 122 of the 1974 Trade Act to impose a new 15% global tariff effective 24 February. The resulting policy ambiguity — combined with a sharp US GDP slowdown to 1.4% annualised in Q4 2025, a Q4 government shutdown impact, and market pricing of two to three 25bp Fed rate cuts in 2026 — is underpinning gains in EUR/USD, GBP/USD, and AUD/USD while safe-haven flows continue to drive demand for the Japanese Yen.
🌍 Macro Context
Today’s Key Macro Drivers
The fundamental forces shaping every major pair this session
🏛️ SCOTUS IEEPA Ruling (20 Feb 2026) — The Defining Event of the Week: In a 6-3 decision (Roberts, Sotomayor, Kagan, Gorsuch, Barrett, Jackson), the Supreme Court ruled that IEEPA does not authorise tariffs. An estimated $164.7–175 billion in tariffs are now subject to refund claims. Trump moved within hours to impose a new 10% global tariff under Section 122 of the 1974 Trade Act, then raised it to 15% on Saturday — effective 12:01am Tuesday 24 February. Section 122 is legally far more constrained: maximum 150 days, requires Congressional approval to extend, and is based on balance-of-payments grounds only. The effective US tariff rate has declined from approximately 13.7% pre-ruling to around 8–13% depending on category.
The macro landscape entering this session is characterised by compounding Dollar headwinds that are proving difficult to offset even with relatively resilient US data. The US economy slowed sharply to 1.4% annualised GDP growth in Q4 2025, down from 4.4% in Q3 — a deterioration partly attributable to the record-long government shutdown. The December PCE Price Index rose 2.9% year-on-year (core: 3.0%), reinforcing expectations that the Federal Reserve will hold rates unchanged at the March meeting while preserving optionality for cuts in June and later in the year. Markets are now pricing two to three 25bp reductions through 2026. The Bank of England’s Alan Taylor and the Fed’s Christopher Waller are both speaking today, with their tone on rate trajectories serving as the primary intra-session catalyst across GBP and USD pairs.
🏛️ SCOTUS IEEPA Invalidated
📜 Trump 15% Section 122 Tariff
📉 US GDP 1.4% Q4 2025
🏦 Fed 2–3 Cuts Priced 2026
🇺🇸🇮🇷 US–Iran Geopolitical Risk
🇬🇧 BoE Taylor Speaks Today
🏦 Fed Waller Speaks Today
💵 USD Debasement Narrative
Currency Analysis
EUR/USD Daily Analysis EURUSD
Recovering from near one-month lows as Dollar weakness provides structural lift — ECB and EU trade headwinds cap upside
Trading near
1.1835
Rebound from 1.1740–1.1750 one-month trough
Neutral / Sell Bias
📉 USD Weakness
🏦 ECB Stable ~2%
🇩🇪 German GDP Miss Risk
⚠️ Lagarde Tenure Uncertainty
📜 EU-US Trade Tariff Exposure
EUR/USD is continuing to build on Friday’s late rebound from the 1.1750–1.1740 zone, marking a recovery from a near one-month low, and is carrying positive momentum into the Asian and early European session on Monday. Spot prices are advancing toward the 1.1835 region, principally supported by broad-based USD weakness in the aftermath of the SCOTUS ruling. Despite the near-term recovery, the pair is navigating a complex fundamental landscape that limits clean directional conviction.
On the USD side, the SCOTUS invalidation of IEEPA tariffs is the dominant force — with up to $175 billion in potential refunds now in play (Penn Wharton Budget Model), the fiscal dynamics are creating a structural selling impulse on the Dollar independent of rate expectations. Trump’s pivot to a 15% Section 122 tariff maintains import protection but under a legally weaker and time-limited framework, reducing the Dollar’s safe-haven appeal on trade grounds. Meanwhile, US Q4 GDP cooling to 1.4% annualised is reinforcing market pricing for a June Fed rate cut, further weighing on the Greenback.
On the Euro side, the picture is more mixed. The ECB has concluded its easing cycle with rates stabilised near 2%, offering structural support. However, uncertainty surrounding ECB President Christine Lagarde’s tenure is creating institutional uncertainty, and ongoing EU exposure to US tariffs — particularly sector-specific Section 232 duties on steel and aluminium that survived the SCOTUS ruling — continues to weigh on Eurozone manufacturing sentiment. This week’s German GDP and Eurozone CPI readings are the critical data risks for this pair.
📊 Technical Overview — Moving Averages
Exponential Moving Averages
EMA 10
1.1819
Bearish ✕
EMA 20
1.1818
Bearish ✕
EMA 50
1.1775
Bullish ✓
Simple Moving Averages
SMA 10
1.1836
Bearish ✕
SMA 20
1.1854
Bearish ✕
SMA 50
1.1773
Bullish ✓
📈 Oscillators
RSI (14)
50.18
Zone: Buy Zone · Bullish
Stochastic Oscillator
19.36
Zone: Sell Zone · Neutral
🎯 Key Support & Resistance Levels
| Level | R2 | R1 | S1 | S2 |
|---|
| EUR/USD |
1.2030 |
1.2150 |
1.1640 |
1.1520 |
💡 Trade Suggestion
Neutral / Sell
The short-term technical picture remains bearish with EMA 10 and EMA 20 showing negative crossovers above current price. The broader USD macro headwinds are providing temporary relief for bulls, but the pair remains below key short-term moving averages. The 1.1640 support is critical — a sustained break would confirm a more extended correction. Upside above 1.1875 invalidates the near-term sell thesis.
GBP/USD Daily Analysis GBPUSD
Sterling holding above 1.3500 as UK data resilience meets ongoing tariff-driven Dollar weakness
Trading near
1.3520
Stabilising after slide to four-week low
Bearish Sentiment
🇬🇧 UK PMI Beat — Feb
🛍️ UK Retail Sales Positive Jan
⚠️ BoE Dovish Expectations
🗣️ BoE Taylor Speaks Today
📊 US PPI Friday Key Risk
GBP/USD is trading firmly around the 1.3520 region in early European dealings on Monday, attempting to stabilise following last week’s slide to a four-week low driven by renewed tariff concerns. The pair is drawing simultaneous support from two distinct sources: stronger-than-expected UK economic data and broad USD weakness from the SCOTUS IEEPA ruling. Preliminary February S&P Global PMI figures have exceeded forecasts, while January Retail Sales have returned to positive growth — signalling meaningful UK economic resilience heading into spring 2026.
Market participants are now focused on remarks from Bank of England External Member Alan Taylor and Federal Reserve Governor Christopher Waller later in the session. Taylor’s tone on the UK rate path will be particularly important: a more hawkish tilt from the BoE would provide fresh GBP buying momentum and potentially push the pair above the key 1.3596 resistance zone, while any dovish language would reinforce the current cautious technical picture. The UK’s preferential trade arrangement with the US — which existed prior to the SCOTUS ruling — now faces fresh uncertainty under the new Section 122 tariff framework, which does not automatically preserve bilateral trade deals negotiated under IEEPA authority.
Looking ahead, Friday’s US Producer Price Index (PPI) — with both headline and core projected at +0.3% month-on-month — remains the session’s most significant forward-looking risk event. A stronger-than-expected reading would strengthen the case for the Fed to delay rate cuts, providing potential USD support and capping GBP/USD gains above 1.3596.
📊 Technical Overview — Moving Averages
Exponential Moving Averages
EMA 10
1.3549
Bearish ✕
EMA 20
1.3570
Bearish ✕
EMA 50
1.3523
Bearish ✕
Simple Moving Averages
SMA 10
1.3568
Bearish ✕
SMA 20
1.3632
Bearish ✕
SMA 50
1.3531
Bearish ✕
📈 Oscillators
RSI (14)
45.87
Zone: Neutral Zone · Neutral
Stochastic Oscillator
13.94
Zone: Sell Zone · Neutral
🎯 Key Support & Resistance Levels
| Level | R2 | R1 | S1 | S2 |
|---|
| GBP/USD |
1.3956 |
1.3832 |
1.3432 |
1.3308 |
💡 Trade Suggestion
Bearish
All six moving averages (EMA and SMA across the 10, 20, and 50 periods) are showing negative crossovers — a technically aligned bearish signal that is rare in its uniformity. The 1.3432–1.3308 support zone is the key downside reference. BoE Taylor’s tone today is the key intra-session wildcard that could temporarily override the technical picture.
AUD/USD Daily Analysis AUDUSD
Third consecutive session of gains as AI commodity supercycle and RBA hawkishness underpin the Aussie Dollar
Trading near
0.7100
Extending 3-session rally — European session
Bullish
🏦 RBA Hawkish Bias
⛏️ AI Commodity Demand
💵 USD Weakness Tailwind
⚠️ US–Iran Risk-Off Risk
🇨🇳 China Demand Signals
AUD/USD has extended its rally for a third straight session, changing hands near 0.7100 during European hours on Monday — the Australian Dollar strengthening as a softer US Dollar driven by tariff policy uncertainty continues to provide a powerful tailwind. The pair’s resilience is notable given that it is occurring against a backdrop of elevated geopolitical uncertainty, with US–Iran tensions and global risk aversion factors that would typically weigh on a high-beta, commodity-linked currency like the Aussie.
The AUD is drawing structural support from the Reserve Bank of Australia’s comparatively hawkish policy stance. Domestic Australian data has remained firmer than global peers — local CPI running above consensus has bolstered the view that the RBA will maintain a tighter bias to tackle persistent inflation pressures, in contrast to the Fed’s easing trajectory and the ECB’s stabilisation. This divergence in central bank posture is creating a genuine rate differential tailwind for the Australian Dollar. The AI-linked commodity supercycle — driving surging demand for copper, aluminium, rare earths, and lithium from Australia — remains the structural medium-term driver.
The primary downside risk for today’s session is geopolitical: renewed US–Iran tensions, with the Trump administration having indicated that limited military action remains an option if diplomatic talks fail, could trigger risk aversion that diverts flows away from commodity-linked currencies and into JPY and CHF safe havens. Traders should monitor the Middle East headline risk throughout the European and US sessions carefully.
📊 Technical Overview — Moving Averages
Exponential Moving Averages
EMA 10
0.7063
Bullish ✓
EMA 20
0.7015
Bullish ✓
EMA 50
0.6880
Bullish ✓
Simple Moving Averages
SMA 10
0.7079
Bullish ✓
SMA 20
0.7041
Bullish ✓
SMA 50
0.6840
Bullish ✓
📈 Oscillators
RSI (14)
63.35
Zone: Buy Zone · Bullish
Stochastic Oscillator
71.82
Zone: Buy Zone · Neutral
🎯 Key Support & Resistance Levels
| Level | R2 | R1 | S1 | S2 |
|---|
| AUD/USD |
0.7173 |
0.7071 |
0.6742 |
0.6640 |
💡 Trade Suggestion
Bullish
All six moving averages are aligned bullishly — a technically rare clean sweep across all timeframes. RSI at 63.35 confirms momentum without yet reaching overbought territory. The 0.7051 dip-buy zone offers a tactical entry aligned with the structural bull trend. Primary risk: a sharp escalation in US–Iran tensions triggering risk-off flows could quickly test the 0.7006 stop level.
USD/JPY Daily Analysis USDJPY
Safe-haven Yen demand intensifying as risk appetite deteriorates on Trump’s 15% global tariff announcement
Trading near
154.35
Down –0.45% on session · off 154.00 low
Bearish USD
🇯🇵 JPY Safe-Haven Demand
📉 US GDP 1.4% Q4 Slowdown
⚠️ Trump 15% Tariff Risk-Off
🏦 Fed March Hold Priced
🇯🇵 BOJ Subdued Core CPI
USD/JPY remains under notable selling pressure throughout the European session on Monday, holding onto sharp intraday losses despite a modest rebound from the 154.00 psychological level. The pair is hovering near 154.35, down more than 0.45% on the day, with risks tilted to the downside. Global risk appetite has deteriorated markedly after President Trump moved ahead with a new 15% global tariff (Section 122) following Friday’s Supreme Court ruling — a development that has heightened fears of retaliatory actions and renewed disruptions to global supply chains, dampening demand for risk-sensitive assets and increasing flows into traditional safe havens, most notably the Japanese Yen.
Additional downward pressure on USD/JPY is stemming from a broadly weaker US Dollar. Friday’s PCE data reinforced expectations for a Fed hold in March, but the GDP miss at 1.4% annualised in Q4 2025 is keeping markets pricing meaningful rate cuts later in the year — a dynamic that mechanically compresses the yield differential between US Treasuries and Japanese Government Bonds. Meanwhile, Japan’s subdued Q4 GDP growth — which increases pressure on Prime Minister Sanae Takaichi to consider further fiscal stimulus — is ironically less bearish for the Yen than it might typically be, because safe-haven flows are currently overwhelming fundamental domestic weakness.
Recent data showing Japan’s core inflation cooling to its slowest pace in two years has reduced near-term expectations of Bank of Japan policy tightening. However, the BOJ’s medium-term normalisation trajectory remains intact, and markets are still pricing at least one additional 25bp hike in H2 2026, which provides a structural Yen tailwind that will reassert itself once the current risk-off episode stabilises.
📊 Technical Overview — Moving Averages
Exponential Moving Averages
EMA 10
154.52
Bullish ✓
EMA 20
154.85
Bearish ✕
EMA 50
155.25
Bearish ✕
Simple Moving Averages
SMA 10
153.93
Bullish ✓
SMA 20
154.55
Bullish ✓
SMA 50
155.96
Bearish ✕
📈 Oscillators
RSI (14)
47.72
Zone: Neutral Zone · Neutral
Stochastic Oscillator
48.30
Zone: Neutral Zone · Neutral
🎯 Key Support & Resistance Levels
| Level | R2 | R1 | S1 | S2 |
|---|
| USD/JPY |
159.98 |
158.25 |
152.62 |
150.89 |
💡 Trade Suggestion
⚠️ Risk Note on USD/JPY Buy Setup: This is a technical rebound trade against the structural trend. The medium-term directional bias for USD/JPY remains bearish given the BOJ–Fed policy convergence, safe-haven Yen demand, and US trade uncertainty. This trade is intended as a short-duration tactical position; the 152.22 stop must be respected. Any headline escalation from Trump on tariffs or Middle East can invalidate the rebound premise rapidly.
Neutral / Bear Bias
The overall sentiment is neutral with a medium-term bearish bias for the USD versus JPY. While a technical rebound from the 154.00 zone is possible — with three of six MAs positioned bullishly — the structural forces (BOJ hiking cycle, Fed easing cycle, risk-off safe-haven demand) remain directionally negative for this pair. Resistance at 156.76 is the key level that would need to break to challenge the bear thesis.
📊 Overall FX Market View — Monday 23 February 2026
EUR/USD: Recovering toward 1.1835 but facing multiple bearish MA crossovers above current price. USD macro weakness is the primary driver of any recovery — without a clear EUR-positive catalyst, the pair is likely to remain capped below 1.1875. A neutral-to-sell bias prevails.
GBP/USD: Holding above 1.3500 supported by UK data resilience, but all six MAs are bearishly aligned in a rare technical sweep. The pair is highly sensitive to BoE and Fed communication today. The sell bias from 1.3596 remains the highest-conviction setup among the four pairs.
AUD/USD: The cleanest bullish setup in today’s FX landscape, with all MAs aligned positively and RSI confirming momentum. The 0.7051 dip-buy zone is the tactical entry. US–Iran geopolitical escalation is the primary risk that could rapidly shift the pair into risk-off mode.
USD/JPY: Technically neutral but fundamentally bearish. Safe-haven Yen demand from Trump’s 15% tariff announcement and risk aversion is providing intraday selling pressure. The limit buy at 153.52 is a tactical counter-trend trade requiring strict stop discipline. The structural case for USD/JPY lower remains intact.
📊 Elsewhere in FX Markets
USD/CHF
▼ Safe-Haven CHF Bid
🗓 Key Economic Events Today
| Currency | Event | Time (EST) | Forecast | Previous | Impact |
|---|
| NZD | Retail Sales (QoQ) — Q4 | 03:15 | +0.6% | +1.9% | Medium |
| CHF | PPI (MoM) — January | 13:00 | +0.1% | –0.2% | Medium |
| USD | Fed Governor Waller Speaks | TBC | — | — | High |
| GBP | BoE External Member Taylor Speaks | TBC | — | — | High |
Trade Major FX Pairs with Capital Street FX
EUR/USD, GBP/USD, AUD/USD, USD/JPY — ultra-tight spreads from 0.0 pips, leverage up to 1:10,000, across 2,000+ instruments.
Open Live Account
Try Free Demo
Frequently Asked Questions — Daily FX Analysis
Why is the US Dollar weakening on 23 February 2026?
The US Dollar is weakening due to three converging forces: the Supreme Court’s 6-3 ruling on 20 February 2026 striking down IEEPA-based tariffs — which collected $164.7B now subject to refund claims up to $175B (Penn Wharton) — created fiscal uncertainty; a sharp GDP slowdown to 1.4% annualised in Q4 2025 (vs 4.4% in Q3); and market pricing of two to three 25bp Fed rate cuts in 2026. Trump’s pivot to a 15% Section 122 tariff (effective 24 Feb) is adding a fresh layer of policy uncertainty rather than restoring Dollar confidence. The overall effective US tariff rate has fallen from approximately 13.7% to around 8–13%, which is a structural negative for the Dollar’s trade-support narrative.
What is the EUR/USD outlook today?
EUR/USD is trading near 1.1835 after recovering from a near one-month low of 1.1740–1.1750. Dollar weakness from the SCOTUS tariff ruling and slowing US GDP are supporting the pair. However, uncertainty over ECB President Lagarde’s tenure, ongoing EU–US trade tensions, and all short- to medium-term moving averages signalling bearish crossovers above current price are capping gains. The overall technical outlook is neutral with a short-term sell bias, with a limit sell trade suggested at 1.1821 targeting 1.1739, and stop loss at 1.1875.
What is driving GBP/USD today?
GBP/USD is holding above 1.3500, supported by stronger-than-expected UK data: February S&P Global PMI beats and January Retail Sales returning to positive growth signal UK economic resilience. USD weakness following the SCOTUS ruling is also providing lift. However, all six exponential and simple moving averages (10, 20, and 50 periods) are showing bearish crossovers — a rare uniform bearish technical signal. Markets are watching BoE Member Alan Taylor’s remarks and Friday’s US PPI as the next key catalysts for directional movement.
Why is AUD/USD rising and what are the risks?
AUD/USD is extending its rally for a third consecutive session near 0.7100, driven by broad USD weakness and the RBA’s relatively hawkish stance on inflation. All six moving averages are showing bullish positive crossovers, and the RSI at 63.3 confirms robust bullish momentum without entering overbought territory. The primary downside risk is geopolitical: escalating US–Iran tensions can trigger risk-off flows that reduce appetite for high-beta commodity currencies like AUD. The AI-linked commodity supercycle — surging demand for copper, aluminium, and rare earths — remains the structural medium-term support.
What is the USD/JPY direction today and what are the key levels?
USD/JPY is trading near 154.35, down over 0.45% on the day, as safe-haven demand for the Yen intensifies amid Trump’s new 15% global tariff announcement and deteriorating global risk appetite. Key support is at 152.62 and 150.89; resistance stands at 158.25 and 159.98. The trade suggestion is a limit buy at 153.52 targeting 156.50 — a tactical counter-trend technical rebound trade only. The structural medium-term bias remains bearish USD/JPY given the converging BOJ–Fed policy trajectories and persistent safe-haven Yen demand.
How does Trump’s 15% Section 122 tariff affect currency markets differently from IEEPA tariffs?
Trump’s pivot from IEEPA to Section 122 of the 1974 Trade Act creates a legally weaker and time-constrained trade framework. Section 122 allows tariffs of up to 15% for a maximum of 150 days without Congressional approval — compared to IEEPA’s theoretically indefinite reach. US Treasury Secretary Bessent has acknowledged this mechanism is “not as efficient and not as powerful” as IEEPA. The net effect on FX is that while the tariff rate is largely maintained at 15%, the policy durability is significantly reduced, adding another layer of uncertainty that is sustaining Dollar weakness rather than providing the relief rally the administration may have sought.
Risk Disclaimer: This Daily FX Analysis is produced by Capital Street FX for informational purposes only and does not constitute investment advice or a solicitation to trade. Forex and CFD trading involves significant risk of loss and may not be suitable for all investors. Leverage can amplify both profits and losses. Past performance is not a reliable indicator of future results. Trade suggestions, entry points, take profit and stop loss levels are for illustrative purposes only and should not be acted upon without independent assessment and appropriate risk management. Geopolitical and macroeconomic analysis is based on publicly available information and is subject to rapid change. Capital Street FX accepts no liability for trading losses arising from this report. Data correct as of 23 February 2026.