Dollar Dominance as Tariff Day Arrives — Capital Street FX Daily Forex Report · March 4, 2026
Daily Forex Report · Updated 06:00 GMT
Dollar Dominance as Tariff Day Arrives: Complete Forex Intelligence on EUR/USD, GBP/USD, USD/JPY & AUD/USD

As 25% tariffs on Canada and Mexico take effect and China’s Two Sessions open in Beijing, currency markets are repricing global risk. This edition covers every major pair with precision trade levels, high-impact economic events, and the macro context every active trader needs for the next 24 hours.
Market Overview — 06:00 GMT, March 4, 2026
Breaking News — Last 10 Hours
| Time (GMT) | Headline | Primary Impact | Bias |
|---|---|---|---|
| 00:01 | US 25% tariffs on Canada & Mexico take effect; additional 10% on China (total 20%) officially active | CAD, MXN, CNH, USD, risk pairs | USD Bullish / Risk-Off |
| 01:20 | China’s Two Sessions (NPC/CPPCC) opens; GDP target ~5% for 2026; fiscal deficit target may rise to 4.0–4.5% | AUD/USD, CNH, global risk | Neutral-to-Supportive for CNH |
| 03:15 | Canada confirms retaliatory counter-tariffs; PM Carney signals “firm but measured” response | CAD, USD/CAD | CAD Bearish |
| 04:00 | Australia Q4 GDP +0.6% QoQ vs +0.5% expected — RBA May hike bets firmed | AUD/USD | AUD Mildly Bullish |
| 05:00 | Eurozone Final Services PMI (Feb): 50.6, in-line; composite 50.2 — barely in expansion | EUR/USD | Neutral / No Surprise |
| 05:40 | UK Final Services PMI (Feb): 51.0 vs 51.2 flash — marginal miss | GBP/USD, GBP crosses | GBP Slightly Bearish |
| 06:00 | BoJ Minutes (Jan meeting): members discussed “pace of future hike normalisation”; no immediate urgency | USD/JPY, JPY crosses | JPY Mildly Bearish (USD/JPY Bullish) |
Tariff Context: The midnight activation of 25% tariffs on Canadian and Mexican imports represents the most significant shift in US trade policy in decades. Markets had partially priced this in, but the confirmation with no last-minute reprieve has added a fresh leg to the dollar bid. Canadian dollar (USD/CAD) and Mexican peso (USD/MXN) have borne the sharpest selling, while the broader tariff narrative is sustaining demand for safe-haven assets including the yen, gold, and US Treasuries.
China NPC Context: The opening of China’s National People’s Congress in Beijing carries significant weight for Australian dollar traders. China is Australia’s largest export partner, and any government work report signalling increased fiscal spending or infrastructure stimulus would be a direct positive catalyst for AUD/USD. The market is watching for a fiscal deficit target of 4.0–4.5% of GDP, which would represent a meaningful expansion from last year. However, the additional 10% US tariff on China (now 20% total) places a cap on any CNH or AUD optimism until the trade situation clarifies.
Economic Calendar — March 4, 2026
| Time (GMT) | Country | Event | Impact | Forecast | Previous |
|---|---|---|---|---|---|
| 00:30 | 🇦🇺 Australia | GDP Growth Rate QoQ (Q4 2025) | HIGH | +0.5% | +0.3% (Actual: +0.6% ✓) |
| 00:30 | 🇦🇺 Australia | GDP Annual Rate (Q4 2025) | HIGH | +1.3% | +0.8% |
| 01:00 | 🇨🇳 China | NPC Two Sessions Opens — Government Work Report & 2026 GDP Target | HIGH | ~5% GDP Target | 5.0% (2025 target) |
| 01:45 | 🇨🇳 China | Caixin Services PMI (Feb) | HIGH | 51.8 | 51.4 |
| 09:00 | 🇪🇺 Eurozone | Retail Sales MoM (Jan) | MEDIUM | +0.4% | −0.2% |
| 09:30 | 🇬🇧 UK | Construction PMI (Feb) | MEDIUM | 49.0 | 48.1 |
| 13:30 | 🇺🇸 USA | Trade Balance (Jan) | HIGH | −$128.0B | −$98.4B |
| 15:00 | 🇺🇸 USA | ISM Services PMI (Feb) | HIGH | 52.6 | 52.8 |
| 15:00 | 🇺🇸 USA | Factory Orders MoM (Jan) | MEDIUM | +0.6% | −0.9% |
| All Day | 🇯🇵 Japan | BoJ Minutes (Jan Meeting) | HIGH | — | Hike 25bp (Dec 2025) |
Central Bank Snapshot
| Central Bank | Currency | Current Rate | Stance | Next Meeting | Market Expectation |
|---|---|---|---|---|---|
| Federal Reserve (Fed) | USD | 4.25–4.50% | Cautious Hold | Mar 19, 2026 | Hold; first cut priced June 2026 |
| European Central Bank (ECB) | EUR | 2.00% | Data-Driven Hold | Mar 6, 2026 | Hold; ~10bps easing priced for full year |
| Bank of England (BoE) | GBP | 4.25% | Cautious Easing | Mar 19, 2026 | Hold; 1–2 cuts possible in H2 2026 |
| Bank of Japan (BoJ) | JPY | 0.75% | Gradual Normalisation | Mar 19, 2026 | Hold; next hike Q2–Q3 2026 likely |
| Reserve Bank of Australia (RBA) | AUD | 4.10% | Hawkish Hold | Mar 17, 2026 | Hold; May hike bets firmed after GDP beat |
| People’s Bank of China (PBoC) | CNH | 3.00% (1Y LPR) | Accommodative | Mar 20, 2026 | Potential cut Q2 as tariff impact absorbs |
Six Key Risks for Today’s Session
4H Technical Analysis — Four Major Pairs
.jpg)
Broad uptrend since March 2025, multi-year high ~1.2000 in January 2026. Now in corrective phase, testing 1.1550–1.1620 support cluster (20-day MA + prior breakout). Medium-term structure remains bullish but near-term momentum has shifted bearish. Break below ascending trendline from October 2025 lows is a warning flag. Price must hold above 1.1550 to prevent further deterioration toward 1.1470 and potentially 1.1280 (200-day MA).
March 3 daily candle formed a bearish engulfing, erasing the prior session’s recovery. This followed two consecutive Doji candles at the 1.1780–1.1820 resistance zone — a classic trio signaling exhaustion at resistance. The sequence represents a high-probability reversal signal at the confluence of previous support-turned-resistance and descending 20 EMA on the 4-hour chart.
50 EMA (1.1690) has crossed below the 20 EMA (1.1720) — a confirmed bearish crossover. Price is trading below both. The 200 EMA on the 4H chart sits at 1.1480, providing a deeper target. RSI at 38 confirms bearish momentum without yet reaching oversold territory, leaving room for further decline.
.jpg)
Confluence of bearish pressure — UK unemployment at 4-year high 5.2%, wage growth at its lowest in four years, and the tariff-driven dollar bid combine to weaken cable. A descending channel has formed on the 4H chart since 1.3800 (late January) — series of lower highs and lower lows. The 1.3475 horizontal support has flipped to resistance. The weekly bullish flag pattern is under threat if GBP/USD closes below 1.3480 this week.
March 3 session produced a Shooting Star: attempted recovery to 1.3620, closed near 1.3545 — a classic upper shadow rejection. Below-average volume on the rally reinforces the weakness. The broader daily sequence since the January peak shows a Three Black Crows pattern (January 28–30), which remains in play until price closes above 1.3800.
Price is trading below the 20-day SMA (1.3620) and is now testing the 50-day SMA (1.3540). A daily close below the 50-day SMA would represent significant technical deterioration and likely accelerate selling. RSI at 42 shows bearish bias with no oversold bounce signal yet.
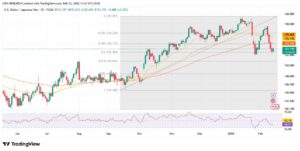
.jpg)
The USD/JPY is in a tug-of-war between competing forces: tariff risk-off flow generating yen safe-haven buying versus the tariff-driven USD bid. The net result is choppy range-bound trading between 148.00 and 152.00 since February. A series of doji and small-bodied candles reflects genuine market indecision. BoJ’s gradual normalisation path (0.75%, next hike expected Q2–Q3 2026) provides a medium-term JPY-bullish undercurrent. Intervention risk becomes live at 155.00–157.00.
A Doji Star formed on March 2 after a two-day decline from 152.00 resistance. This was followed by a Hammer on March 3, signaling tentative bullish reversal from the 149.50 support zone. The pattern needs confirmation — a strong bullish close above 151.20 today would validate the hammer and signal the next leg higher toward 151.80–152.00.
The 50-day SMA (150.80) acts as dynamic resistance overhead. The 200-day SMA at 152.40 represents the key medium-term target. On the 4H chart, price has rebounded from the lower Bollinger Band (148.90), with MACD showing a bullish crossover in negative territory. RSI at 51 is neutrally positioned — room to run in either direction.
.jpg)
Building a constructive base after testing the 200-day EMA near 0.6300–0.6320 in late February. Today’s Australia GDP beat (+0.6% QoQ) and firming RBA May hike expectations create fundamentally bullish conditions. However, China tariff escalation — where AUD is a well-known China proxy — provides strong headwinds. The pair is coiled in the 0.6280–0.6420 range. The medium-term weekly trend remains bullish (up from 0.5880 lows in early 2025). Needs a decisive break above 0.6420 to confirm the next leg higher.
March 3 formed a Spinning Top — small real body with long shadows in both directions, reflecting genuine indecision at the current level. The prior week displayed a Bullish Harami on the weekly chart at the 200-day EMA bounce zone — a supportive long-term signal. Tactically, await a clean breakout candle before committing directionally.
Price is oscillating around the 20-day SMA (0.6350). The 50-day SMA (0.6380) acts as near-term resistance. The 200-day EMA (0.6305) is the critical support floor — a sustained close below this level would be a significant bearish development. RSI at 50 — perfectly neutral, awaiting a catalyst.
24-Hour Trade Setup Summary
| Pair | Price | Bias | Key Pattern | Entry | Stop | Target 1 | Target 2 | R:R |
|---|---|---|---|---|---|---|---|---|
| EUR/USD | 1.1614 | Bearish | Bearish Engulfing | 1.1690–1.1720 | 1.1780 | 1.1550 | 1.1470 | 1:2.8 |
| GBP/USD | 1.3540 | Bearish | Shooting Star | 1.3590–1.3620 | 1.3680 | 1.3480 | 1.3335 | 1:1.8–4.3 |
| USD/JPY | 150.45 | Bullish | Hammer (unconfirmed) | 149.80–150.20 | 149.00 | 151.80 | 153.00 | 1:2.0–3.5 |
| AUD/USD | 0.6340 | Neutral / Range | Spinning Top | 0.6280–0.6310 | 0.6230 | 0.6380 | 0.6420 | 1:1.5–2.2 |
Market Themes & Risk Scenarios
| Theme | Current Status | FX Impact (Next 24H) | Probability |
|---|---|---|---|
| US Tariff Escalation | Active — 25% on CA/MX, 20% on China as of midnight | USD broadly bid; CAD, MXN, CNH under pressure; AUD/NZD risk-off selling | Confirmed / Ongoing |
| Fed Rate Cut Outlook | Two cuts priced for 2026; June seen as first move | Caps USD upside; every USD rally is a potential sell-the-rally scenario | High — 75%+ probability |
| BoJ Normalisation | 0.75% — gradualist path; Q2/Q3 hike expected | Medium-term JPY bullish; USD/JPY selling pressure on further BoJ signals | High — 70% probability |
| ECB March Decision (March 6) | Hold widely expected; ~10bps full-year pricing | EUR/USD likely to spike 40–60 pips on any surprise cut | Hold: 90% / Cut: 10% |
| China NPC Stimulus | GDP target ~5%; fiscal deficit 4.0–4.5% expected | AUD/NZD bullish on upside surprise; CNH stability supportive | Neutral-to-Positive; 60% |
| UK Labour Market Weakness | Unemployment at 4-year high 5.2%; wage growth softening | GBP underperformance vs EUR and USD; BoE more likely to cut in H2 | Confirmed / Persistent |
Trader FAQs
Conclusion
March 4, 2026 is a day when macro forces that have been building for months are finally colliding in real time. The activation of 25% US tariffs on Canada and Mexico — and the broadening to a 20% total levy on China — is the kind of event that doesn’t just move markets for a day; it reshapes the trade and growth outlook for the entire year. The dollar’s initial strength is logical: tariffs are inflationary, reducing the urgency for Fed rate cuts in the short term. But the medium-term picture is more complex, and the dollar is not in a true bull cycle — it is bouncing within a longer-term downtrend defined by the Fed’s inevitable easing cycle ahead.
EUR/USD and GBP/USD are both under pressure from a combination of USD strength and their own domestic vulnerabilities: a barely-expanding Eurozone services sector and a UK labour market at its worst in four years. These are not just technical setups — they are backed by genuine fundamental deterioration. The trades are valid, but holding through the ECB decision tomorrow requires experience and strict risk management.
USD/JPY is the pair that best illustrates the tensions of this market: it should be falling on safe-haven yen demand, and it should be rising on tariff-driven dollar strength. The result is deadlock, and the directional trigger will come from the data. ISM Services at 15:00 GMT is the pivot. AUD/USD meanwhile is a perfect barometer of the China/commodity trade: its failure to rally on a domestic GDP beat tells you everything you need to know about how deeply the tariff story has penetrated the market’s psyche.
The best approach today: trade what you see, not what you predict. The setups are clear, the levels are defined, and the catalysts are on the calendar. Be patient, wait for your entry zones, and reduce position sizes to account for the elevated volatility. The highest-quality traders in this environment will be defined by what they don’t trade as much as by what they do.