Dollar Surges as the Middle East Erupts — Complete Forex Battle Plan | March 3, 2026
Daily Forex Research · Volume 03 · March 2026
Dollar Surges as the Middle East Erupts:
Your Complete Forex Battle Plan

A comprehensive, data-driven breakdown of global FX markets for Tuesday, March 3, 2026 — covering macroeconomic fundamentals, economic calendar events, technical structure, and actionable trade setups across four major currency pairs.
Market Overview & Macro Context
Forex markets are navigating a turbulent confluence of geopolitical shock and macroeconomic data this Tuesday. The U.S. Dollar Index (DXY) surged approximately 1% on Monday to breach the 98.50 level — a five-week high — as “Operation Epic Fury,” the U.S.-led military operation involving strikes on Iran, ignited a classic risk-off flight to the greenback. Simultaneously, ISM Manufacturing data for February revealed a factory-gate price index racing to a near 3.5-year high, layering an inflationary dimension on top of geopolitical fear. The DXY is holding close to 98.49 into Tuesday’s open, keeping all G10 majors under meaningful pressure.
The Strait of Hormuz handles 20% of the world’s daily oil supply. When it enters the crosshairs of war, every trade you have open changes — immediately.
CSFX Research Desk · March 3, 2026Central Bank Landscape
The Federal Reserve remains firmly on hold at its March 18 meeting with a 97.5% probability priced by futures markets, despite mounting dovish sentiment earlier in the year. Traders had ramped up bets on a June cut following softer CPI, but the Middle East conflict and hot factory-gate prices have now created a stagflation-lite narrative that complicates the Fed’s path. Powell’s term ends May 2026, adding a layer of political uncertainty to Fed policy outlook.
The European Central Bank (ECB) is widely expected to hold at its March meeting, with markets pricing just over 1 basis point of easing for the full year. President Lagarde has signalled the ECB is data-dependent and in a “good place,” but eurozone PMI divergence vs. the U.S. is narrowing. The Bank of England faces a deteriorating jobs market, with UK unemployment climbing to 5.2% — a near 5-year high — weakening the pound’s fundamental footing. The Reserve Bank of New Zealand (RBNZ) continues its easing cycle, while the Bank of Canada (BoC) Governor Macklem’s speech is due Wednesday.
| Central Bank | Currency | Current Rate | Next Meeting | Bias |
|---|---|---|---|---|
| Federal Reserve (Fed) | USD | 4.25–4.50% | 18 Mar 2026 | On Hold |
| European Central Bank (ECB) | EUR | ~2.00% | Mar 2026 | Data-Dependent |
| Bank of England (BoE) | GBP | 4.50% | TBD | Easing Bias |
| Reserve Bank of New Zealand (RBNZ) | NZD | ~3.50% | TBD | Cutting Cycle |
| Bank of Canada (BoC) | CAD | ~3.25% | TBD | Watching Data |
| Bank of Japan (BoJ) | JPY | 0.50% | TBD | Tightening Bias |
| Reserve Bank of Australia (RBA) | AUD | ~4.00% | TBD | Cautious Hold |
| People’s Bank of China (PBoC) | CNY | 3.10% | Ongoing | Easing |
5 Critical Trading Cautions for Today
Geopolitical headlines can move EUR/USD 100–150 pips in seconds. A Trump post, an IRGC naval move, or a ceasefire rumour will trigger violent intraday spikes. Use at minimum 2× your normal stop distance today.
10:00 GMT Eurozone Flash CPI is the day’s primary data risk for EUR/USD. A hot print will further cement ECB hold expectations and could cap any Euro recovery, reinforcing the sell-on-bounce setup.
Oil direction is the master variable for USD/CAD, NZD/USD sentiment, and overall risk appetite today. Any formal Hormuz restriction announcement triggers an immediate re-assessment of all setups in this report.
Non-Farm Payrolls arrives Friday. Begin your scenario planning today. A sub-150K print in a wartime market could spark a violent Fed pivot trade. A strong print cements USD dominance for Q2.
The best trades of the next two weeks will emerge as the geopolitical picture clarifies. Traders who preserve capital during today’s volatility will be positioned to capitalise. Patience is a position.
The DXY is already at a 6-week high with 1%+ of gains baked in from Monday. Initiating short GBP/EUR at current levels chases the move. The setups in this report target entry on retracement, not at open.
High-Impact Economic Calendar
The week of March 2–8 is packed with tier-1 data that will continue to shape FX direction well beyond today’s session. The most critical release for Tuesday is the Eurozone preliminary CPI flash estimate. Globally, ISM Services PMI (Wednesday), Australia Q4 GDP (Wednesday), China NBS PMI (Wednesday), ADP employment (Wednesday), and the US Non-Farm Payrolls report on Friday are the marquee events of the week. The events below are the highest-impact releases over the next 24 hours.
| Time (GMT) | Country | Event | Previous | Forecast | Impact |
|---|---|---|---|---|---|
| 00:30 | 🇦🇺Australia | AiG Industry Index (Feb) | — | — | High |
| 01:00 | 🇨🇳China | Caixin Mfg PMI (Feb) | 52.3 | ~52.0 | High |
| 01:30 | 🇯🇵Japan | Consumer Confidence (Feb) | — | — | High |
| 07:00 | 🇬🇧UK | S&P Global/CIPS Construction PMI (Feb) | — | — | High |
| 10:00 | 🇪🇺Eurozone | Flash CPI Estimate (Feb) | 2.5% | ~2.3% | High |
| 10:00 | 🇪🇺Eurozone | Unemployment Rate (Jan) | — | — | High |
| 10:00 | 🇮🇹Italy | Unemployment Rate (Jan) | — | — | Medium |
| 13:30 | 🇺🇸USA | Trade Balance (Jan) — Goods & Services | — | — | High |
| Weds 00:30 | 🇦🇺Australia | Q4 GDP (QoQ) | — | — | High |
| Weds 01:00 | 🇨🇳China | NBS PMI Composite (Feb) | 52.0 | ~51.8 | High |
| Weds 07:30 | 🇨🇭Switzerland | CPI (Feb) | — | — | High |
| Weds 14:15 | 🇺🇸USA | ADP Employment Change (Feb) | +22K | ~+40K | High |
| Weds 15:00 | 🇺🇸USA | ISM Services PMI (Feb) | 52.8 | ~52.5 | High |
| Weds TBD | 🇨🇦Canada | BoC Governor Macklem Speech | — | — | High |
| Fri 13:30 | 🇺🇸USA | Non-Farm Payrolls (Feb) | — | — | High |
EUR/USD — Euro vs. US Dollar
Trend Analysis
EUR/USD is navigating a clearly deteriorating short-term trend following rejection from yearly peaks near 1.2100 in late January. The pair has been printing consistent lower highs since that rejection, and the recent safe-haven dollar surge triggered by the Middle East escalation has accelerated the decline. Price is now testing the critical 200-day Simple Moving Average (SMA) zone around 1.1660, a region that carries enormous technical weight given it represents the long-term mean. A decisive daily close below this level opens the door to a deeper correction.
On the medium-term picture, the EUR/USD medium-term trend remains bearish with no clear signs of downward momentum exhausting. The pair’s pivot point is assessed at 1.1770, and until buyers reclaim that level, the path of least resistance remains lower. The broader context is that while the ECB is effectively on hold, the Fed’s resilience against rapid rate cuts has maintained a rate-differential environment that keeps EUR under pressure. The pair also continues to react more to Washington DC geopolitics than eurozone fundamentals — a theme that will persist as long as Middle East tensions keep the safe-haven bid alive.
| Level Type | Price | Significance |
|---|---|---|
| Major Resistance | 1.2100 | Yearly high — January 2026 rejection zone |
| Key Resistance | 1.1795 | Sell Limit zone · RoboForex pivot |
| Pivot Point | 1.1770 | Medium-term reversal pivot |
| Current Price | 1.1670 | Six-week low area |
| Critical Support | 1.1660 | 200-day SMA — make-or-break level |
| Next Support | 1.1500 | Q4 2025 support — key structural floor |
| Deep Support | 1.1350 | Multi-year structural area |
Candlestick Patterns & Price Action
The recent daily candles on EUR/USD tell a distinctly bearish story. Monday’s session produced a sizeable bearish marubozu — a strong, full-bodied red candle with minimal wicks — confirming strong selling pressure and institutional distribution near the 1.1795 resistance area. This followed a bearish engulfing formation from last week, where a green session was wholly swallowed by a subsequent red candle, a reliable signal of trend continuation to the downside. The pair is currently testing the lower Bollinger Band on the daily chart, which historically has provided short-term relief; however, in a momentum-driven risk-off environment, such support often fails to hold. RSI is approaching oversold territory but has not yet triggered a reversal signal, meaning sellers retain control.
| Indicator | Reading | Signal |
|---|---|---|
| RSI (14) | ~38 | Trending Lower |
| MACD | Negative · Widening | Bearish |
| 50-day SMA | 1.1850 | Price Below |
| 200-day SMA | 1.1660 | Testing |
| Bollinger Bands | Lower Band Test | Watch |
| Market Sentiment (Retail) | 53% Bull / 47% Bear | Contrarian Bearish |
Trade Setup
The preferred strategy for EUR/USD is to sell rallies. The professional approach in this environment is not to chase the break lower but to wait for a pullback into the resistance zone and place a Sell Limit order. This aligns with the RoboForex trade idea structure of selling at 1.1795 with a risk-to-reward ratio exceeding 1:4.
GBP/USD — British Pound vs. US Dollar
Trend Analysis
The Cable (GBP/USD) is under significant pressure from a dual hammer: a strengthening US Dollar and a deteriorating UK economic backdrop. GBP/USD peaked near 1.3800 in late January 2026 and has since formed a clear pattern of lower highs — a textbook bearish structure. The pair has dropped to the 1.3400–1.3430 zone, a critical area that previously served as resistance in Q4 2025 and is now attempting to hold as support. This is a genuine inflection point. A confirmed breakdown below 1.3400 would signal the next leg lower. A bounce, on the other hand, would need to reclaim 1.3550 to become technically meaningful.
The UK labour market data released last week added fuel to the bearish fire — ILO Unemployment climbed to 5.2% (the highest since early 2021), jobless claims rose 28.8K in January, and annual wage growth moderated to a near 4-year low. These readings increase the likelihood that the Bank of England will accelerate its easing trajectory, which is intrinsically GBP-negative. Retail trader sentiment shows 65.92% long, which from a contrarian standpoint actually reinforces the bearish case — the crowd is already long and vulnerable to further liquidation.
| Level Type | Price | Significance |
|---|---|---|
| Major Resistance | 1.3800 | January 2026 peak — sellers loaded here |
| Key Resistance | 1.3550 | Short-term bearish trend line |
| Current Price | 1.3430 | One-week low · Tested as support |
| Critical Support | 1.3400 | Former Q4 2025 resistance — now support |
| Next Support | 1.3250 | Monthly S1 pivot / deeper structural level |
Candlestick Patterns & Price Action
GBP/USD is showing a two-day consecutive bearish drift following the UK labour data release. Monday’s daily candle formed a long-legged bearish spinning top near the 1.3500 area, quickly resolving lower as the USD safe-haven bid intensified. The current candle is probing the 1.3400–1.3430 support — a gravestone doji or bearish pin bar at this level on the daily timeframe would be a high-conviction signal to add to short positions. The four-hour chart reveals a series of lower highs and lower lows since late January — the pair is firmly entrenched in a short-term bearish channel. The 50-period EMA on the 4H is crossing below the 200-period EMA (a “death cross” on the 4H), adding confluence to the downside bias.
| Indicator | Reading | Signal |
|---|---|---|
| RSI (14, Daily) | ~40 | Bearish Momentum |
| MACD (Daily) | Below signal line | Bearish |
| 4H EMA Cross | EMA50 < EMA200 | Death Cross |
| Retail Sentiment | 65.9% Long | Contrarian Bearish |
| J.P. Morgan Target | 1.3900 | Medium-term bull target |
Trade Setup
NZD/USD — New Zealand Dollar vs. US Dollar
Trend Analysis
NZD/USD is at a genuinely interesting juncture. On the larger timeframes (weekly), the pair remains in a developing uptrend — it rallied impressively from the 0.57 area and reached the 0.60 psychological zone, forming what TradingView analysts describe as a solid impulsive structure with healthy corrective pullbacks respecting higher lows. However, the short-term (4H/daily) picture has turned more cautious: the pair was rejected at 0.6015 — a strong structural resistance area — and is now pulling back toward the 0.5980–0.5950 support confluence, which is the key zone to watch today.
Critically for the Kiwi, Wednesday’s China NBS PMI and Caixin PMI data are enormously important. Since China is New Zealand’s largest trade partner, any deterioration in Chinese economic data directly undermines NZD demand. The RBNZ’s ongoing easing cycle also limits NZD’s upside — with the cash rate at approximately 3.50% and the bank in cutting mode, rate-differential dynamics are working against the Kiwi medium term. Institutional forecasts (NAB, Westpac) cluster NZD/USD at 0.60–0.63 by year-end 2026, but near-term the risk remains tilted lower amid the USD safe-haven surge.
| Level Type | Price | Significance |
|---|---|---|
| Key Resistance | 0.6060 | Wave analysis resistance target |
| Resistance | 0.6015 | Strong rejection zone — 4H high |
| Pivot / Target | 0.6063 | Fibonacci pivot point |
| Current Price | 0.5934 | Post-rejection pullback |
| Key Support | 0.5980 | Buy opportunity zone — trend support |
| Support | 0.5950 | Prior demand area |
| Deep Support | 0.5850 | Monthly S1 pivot |
Candlestick Patterns & Price Action
NZD/USD recently formed a bearish evening star pattern on the daily chart near the 0.6015 resistance — a classic three-candle reversal signal (bullish candle, indecisive doji, bearish candle) that warned of a pullback from premium resistance. The current candle is forming what could become a hammer or bullish pin bar if price reverses from the 0.5950–0.5980 support zone, which would confirm a buy-the-dip opportunity within the broader uptrend. The RSI sits at approximately 62 on the daily, still in bullish territory, and all moving averages (MA5 through MA200) are showing Buy signals on Investing.com’s technical summary. However, the 4H timeframe shows bearish pressure building with the MACD negative and momentum weakening from the 0.6015 rejection.
| Indicator | Reading | Signal |
|---|---|---|
| RSI (14, Daily) | 62.1 | Bullish Zone |
| MACD | +0.001 | Buy |
| MA5 (Daily) | 0.6062 | Buy |
| MA50 | 0.6047 | Buy |
| Investing.com Summary | Strong Buy (Daily) | 12 Buy / 0 Sell |
| TradingView (4H/1H) | Strong Buy | Strong Buy |
Trade Setup
The higher-probability trade here is to buy the pullback into the 0.5980–0.5950 support zone, targeting a continuation of the medium-term uptrend. This is a trend-following long aligned with the weekly structure and institutional year-end targets of 0.60–0.63. The risk is that broader USD safe-haven strength extends the correction deeper.
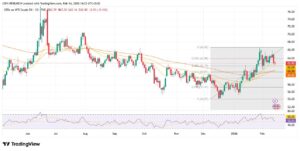
USD/CAD — US Dollar vs. Canadian Dollar
Trend Analysis
USD/CAD presents the most nuanced picture among our four pairs today. The pair has been drifting within a descending channel since the March 2026 highs near 1.412, and is currently trading around 1.3678 — significantly below the yearly high. The broader trend bias is bearish (USD weakening versus CAD), with the SMA50 trading below the SMA200, confirming medium-term selling pressure on USD/CAD. However, the current geopolitical backdrop introduces an important counterforce: rising oil prices (Brent +7.1% Monday) structurally benefit Canada as a major oil exporter, which should support the CAD and push USD/CAD lower. This creates a convergence of technical and fundamental downward pressure on the pair.
The Bank of Canada’s Governor Macklem is speaking on Wednesday — any dovish signals from Macklem would weaken the CAD (pushing USD/CAD higher) while a more hawkish or neutral tone would support the Loonie (pushing USD/CAD lower). The MACD on USD/CAD is signalling a local recovery with weak momentum, suggesting the pair may attempt a relief bounce toward the upper boundary of the descending channel before resuming lower. The key level to watch is 1.35 to the downside (LiteFinance key support) and the upper channel boundary near 1.3800–1.3900 as resistance.
| Level Type | Price | Significance |
|---|---|---|
| Yearly High | 1.4120 | March 2026 yearly peak |
| Channel Upper Boundary | 1.3800–1.3900 | Descending channel resistance |
| Key Resistance | 1.3765 | Near-term ceiling — Scotiabank level |
| Current Price | 1.3678 | Mid-channel position |
| Key Support | 1.3500 | Strong base — LiteFinance support zone |
| Deep Support | 1.3150–1.3520 | LongForecast May–June range |
Candlestick Patterns & Price Action
USD/CAD’s recent daily chart is showing hesitation. After a brief USD rally attempt last week (a bullish marubozu on Thursday), Monday produced a long-legged doji — an indecision candle — as the market grappled with two opposing forces: Middle East-driven safe-haven USD buying versus oil-driven CAD strength. This doji-following-rally pattern is a classic bearish warning sign (the evening star precursor) within the broader descending channel. If today’s candle closes as a bearish engulfing below 1.3700, it would confirm a re-test of the 1.3500 zone is likely. The MACD local recovery signal is weak, indicating any bounce is likely corrective rather than a full trend reversal.
| Indicator | Reading | Signal |
|---|---|---|
| SMA50 vs SMA200 | SMA50 < SMA200 | Bearish Cross |
| MACD | Local recovery, weak | Cautious |
| Channel Structure | Descending Channel | Sell Rallies |
| Oil Correlation | Brent +7.1% | CAD Supportive |
| Scotiabank 2026 View | Drifting lower | Multi-year Bearish |
Trade Setup
The primary strategy for USD/CAD is to sell rallies toward the upper channel boundary. The base strategy is to trade within the descending channel with a preference for selling near resistance. The oil price surge is a tailwind for CAD, and the BoC Macklem speech on Wednesday adds event-risk potential for further CAD strength (USD/CAD lower). Range trading within the channel is also viable for experienced traders.
Frequently Asked Questions
Strategic Scenarios for the Week Ahead
Four plausible trajectories for the market over the next 5 trading days, mapped to specific outcomes for the pairs covered in this report.
Iran Threatens Strait of Hormuz Closure
DXY spikes toward 100. EUR/USD breaks 1.1600 support. GBP/USD tests 1.3250. Oil surges toward $90+. Gold toward $5,500. NZD/USD pressured below 0.5880. USD/CAD whipsaw as oil-CAD rivalry intensifies.
Geopolitical Tension Stabilises, Data Takes Over
DXY consolidates 97.80–98.80. EUR/USD bounces from 200-SMA toward 1.1790. GBP/USD stabilises 1.3380–1.3490. NFP Friday becomes the week’s pivotal event. Trade setups in this report remain valid.
Ceasefire / De-escalation Headlines
Risk-on surge. EUR/USD breaks 1.1820. GBP/USD reclaims 1.3600. DXY retreats to 97.00. Gold profit-taking toward $5,150. Oil gives back war premium. NZD/USD bull case activated above 0.6060.
War + Weak NFP = Fed Policy Paralysis
If Friday NFP prints below +120K alongside sustained oil above $80, the Fed faces a stagflation trap. USD could paradoxically sell off on paralysis fears. EUR/USD and GBP/USD see sharp short-covering. Gold to $5,400+.
Conclusion & 24-Hour Outlook
Tuesday, March 3, 2026 opens with forex markets firmly in risk-off mode. The Middle East escalation — specifically Iran’s threat to close the Strait of Hormuz following “Operation Epic Fury” — has delivered a seismic shock to global risk appetite, validating the USD’s role as the world’s premier safe-haven currency. The DXY near 98.49 is a five-week high, and the technical structure suggests the greenback has further room to run as long as geopolitical uncertainty persists and the Fed remains on hold (97.5% probability).
For EUR/USD, the critical battle is at the 200-day SMA around 1.1660 — a decisive close below here opens deeper downside. GBP/USD is testing the 1.3400–1.3430 support with a deteriorating UK labour backdrop providing justification for further sterling weakness. NZD/USD remains in a medium-term uptrend but requires China PMI confirmation on Wednesday to sustain any bounce from the 0.5950–0.5980 support zone. USD/CAD is caught between safe-haven USD demand and oil-driven CAD strength — the descending channel structure and rising crude prices ultimately favour a move lower over the coming sessions.
| Pair | Current | Bias (24H) | Key Support | Key Resistance | Setup | Catalyst |
|---|---|---|---|---|---|---|
| EUR/USD | 1.1670 | Bearish | 1.1660 | 1.1795 | Sell rallies to 1.1790–1.1800 | Eurozone CPI (10:00 GMT) |
| GBP/USD | 1.3430 | Bearish | 1.3400 | 1.3550 | Sell bounces to 1.3490–1.3520 | UK Construction PMI + DXY |
| NZD/USD | 0.5934 | Cautious Long | 0.5950 | 0.6015 | Buy dips at 0.5950–0.5980 | China PMI (Wed) |
| USD/CAD | 1.3678 | Cautious Short | 1.3500 | 1.3800 | Sell rallies to 1.3750–1.3800 | BoC Macklem + Oil |
The macro picture for March 2026 remains complex: the U.S. Supreme Court’s earlier ruling against broad IEEPA tariffs has injected additional policy uncertainty, a 10% temporary import surcharge effective February 24 continues to cloud the inflation outlook, and Jerome Powell’s term ending in May adds political risk to the Fed policy path. Active traders should maintain disciplined risk management, keep position sizes appropriate to this elevated volatility regime, and treat any sudden geopolitical headline — especially those related to the Strait of Hormuz — as a potential gap-risk event.
Stay sharp, trade the setup — not the opinion. The market rewards preparation, not prediction.