Forex Market Analysis — February 26, 2026 | EUR/USD · GBP/USD · USD/JPY · AUD/USD Trade Setups
Dollar Under Pressure as Trump’s SOTU Disappoints
and Fed Doves Gain Ground
The US dollar is slipping as markets digest a State of the Union address that failed to offer fresh economic catalysts, while Australia’s hotter-than-expected January CPI firms the RBA’s hawkish hand. The yen holds near 156 ahead of BoJ guidance, and GBP/USD climbs above 1.3500. Here is everything you need to navigate the next 24 hours.
The dominant theme heading into Thursday’s session is a broadly softer US dollar. Markets parsed President Trump’s State of the Union address on Tuesday and found little to shift the macro narrative — tariff rhetoric was already priced in, and the speech offered no surprise policy acceleration. With markets now pricing in three Fed rate cuts in 2026 (June, September, and December), the interest-rate differential that long underpinned greenback strength continues to erode.
Fed Governor Bowman has held the funds rate at 3.50–3.75% and continues to signal data dependency. A speech from Bowman today at approximately 3:00 pm GMT could generate volatility if she tips her hand on how the Fed is balancing sticky services inflation (core PCE near 3%) against a labour market that is beginning to show cracks — unemployment ticked down to 4.3% last reading but the broader trend is softening.
Across the Pacific, Australia’s January CPI came in at 3.8% YoY, unchanged from December but above the 3.7% consensus. Critically, trimmed mean CPI rose to 3.4%, eclipsing both the prior and the forecast. The RBA recently hiked by 25 bps, reversing its August cut, and this data fuels expectations of further tightening — supporting the AUD. In Japan, the Bank of Japan is expected to raise rates approximately twice annually through 2026–2027, with former governor Kuroda suggesting ¥157 per dollar represents an excessive level of weakness, keeping JPY appreciation on the agenda.
In Europe, the euro area saw annual inflation confirmed at 1.7% in January — below the ECB’s 2% target — but Germany’s landmark €1 trillion fiscal expansion package continues to anchor EUR upside potential. The ECB has paused its easing cycle, standing in contrast to the still-cutting Fed.
| Time (GMT) | Country | Event | Impact | Previous | Forecast | Actual | FX Implication |
|---|---|---|---|---|---|---|---|
| 00:30 | 🇦🇺 Australia | CPI YoY (Jan 2026) ✓ | HIGH | 3.8% | 3.7% | 3.8% | AUD bullish — beat expectations |
| 00:30 | 🇦🇺 Australia | CPI Trimmed Mean YoY ✓ | HIGH | 3.3% | 3.3% | 3.4% | Reinforces RBA hike expectations |
| 00:30 | 🇦🇺 Australia | Private Capital Expenditure (Q4) | MED | — | — | Pending | Secondary driver for AUD |
| 07:00 | 🇪🇺 Eurozone | HICP Revisions (Jan 2026) | MED | 1.7% | 1.7% | Pending | Confirms ECB steady stance; mild EUR impact |
| 09:30 | 🇬🇧 UK | Mortgage Approvals / Credit Data | MED | — | — | Pending | Watch for BoE dovish fuel |
| 13:30 | 🇺🇸 USA | Durable Goods Orders (Jan) | HIGH | — | — | Pending | Key USD catalyst. Weak = more USD selling |
| 15:00 | 🇺🇸 USA | Fed Governor Bowman Speech | HIGH | — | — | Pending | Major USD swing catalyst — hawkish vs dovish tone |
| 15:00 | 🇺🇸 USA | CB Consumer Confidence (Feb) | HIGH | — | — | Pending | Signals consumer health amid tariff uncertainty |
| Tomorrow | 🇬🇧 UK | GDP (Q4 2025, Final) | HIGH | 0.3% q/q | 0.3% q/q | Pending | Crucial for BoE rate-cut timing; GBP sensitive |
| Tomorrow | 🇪🇺 Eurozone | GDP (Q4 2025, Revised) | HIGH | 0.3% q/q | — | Pending | Confirms recovery trajectory; EUR medium impact |
| Tomorrow | 🇯🇵 Japan | Tokyo CPI (Feb 2026) | HIGH | — | — | Pending | Leads national CPI; JPY strengthening catalyst if hot |
| Tomorrow | 🇺🇸 USA | Core PCE Price Index (Jan) | HIGH | ~3.0% | — | Pending | The Fed’s preferred inflation gauge — biggest weekly catalyst |
| Indicator | Value / Signal | Interpretation |
|---|---|---|
| Daily Trend | Bullish | Pair has been rising since Jan 13 reversal; series of higher lows |
| 50-Day SMA | ~1.1650 | Price is well above — confirms medium-term bullish structure |
| 200-Day SMA | ~1.1200 | Far below price — long-term uptrend from 2025 lows intact |
| RSI (14, Daily) | ~58–62 | Momentum positive but not overbought; room to extend gains |
| MACD (Daily) | Bullish Cross | Signal line below MACD; histogram expanding — buy pressure |
| Candlestick Pattern | Falling Wedge Breakout | Bullish reversal pattern resolved to upside this week |
| COT Positioning | Specs net-long (trimmed) | Large specs reduced longs slightly — less crowded, healthy |
| Key Support 1 | 1.1750 | Swing low and prior resistance flipped support |
| Key Support 2 | 1.1500 | Major structural support — bear case trigger only on close below |
| Key Resistance 1 | 1.1850 | Weekly range top — multiple rejections; needs clean break |
| Key Resistance 2 | 1.2000 | Psychological level and consensus year-end target |
EUR/USD has been steadily climbing since the January 13th reversal and is currently consolidating just below the key 1.1850 resistance. A falling wedge formation — a classically bullish reversal structure — resolved to the upside this week. The current pullback-and-hold at 1.1790–1.1800 is textbook post-breakout retest behaviour. As long as the pair holds above 1.1750, the path of least resistance remains upward. The ECB’s pause contrasting with Fed cut expectations, combined with Germany’s fiscal expansion narrative, provides structural tailwinds.
Candlestick Watch: Traders should watch for a Bullish Engulfing or Morning Star pattern on the H4 chart around 1.1790–1.1800 as a high-conviction buy signal. On the flip side, a Bearish Pin Bar or Shooting Star at 1.1855–1.1880 would confirm the range top and set up a short to 1.1750.
| Indicator | Value / Signal | Interpretation |
|---|---|---|
| Daily Trend | Bullish | Cable showing strongest trending capacity among major USD pairs |
| 2026 Range | 1.3347 – 1.3867 | Current price near mid-upper range — breakout watch above 1.3600 |
| 50-Day SMA | ~1.3320 | Well below price; strong separation confirms trend |
| RSI (14, Daily) | ~60–65 | Momentum constructive — not overbought |
| MACD (Daily) | Bullish | Histogram positive and expanding after minor dip mid-week |
| Candlestick Pattern | Falling Wedge (resolved) | Bullish reversal pattern mirrors EUR/USD — confirms USD weakness theme |
| Key Support 1 | 1.3414 | Fibonacci retracement level — first line of defence for bulls |
| Key Support 2 | 1.3347–1.3371 | Important structural zone; breakdown here would shift bias neutral |
| Key Resistance 1 | 1.3550 | Immediate resistance; need clean daily close above to extend rally |
| Key Resistance 2 | 1.3867 | 2026 high — major target for bulls on sustained USD weakness |
GBP/USD is arguably the cleanest trend trade in the majors right now. The pair has printed a series of higher highs and higher lows since mid-January and reached near 42-day highs on Wednesday as the dollar weakened in the wake of Trump’s State of the Union address. Cable is currently the strongest G10 currency vs the USD this week, which is notable given that UK economic data has been somewhat mixed — the pound is riding the USD weakness trade more than any UK-specific catalyst.
UK GDP tomorrow (Thursday, Q4 2025 final) is a pivotal event. A confirmation of 0.3% q/q growth would be neutral-to-mildly supportive. A downside miss could briefly pressure GBP and give bears a window. However, any UK-driven weakness is likely to be a buying opportunity as long as the broader USD downtrend remains intact. Candlestick cue: A Three White Soldiers or Marubozu bullish candle on the daily close through 1.3550 would be a very strong signal.
| Indicator | Value / Signal | Interpretation |
|---|---|---|
| Daily Trend | Range / Cautious | Consolidating between 152–158; no decisive breakout yet |
| Current Range | 152 – 158 | Former MOF official flagged 157 as “too weak for JPY” |
| 50-Day SMA | ~155.50 | Price slightly above — bullish near-term but range compression |
| RSI (14, Daily) | ~50–52 | Neutral — balanced between bulls and bears |
| MACD (Daily) | Flat / Mixed | Histogram near zero; no clear directional signal |
| Candlestick Pattern | Doji / Indecision | Multiple doji and small-body candles near 156 — market undecided |
| Intervention Risk | ELEVATED at 157+ | MoF/BoJ monitoring; ¥157 flagged as intervention threshold |
| Key Support 1 | 155.00 | Major psychological support; BoJ intervention less likely below here |
| Key Support 2 | 154.45 – 154.84 | Fibonacci cluster; previous swing highs as support |
| Key Resistance 1 | 156.27 | Immediate resistance; next upside target on break |
| Key Resistance 2 | 158.00 – 158.90 | Upper range cap; intervention territory |
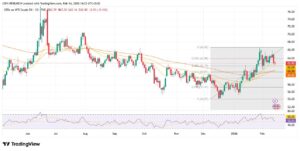
USD/JPY is the most complex trade in today’s landscape. The pair is caught between two major forces: residual USD strength from carry trade dynamics and elevated US rates, and the BoJ’s credible normalisation path that is steadily narrowing the yield differential. Former BoJ governor Kuroda’s comment that ¥157 per dollar is “somewhat too weak” is the key level to monitor — above this, intervention risk rises sharply.
The near-term path depends heavily on tomorrow’s Tokyo CPI and the longer-term direction hinges on the US Core PCE report (also tomorrow). Hot Tokyo CPI → yen buying → push toward 155. Soft Core PCE → dollar selling → same directional result. On the daily chart, the candlestick action near 156 has produced a series of Doji and Spinning Top candles — a textbook indecision pattern that often precedes a trend resolution. Experienced traders should wait for a clean break and close below 155 or above 157 before committing to a position.
| Indicator | Value / Signal | Interpretation |
|---|---|---|
| Daily Trend | Bullish | Strong uptrend; pair has broken above multi-month downtrend resistance |
| 2026 High | 0.7147 (Feb 12) | Key bull target; recovery above here opens 2023 high at 0.7157 |
| 2026 Low | 0.6663 (Jan 9) | Bear case invalidation — only relevant on catastrophic risk-off |
| RSI (14, Daily) | >62 | Positive momentum confirmed; ADX near 43 signals strong trend |
| 50-Day SMA | ~0.6821 | Price significantly above — confirms strong bullish structure |
| 200-Day SMA | ~0.6605 | Long-term support — very far below current levels |
| Candlestick Pattern | Bullish Continuation | Prior session formed wide-legged doji above key support — possible swing low |
| Fundamental Driver | RBA HAWKISH | Jan CPI 3.8% (beat) + trimmed mean 3.4% → more hikes expected |
| Key Support 1 | 0.7020 – 0.7040 | Post-CPI floor; buyers expected on dips to this area |
| Key Support 2 | 0.6897 | February low — major support; break would significantly weaken bull case |
| Key Resistance 1 | 0.7100 – 0.7110 | Immediate resistance; round number psychological level |
| Key Resistance 2 | 0.7147 – 0.7157 | 2026 high then 2023 ceiling — very significant bull target |
AUD/USD is the cleanest fundamental play today. Australia’s January CPI beat (3.8% YoY, trimmed mean 3.4%) has solidified the RBA’s hawkish tilt — the central bank already reversed its August cut by hiking 25 bps and is now actively warning of further tightening. This stark contrast with the dovish Fed path makes AUD/USD a compelling buy-on-dips candidate.
Technically, the pair has broken above a multi-month downtrend resistance line and RSI is sustaining above 62 with ADX near 43 — both hallmarks of a strong, trending market. The preferred pattern to look for on entry is a Bullish Hammer or Bullish Engulfing on the H4 chart on any retrace to 0.7040–0.7060. The road to 0.7147 and potentially 0.7157 (2023 ceiling) is increasingly well-supported. Watch iron ore prices as a secondary confirmation signal — a rally in iron ore typically correlates with AUD strength.
| Pair | Price | Trend | Pattern | Bias | Buy Entry | Buy Target | Buy SL | Sell Entry | Sell Target | Sell SL |
|---|---|---|---|---|---|---|---|---|---|---|
| EUR/USD | 1.1818 | Bullish | Falling Wedge ↑ | BUY DIPS | 1.1790 | 1.1850 / 1.1950 | 1.1740 | 1.1860 | 1.1790 | 1.1910 |
| GBP/USD | 1.3510 | Bullish | Higher Highs ↑ | BUY DIPS | 1.3480 | 1.3550 / 1.3650 | 1.3420 | 1.3555 | 1.3480 | 1.3620 |
| USD/JPY | 156.10 | Neutral | Doji / Indecision | SELL RALLIES | 155.50 | 156.50 / 157.20 | 154.90 | 156.80 | 155.80 | 157.70 |
| AUD/USD | 0.7077 | Bullish | Breakout + Doji | BUY DIPS | 0.7040 | 0.7100 / 0.7147 | 0.6990 | 0.7115 | 0.7060 | 0.7175 |
Today’s forex landscape is defined by one dominant theme: a softening US dollar intersecting with sharply diverging central bank paths. Three of our four focus pairs — EUR/USD, GBP/USD, and AUD/USD — are biased to the upside, supported by the structural USD downtrend and hawkish non-US central banks. USD/JPY is the outlier, held in check by a credible BoJ tightening path and elevated intervention risk above 157.
The immediate catalyst is Bowman’s speech. A hawkish surprise would temporarily squeeze USD shorts — experienced traders should treat any sharp USD bounce as a recalibration opportunity rather than a trend change, unless Core PCE tomorrow also surprises to the upside. Stay patient, respect your stops, and let the setups come to you.