Forex Market Analysis — February 27, 2026 | EUR/USD · GBP/USD · USD/JPY · AUD/USD
Forex Market Analysis
February 27, 2026
A complete institutional-grade breakdown of today’s forex market — fundamentals, economic calendar, technical setups, and executable trade ideas for the four major currency pairs.
Live Market Snapshot
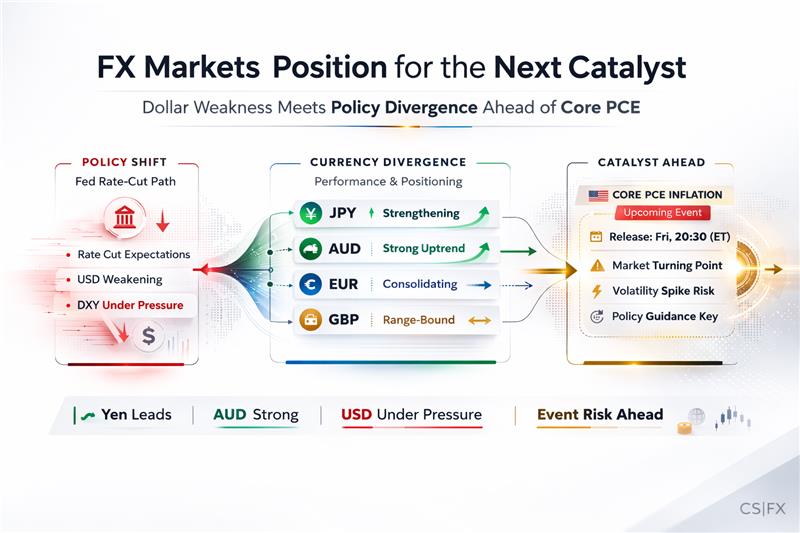
Prices and directional bias as of the European session, February 27, 2026. The US dollar remains under structural pressure. The Japanese yen is today’s strongest performer, boosted by BoJ rate hike speculation and fresh verbal intervention from Japan’s Finance Ministry.
| Index / Asset | Level | Change | Note |
|---|---|---|---|
| DXY (USD Index) | ~98.10 | −0.20% | Below 50-day EMA; structurally weak |
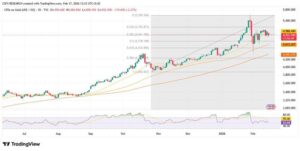
| Gold (XAU/USD) | ~$5,175 | +0.25% | Near $5,200 resistance; safe-haven bid |
| US 10Y Yield | ~4.42% | Slight dip | PCE data key today |
| S&P 500 Futures | ~6,870 | Flat | Consolidating 6,800–7,000 range |
Fundamental Market Overview
🇺🇸 United States — Dollar Under Structural Pressure
The US dollar continues its structural downtrend as markets price two Federal Reserve rate cuts in 2026, with roughly a 60% probability attached to the March meeting. Today’s Core PCE — the Fed’s preferred inflation metric — is forecast at 2.8% YoY and is the single biggest catalyst of the day. Q4 2025 GDP came in at 1.4% annualized (weaker than Q3’s 4.4%), while private domestic final purchases grew a respectable 2.4%. Fed Governor Waller noted this week that tariff effects have been smaller than feared, but PCE remains meaningfully above the 2% target. Chairman Powell’s term expires in May 2026, adding an institutional wildcard to USD positioning.
🇪🇺 Eurozone — ECB Steady, CPI Data In Focus
The ECB maintained its gradual approach following President Lagarde’s balanced-risk commentary. Markets price just 7 basis points of easing by year-end with a hold expected at the March 19 meeting. Today’s flash CPI from Germany, France, and Spain serve as the primary EUR catalyst. Germany — the Eurozone’s largest economy — is forecast at 2.1–2.2% headline CPI with core near 2.4%, reflecting persistent services and wage pressures. Speculative net long EUR positions climbed to approximately 174,500 contracts on the CFTC — the highest since September — signaling strong institutional conviction in EUR upside.
🇬🇧 United Kingdom — Political Uncertainty Caps GBP
Cable faces compounding headwinds. The Green Party’s landmark by-election victory in Gorton and Denton underscores the fragmentation of UK politics and fiscal unpredictability. Meanwhile, the Bank of England — with its cash rate at 3.75% — is expected to cut as early as March. GfK Consumer Confidence is also out today. The combination of easing monetary policy and political noise makes GBP the weakest major currency among today’s four pairs against the USD.
🇯🇵 Japan — BoJ Hikes, Intervention Language Explicit
Japan’s Finance Minister Katayama stated this morning that the government is watching yen weakness “with a strong sense of urgency” — the most explicit verbal intervention warning in months. The Bank of Japan hiked rates to a 30-year high in December 2025 and markets increasingly price further tightening. Today’s Tokyo CPI serves as a leading inflation indicator ahead of the national release. USD/JPY is range-bound between 152 and 158 with 160 representing the Ministry of Finance’s effective red line for potential physical FX intervention.
🇦🇺 Australia — RBA Hiking, AUD Near 3-Year Highs
The Reserve Bank of Australia hiked rates to 3.85% earlier in 2026, becoming the first major developed-market central bank to resume tightening. January CPI printed at 3.8% YoY — above the 3.7% consensus — while trimmed mean CPI edged to 3.4%, a fourth consecutive month above the 2–3% target band. Markets price an 80% probability of another 25bp hike in May (pushing the cash rate to 4.10%). AUD/USD is near three-year highs around 0.71, supported by a widening 60bp AU-US 2-year yield spread and broad USD structural weakness.
Economic Calendar — February 27, 2026
High and medium impact events due today from the US, Eurozone, UK, and Japan. All times approximate (GMT). The US PCE at 13:30 GMT is the dominant risk event for the session.
| Time (GMT) | Currency | Event | Forecast | Previous | Impact |
|---|---|---|---|---|---|
| 00:30 | 🇯🇵 JPY | Tokyo CPI (Feb, YoY) | 3.1% | 3.4% | High |
| 00:30 | 🇯🇵 JPY | Japan Industrial Production (Jan, Prelim) | +0.5% | −0.2% | Med |
| 07:00 | 🇩🇪 EUR | Germany CPI Prelim (Feb, YoY) | 2.1–2.2% | 2.1% | High |
| 07:00 | 🇩🇪 EUR | Germany Unemployment Rate (Feb) | 6.2% | 6.2% | Med |
| 07:45 | 🇫🇷 EUR | France CPI Prelim (Feb, YoY) | 0.2–0.3% | 0.8% | Med |
| 07:45 | 🇫🇷 EUR | France GDP Q4 Final (QoQ) | 0.1% | 0.4% | Med |
| 09:30 | 🇬🇧 GBP | UK GfK Consumer Confidence (Feb) | −21 | −22 | Med |
| 09:30 | 🇬🇧 GBP | UK Nationwide Housing Prices (Feb, MoM) | +0.3% | +0.2% | Med |
| 10:00 | 🇪🇸 EUR | Spain CPI Prelim (Feb, YoY) | 2.3% | 2.3% | Med |
| 13:30 | 🇺🇸 USD | US Core PCE Price Index (Jan, YoY) ★ | 2.8% | 2.8% | High |
| 13:30 | 🇺🇸 USD | US Personal Income (Jan, MoM) | +0.4% | +0.4% | High |
| 13:30 | 🇺🇸 USD | US Personal Spending (Jan, MoM) | +0.5% | −0.5% | High |
| 15:00 | 🇺🇸 USD | UoM Consumer Sentiment Final (Feb) | 67.8 | 67.8 | Med |
Technical Analysis & Trade Setups
Each pair includes trend analysis across multiple timeframes, identified candlestick patterns, full support/resistance mapping, indicator readings, and a concrete executable trade setup for the next 24 hours.
Trend & Structure
EUR/USD is in a long-term uptrend after rallying 13.7% in 2025, driven by structural USD weakness. The pair is in a corrective phase after testing the 1.1904 target — pulling back to retest the 1.1758–1.1725 support zone before bouncing to 1.1811 today. The monthly opening range is defined between 1.1746 (low) and 1.1918 (high). A breakout of this band — in either direction — will dictate the next directional leg. The broader bullish structure remains intact above 1.1598 (monthly close support).
| Level | Price |
|---|---|
| Resistance R3 | 1.2082 |
| Resistance R2 (Key) | 1.2020 |
| Resistance R1 | 1.1917–1.1918 |
| Current Price | 1.1811 |
| Support S1 | 1.1766–1.1779 |
| Support S2 (Pivotal) | 1.1746–1.1725 |
| Support S3 | 1.1598 |
| Bullish Invalidation | 1.1491 |
| Indicator | Reading |
|---|---|
| 50-day SMA | ~1.1780 (Support) |
| 200-day SMA | ~1.1600 (Base) |
| MACD | Mild bullish crossover |
| RSI (14) | ~52 — Neutral |
| Bollinger Bands | Mid-band, not extended |
| Momentum | Recovering from correction |
Candlestick Patterns
Hammer at S2 (Daily) Inside Bar consolidation (4H) Bullish Engulfing at 1.1725
A hammer candle printed at the lower support zone (1.1725–1.1746), indicating buyer absorption after the corrective move. The current 4H series shows tight inside bars — classic pre-event compression ahead of US PCE. A break above 1.1850 with volume would confirm resumption of the uptrend.
Trend & Structure
GBP/USD is oscillating around the pivotal 1.3500 level — a price that has proven both resistance and support across 2025. While the broader trend from 2025’s lows remains bullish (+7.7%), the pair has repeatedly failed to sustain above 1.3500, forming a de facto ceiling. The 200-day moving average near 1.3414 is the key structural support. Fundamental headwinds from BoE easing expectations and UK political instability create asymmetric downside risk in the near term.
| Level | Price |
|---|---|
| Resistance R2 | 1.3650 |
| Resistance R1 | 1.3600 |
| Current Price | 1.3503 |
| Support S1 (Psychological) | 1.3500 |
| Support S2 / 200-day SMA | 1.3414–1.3371 |
| Support S3 (Swing Low) | 1.3312 |
| Bearish Invalidation | Close above 1.3600 |
| Indicator | Reading |
|---|---|
| 200-day SMA | ~1.3414 (Support) |
| 50-day SMA | ~1.3480 (Overhead) |
| MACD | Slightly negative |
| RSI (14) | ~44 — Below midpoint |
| Stochastic | Oversold bounce attempt |
| ATR (14) | ~70 pips/day |
Candlestick Patterns
Doji at 1.3500 (Daily) Evening Star Formation (4H) Bearish Engulfing at 1.3540
The daily chart shows a doji at the 1.3500 handle, representing indecision at a critical level. The 4H chart formed an evening star pattern near 1.3540 mid-week — a three-candle bearish reversal signal. Price is now testing back at 1.3500; failure here opens a path toward 1.3414.
Trend & Structure
USD/JPY is range-bound between 152 and 158, consolidating after 2025’s JPY weakness trend. Today’s pullback to 155.78 reflects BoJ rate hike expectations (supported by Tokyo CPI data) and explicit verbal intervention from Finance Minister Katayama. The 20-day EMA at 155.20 is the critical bull/bear dividing line today. Below it opens 154.00 and then 152.27. The 160 level is the Ministry of Finance’s red line — physical intervention becomes increasingly likely on any approach to that level.
| Level | Price |
|---|---|
| Gov’t Red Line / R3 | 160.00 |
| Resistance R2 | 159.20–159.45 |
| Resistance R1 (Feb High) | 157.66 |
| Current Price | 155.78 |
| Support S1 / 20-day EMA | 155.20 |
| Support S2 (Feb 23 Low) | 154.00 |
| Support S3 (Swing Low) | 152.27 |
| Range Floor | 152.00 |
| Indicator | Reading |
|---|---|
| 20-day EMA | 155.20 (Key) |
| 50-day SMA | ~155.80 (At price) |
| MACD | Turning negative |
| RSI (14) | ~48 — Neutral |
| ATR (14) | ~90 pips/day |
| JP-US Rate Spread | Narrowing → JPY supportive |
Candlestick Patterns
Bearish Shooting Star at 157.66 (Daily) Three Black Crows (4H) Pin Bar at 20-day EMA
The shooting star at the February high of 157.66 was the clearest bearish reversal signal of the week. The 4H chart confirms with a three black crows pattern — three consecutive bearish candles indicating sustained selling pressure. Price now tests the 20-day EMA; a rejection here would accelerate the decline toward 154.00.
Trend & Structure
AUD/USD is the strongest performer today, trading near three-year highs above 0.71. The fundamental backdrop is compelling: the RBA has hiked to 3.85% and markets price a further 25bp hike in May, while the Fed is easing — creating a widening rate differential that structurally favors AUD. All three major SMAs (55-day, 100-day, 200-day) are rising and price is above all of them — a textbook uptrend configuration. ADX above 40 confirms the trend is strong, not fatigued. The 2023 cycle high of 0.7175 is the next major target.
| Level | Price |
|---|---|
| Resistance R3 | 0.7300 |
| Resistance R2 (2023 High) | 0.7175 |
| Resistance R1 | 0.7150 |
| Current Price | 0.7108 |
| Support S1 (Psychological) | 0.7000 |
| Support S2 (Feb Swing) | 0.6960 |
| Bullish Invalidation | Daily close below 0.6900 |
| Indicator | Reading |
|---|---|
| 55-day SMA | Rising — below price |
| 100-day SMA | Rising — below price |
| 200-day SMA | Rising — strong base |
| RSI (14) | ~65 — Bullish |
| ADX (14) | >40 — Strongly trending |
| Geopolitical risk | Limiting upside (Iran talks) |
Candlestick Patterns
Bullish Outside Day (Daily) Rising Three Methods (Weekly) Hammer at 0.7000 Support
The weekly chart shows a rising three methods pattern — a bullish continuation signal within the established uptrend. The daily bullish outside bar that respected the 0.7000 psychological support and 20-day SMA confirmed the medium-term bullish structure. Geopolitical risk from US-Iran talks is the primary factor preventing a more explosive break above 0.7115.
Frequently Asked Questions
Conclusion & 24-Hour Outlook
Today’s forex market sits at the confluence of three dominant themes: a structurally weakening US dollar, historically significant central bank policy divergence across major economies, and the binary risk event of US Core PCE at 13:30 GMT. The next 24 hours will be shaped primarily by whether PCE confirms or challenges the market’s current Fed easing expectations.
The overarching macro narrative remains USD-bearish. With the Fed 175 basis points into an easing cycle, the ECB on hold, the RBA hiking, and the BoJ tightening for the first time in three decades, the interest rate differential is structurally unfavorable for the dollar across all four pairs covered today. This theme is likely to persist through Q2 2026 absent a major upside inflation shock.
Among the four pairs, AUD/USD presents the cleanest alignment of fundamental catalyst, technical structure, and institutional momentum — making it the editor’s pick for the 24-hour window. EUR/USD offers the second-best setup on a soft PCE outcome. GBP/USD is a sell-rallies candidate given domestic headwinds. USD/JPY is best faded on rallies with careful risk management given intervention risk on both sides of the trade.