Forex Market Analysis – March 2, 2026 | EUR/USD, GBP/USD, USD/JPY, AUD/USD Trade Setups
Forex Market Analysis
& Trade Intelligence
A comprehensive daily briefing for active forex traders — covering geopolitical risk, economic data, technical structure, and actionable trade setups across the four major currency pairs.
📋 In This Report
- Executive Summary & Market Overview
- Macro Context: Geopolitical Risk & Central Bank Divergence
- Economic Calendar — High-Impact Events (2 March 2026)
- EUR/USD — Technical Analysis & Trade Setup
- GBP/USD — Technical Analysis & Trade Setup
- USD/JPY — Technical Analysis & Trade Setup
- AUD/USD — Technical Analysis & Trade Setup
- Market Sentiment & COT Positioning
- Frequently Asked Questions
- Conclusion & Outlook for the Next 24 Hours
Executive Summary & Market Snapshot
Today’s One-Paragraph Brief
Monday’s forex session opens in a distinctly risk-off tone following the weekend’s US-Israeli military strikes on Iran and the Iranian navy’s partial blockade of the Strait of Hormuz. The dollar is finding safe-haven support, which is capping EUR/USD near the key 55-day SMA at 1.1770, creating near-term headwinds for the pair. GBP/USD, despite pulling back from recent 42-day highs above 1.38, retains bullish structural integrity provided 1.3641 holds. USD/JPY is under pressure below 150.50 as yen strength is typically accelerated by risk-off environments and the Bank of Japan’s ongoing policy normalisation. AUD/USD faces the stiffest challenge — its impressive 6-week winning streak hits a wall of risk aversion and multi-year technical resistance simultaneously. The week’s headline data includes global Manufacturing PMI releases today, followed by US ADP employment Wednesday and the critical Non-Farm Payrolls print on Friday. Experienced traders should treat this as a high-alert session and size positions conservatively until the geopolitical picture stabilises.
Macro Context: Geopolitical Risk & Central Bank Divergence
The forex market enters the first week of March 2026 navigating two dominant forces simultaneously: acute geopolitical shock from the Middle East and the gradual but structurally significant monetary policy divergence between the world’s major central banks. Understanding both is essential to correctly framing today’s price action.
The joint US-Israeli military operation against Iran, launched over the weekend, has materially repriced risk across asset classes. With the Strait of Hormuz seeing severely restricted traffic — a waterway through which over 10% of global crude oil supply passes — energy markets are already responding. Oil markets have broken to 6-month highs, gold is testing the $5,300 handle, and the dollar is benefiting from its traditional safe-haven role. Crucially, risk-sensitive currencies like the Australian dollar face headwinds, while the Japanese yen is seeing defensive inflows despite the Bank of Japan’s higher rate environment.
On the monetary policy front, the landscape remains decisively divergent heading into March. The Federal Reserve has held its target range at 3.50%–3.75%, with markets now pricing only two 25bp cuts in 2026, pushed out toward June following hotter-than-expected PPI data in January. The ECB’s deposit rate sits at 2.00% after eight successive cuts, with Lagarde declaring policy to be “in a good place” — suggesting a pause. The Bank of England has delivered multiple cuts but faces persistent inflation pressures and a softening labour market (unemployment at 5.2%, its highest since 2021). The Bank of Japan stands apart — its path is one of normalisation and rate hikes, a structural yen-supportive force that investors are increasingly pricing in. The Reserve Bank of Australia held rates steady amid an Australian CPI surprise to the upside in January (3.8% YoY), reducing immediate pressure for further easing.
| Central Bank | Current Rate | Bias | Next Meeting | FX Impact |
|---|---|---|---|---|
| Federal Reserve (Fed) | 3.50–3.75% | On Hold | March 17–18 | Mildly USD bearish longer-term |
| European Central Bank (ECB) | 2.00% | Pause | March (TBD) | EUR neutral; fiscal support helps |
| Bank of England (BoE) | ~4.25% | 1–2 more cuts | March (TBD) | Mild GBP headwind |
| Bank of Japan (BoJ) | ~0.50% | Hiking Cycle | March (TBD) | Structurally JPY bullish |
| Reserve Bank of Australia (RBA) | ~4.10% | Cautious Hold | March (TBD) | AUD neutral; data-dependent |
| People’s Bank of China (PBoC) | ~3.00% | Easing Bias | Monthly | CNY weakness; AUD secondary risk |
Economic Calendar — High-Impact Events: 2–6 March 2026
This is an exceptionally busy week for macro data. Monday kicks off with the full suite of global Manufacturing PMI releases, giving traders a real-time read on factory sector health across all major economies. The week builds toward Friday’s US Non-Farm Payrolls — arguably the single most influential recurring forex event. Below are the highest-impact events for the countries that matter most to the four pairs we track today.
| Date / Time (GMT) | Country | Event | Impact | Forecast | Previous | FX Implication |
|---|---|---|---|---|---|---|
| Mon 2 Mar · 15:00 | 🇺🇸 USA | ISM Manufacturing PMI (Feb) | 🔴 HIGH | 52.5 | 52.6 | Beat = USD↑; Miss = USD↓ |
| Mon 2 Mar · 01:45 | 🇨🇳 China | Caixin Manufacturing PMI (Feb) | 🟠 MED | 50.3 | 50.1 | AUD & CNH sensitive; Risk proxy |
| Mon 2 Mar · 09:00 | 🇪🇺 Europe | Eurozone Manufacturing PMI Final (Feb) | 🟠 MED | 48.3 | 47.6 | EUR/USD directional confirmation |
| Mon 2 Mar · 09:30 | 🇬🇧 UK | S&P Global/CIPS Manufacturing PMI Final (Feb) | 🟠 MED | 46.4 | 45.3 | GBP volatility spike on deviation |
| Mon 2 Mar · 23:30 | 🇯🇵 Japan | Consumer Confidence (Feb) | 🟢 LOW | 36.5 | 35.8 | JPY secondary signal |
| Mon 2 Mar · 00:30 | 🇦🇺 Australia | AiG Industry Index (Feb) | 🟢 LOW | — | — | AUD/USD early direction |
| Wed 4 Mar · 13:15 | 🇺🇸 USA | ADP Employment Change (Feb) | 🔴 HIGH | 145K | 183K | NFP preview; USD directional |
| Wed 4 Mar · 10:00 | 🇪🇺 Europe | Eurozone Unemployment (Jan) | 🔴 HIGH | 6.2% | 6.3% | EUR/USD support or weakness |
| Wed 4 Mar · 09:00 | 🇪🇺 Europe | Eurozone GDP Final Q4 (est.) — Italy/Germany | 🟠 MED | 0.1% | 0.3% | Euro zone growth signal |
| Thu 5 Mar · 09:30 | 🇬🇧 UK | S&P Global/CIPS Services PMI (Feb) | 🟠 MED | 51.2 | 50.8 | GBP/USD direction this week |
| Thu 5 Mar · 00:30 | 🇦🇺 Australia | GDP Q4 2025 | 🔴 HIGH | 0.4% QoQ | 0.3% QoQ | AUD/USD major mover Thursday |
| Fri 6 Mar · 13:30 | 🇺🇸 USA | Non-Farm Payrolls (Feb) | 🔴 HIGH | 170K | — | Week’s biggest mover — all pairs |
| Fri 6 Mar · 13:30 | 🇺🇸 USA | Unemployment Rate (Feb) | 🔴 HIGH | 4.1% | — | Fed rate cut expectations driver |
| Fri 6 Mar · Various | 🇪🇺 Europe | Eurozone GDP Q4 Final (3rd est.) | 🟠 MED | 0.1% | 0.3% | EUR confirmation / revision risk |
* All times are approximate GMT. Always verify with your broker’s economic calendar. ISM Manufacturing PMI is today’s primary market mover — due at 15:00 GMT (10:00 AM EST).
EUR/USD — Technical Analysis & Trade Setup
EUR/USD
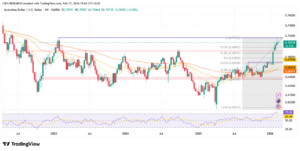
EUR/USD concluded Friday’s session near 1.1815 before pulling back in early Monday trade to the 1.1777 level — right at the provisional 55-day SMA. This is a technically significant area. The broader trend from late 2024 has been bullish, with the pair having staged an impressive 12.9% rally in 2025, but the current price action reflects a correction phase. The pair has been unable to build meaningful momentum above 1.1815–1.1825, and the reinvigorated DXY — now retargeting resistance near 98.00 — is applying downward pressure. The monthly floor at 1.1740 is the primary support bulls must defend today.
| Pattern | Location | Signal | Reliability |
|---|---|---|---|
| Shooting Star | Near 1.1815 resistance (prior week) | Bearish reversal signal; exhaustion of bulls | Medium-High |
| Inside Bar / Doji | Monday consolidation near 55-day SMA | Indecision — wait for direction | Medium |
| Support Retest | 1.1740–1.1725 zone (200-day SMA area) | Potential bounce trigger if reached | High (historically defended) |
| Indicator | Reading | Signal |
|---|---|---|
| RSI (14) | ~48–50 | Neutral; cooling from overbought |
| MACD | Cross lower | Bearish cross forming below signal line |
| 55-Day SMA | 1.1770 | Currently testing as support |
| 200-Day SMA | 1.1740 | Major support — bulls must hold |
| Bollinger Bands | Contracting | Squeeze; breakout incoming |
Trigger: ISM Manufacturing PMI beats 52.5 → DXY lift. Enter short on retest of 1.1810 zone. Close above 1.1860 invalidates. Confirm with 1H bearish close.
Trigger: Price reaches 200-day SMA at 1.1740 with bullish pin bar confirmation. Only enter if ISM misses expectations. This is the lower-probability setup today.
GBP/USD — Technical Analysis & Trade Setup
GBP/USD (Cable)
GBP/USD is in a confirmed medium-to-long term uptrend, having broken decisively above the key 1.3787 resistance (2025 highs) and reaching a recent peak at 1.3867 — a 42-day high. The current pullback appears corrective in nature rather than a trend reversal. The pair has showed an impressive multi-week advance from January lows, with buyers consistently defending dips. A bullish flag-like pattern has formed on the larger time frame, technically suggesting continuation toward the 100% projection target at 1.3901 and ultimately the 1.4246–1.4284 structural resistance zone (2021 highs area). The main risk to bulls today is a deteriorating UK labour market — unemployment climbed to 5.2% in January — and the BoE’s easing path.
| Pattern | Location | Signal | Reliability |
|---|---|---|---|
| Bullish Flag Breakout | Larger weekly timeframe | Trend continuation structure; measured target 1.4246 | High |
| Shooting Star / Temp Top | 1.3867 — recent peak | Minor exhaustion; normal before continuation | Medium |
| Higher Low Setup | 1.3719 daily pivot support | Buy the dip opportunity if price reaches S1 with bullish candle | Medium-High |
| Indicator | Reading | Signal |
|---|---|---|
| RSI (14) | ~58–62 | Bullish territory, not yet overbought |
| 50-Day SMA | ~1.3567 | Price well above — strong bullish buffer |
| Daily Pivot (P) | 1.3794 | Current price above pivot — mild bullish bias today |
| Daily R1 | 1.3923 | Next target if 1.3867 breaks |
| MACD | Above signal | Bullish momentum maintaining |
Enter on London session pullback to 1.3750–1.3780 with a bullish engulfing or pin bar on 1H. Structure remains bullish provided 1.3641 holds. Move SL to breakeven once T1 hit.
Only valid if UK Manufacturing PMI misses badly and pair spikes to 1.3867–1.3890, then reverses. Lower probability trade given bull structure. Require bearish hourly close below 1.3850 to confirm.
USD/JPY — Technical Analysis & Trade Setup
USD/JPY
USD/JPY is approaching a decisive inflection point. After grinding higher from the April 2025 lows near 140.00, the pair ran into stiff resistance around 151–155, a zone that the Bank of Japan has historically monitored for intervention signals. The current risk-off environment following the US-Iran conflict is generating a dual headwind for the pair: the yen is attracting safe-haven inflows while the dollar’s traditional safe-haven bid is partially offset by USD weakness expectations from the Fed’s easing trajectory. The BoJ’s ongoing rate normalisation — a structural shift from decades of ultra-loose policy — provides a fundamental basis for yen strength. Q1 2026 range forecast from analysts sits at 151–155, with year-end targets of 146–148.
| Pattern | Location | Signal | Reliability |
|---|---|---|---|
| Doji / Small Body | Weekly level near 150.45–151.00 | Indecision at resistance; potential reversal brewing | Medium |
| Bearish Engulfing Risk | If ISM beats and USD surges, watch for rejection at 152 | Would signal selling pressure from resistance | Medium-High |
| Bullish Pin Bar | 150.00 round-number support | Potential bounce trigger for short-term longs | Medium |
| Indicator | Reading | Signal |
|---|---|---|
| RSI (14) | ~48 | Neutral; approaching oversold if falls to 149 |
| Weekly RSI | Bearish divergence | Momentum fading at resistance — warns of reversal |
| 200-Week MA | ~144 | Major long-term floor; far below current price |
| 150.00 Level | Psychological | Critical round number — breach = accelerated selling |
| Rising Channel | From Apr 2025 | Showing signs of weakening structure |
Sell rallies into 151.00–151.50 resistance. BoJ normalisation + risk-off environment = dual JPY tailwinds. Avoid holding through ISM data without stops. Break below 150.00 accelerates the move.
Lower probability. Only valid on strong ISM beat (USD surge) + risk-on reversal. Require bullish pin bar at 150.00 on 1H chart. Geopolitical risk makes this difficult to hold — tight position sizing essential.
AUD/USD — Technical Analysis & Trade Setup
AUD/USD
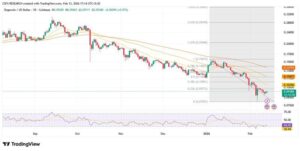
AUD/USD has delivered one of the most impressive recoveries among G10 pairs in early 2026, reclaiming ground steadily since the January lows with buyers defending every dip. The pair has been in a persistent uptrend for 6 consecutive weeks, carrying price back toward multi-year highs and above multi-month downtrend resistance. However, the pair now confronts a formidable ceiling — technical resistance at multi-year highs — at the same time as a significant geopolitical risk-off shock weighs on risk appetite. The AUD, as a commodity currency with deep China trade ties, is doubly exposed: to global risk sentiment and to Chinese demand signals. The Caixin Manufacturing PMI release early Monday will be an important first signal. Australia’s own Q4 GDP print on Thursday could be a significant catalyst.
| Pattern | Location | Signal | Reliability |
|---|---|---|---|
| Wide-Legged Doji | Near recent highs (last 2–3 sessions) | Indecision; market uncertain at resistance | Medium |
| Bearish Engulfing Risk | 0.6400–0.6420 resistance zone | Risk-off could trigger a clean reversal candle | Medium-High today |
| Bullish Pin Bar (potential) | 0.6300 round support | Bounce trigger if sentiment recovers | Medium |
| Indicator | Reading | Signal |
|---|---|---|
| RSI (14) | ~60 | Elevated but not overbought — momentum intact but slowing |
| COT Report (Asset Managers) | Net Long (flip to bullish) | Institutional bias positive; but may be crowded |
| Multi-Year Resistance | 0.6420–0.6450 | Major historical ceiling; risk of hard rejection |
| October High (prior) | 0.6617 | Medium-term target if current resistance clears |
| AiG Industry Index | Due Mon AM | Early session catalyst — watch for surprise |
Highest probability setup given dual headwinds (risk-off + technical resistance). Trigger: Bearish reversal candle at 0.6395–0.6420 on 1H or 4H chart. A weak Caixin PMI would strengthen this setup further.
Valid only if risk sentiment recovers (oil stabilises, geopolitical de-escalation signals). Wait for bullish pin bar at 0.6300. Australia Q4 GDP Thursday could be a major positive catalyst if it beats 0.4% forecast.
Market Sentiment & COT Positioning
The Commitment of Traders (COT) data from the CFTC offers a valuable window into how institutional and speculative traders are positioned — and therefore where potential reversals or continuations may arise. The most recent data reveals a structurally USD-bearish positioning at extremes not seen since March 2021.
| Market | Net Position (Large Speculators) | Trend | Crowding Risk | Implication |
|---|---|---|---|---|
| USD (DXY) | -$22.8B net short | Most bearish since Mar 2021 | Extreme | Risk of short squeeze if USD catalyst emerges |
| EUR/USD | Net long (trimming) | Longs cut by 5.8k contracts | Elevated | Long unwind possible; pair vulnerable to drops |
| GBP/USD | Net long — holding | Consistent buying | Medium | Bullish positioning supporting structure |
| USD/JPY (JPY futures) | JPY pullback limited | Potential yen pullback capped | Low-Med | USD/JPY upside remains capped; shorts building |
| AUD/USD | Asset Mgrs: Flipped net long | Most bullish since Oct 2017 | High | Sentiment extreme; consolidation or pullback likely before next leg up |
The key takeaway from COT data today: the extreme bearish USD positioning means any positive USD catalyst — such as a strong ISM print or geopolitical safe-haven demand — could trigger an outsized short-covering rally in the dollar, which would simultaneously pressure EUR/USD, GBP/USD, and AUD/USD lower. This is the primary tail risk active traders should be hedging against this session.
Frequently Asked Questions
Conclusion & Outlook for the Next 24 Hours
The Bottom Line for Active Traders — March 2, 2026
March opens with the market navigating the most significant geopolitical shock of the year so far. The US-Israeli strikes on Iran and the partial Hormuz blockade are not just oil market events — they reshape the entire risk appetite framework that underpins forex positioning. Safe-havens are bid. Risk currencies face headwinds. The USD is experiencing a tug-of-war between its structural bearish trend (extreme short positioning) and its short-term safe-haven role.
For the next 24 hours, the priority intelligence hierarchy is clear: watch ISM Manufacturing PMI at 15:00 GMT first. A beat strengthens the USD and validates short setups in EUR/USD (1.1810–1.1820) and AUD/USD (0.6395–0.6420). A miss reopens the door for euro and cable bulls, with GBP/USD the most structurally sound long. USD/JPY should be approached from the short side on any rally into 151.00–151.50, regardless of the ISM outcome, given the BoJ normalisation backdrop and risk-off environment. AUD/USD remains the most vulnerable pair in the current environment — the 6-week winning streak faces its most serious test. A clean bullish candle on 4H confirming a bounce at 0.6300 would be needed to justify fresh longs.
By end of week, the Non-Farm Payrolls print will set the macro tone for March and beyond. Stay disciplined, trade the setups, manage your risk — and let price confirm before you commit.
| Pair | 24-Hour Bias | Key Level to Watch | Primary Setup | Week Outlook |
|---|---|---|---|---|
| EUR/USD | Neutral-Bearish | 1.1740 (200-day SMA) | Sell 1.1810–1.1820 on ISM beat | Choppy; range 1.1700–1.1860 |
| GBP/USD | Bullish | 1.3641 (must hold) | Buy dips 1.3750–1.3780 | Target 1.3901 by week-end |
| USD/JPY | Bearish | 150.00 (key psychological) | Sell 151.00–151.50 rallies | Risk of 148.65 test by week-end |
| AUD/USD | Neutral-Bearish | 0.6300 (round support) | Short rejection at 0.6395–0.6420 | GDP Thu key; 0.6250–0.6420 range |