Forex Market Analysis — March 27, 2026 | EUR/USD · GBP/USD · USD/JPY · AUD/USD | Capital Street FX
Forex Market Analysis:
End-of-Quarter Session
PCE inflation, UK Retail Sales, Iran deadline extension and quarter-end flows converge to define today’s price action across all four major pairs.
Macro & Geopolitical Backdrop
The forex market on Friday, 27 March 2026 is navigating its most complex macro-political cocktail of the year so far. Three forces are in direct tension: (1) quarter-end position squaring that routinely amplifies intraday moves, (2) today’s dual data releases — US Core PCE and UK Retail Sales — and (3) the ongoing Iran crisis, which continues to underpin safe-haven flows into the US dollar and Japanese yen.
President Trump extended the deadline for strikes on Iranian energy infrastructure to 6 April 2026, describing negotiations as progressing “very well.” However, Wall Street closed sharply lower on Thursday despite the announcement, underscoring that markets remain deeply sceptical of a near-term diplomatic resolution. Brent crude is trading above $97–98 per barrel. This energy shock is structurally negative for euro and sterling (energy importers) while adding complexity to yen dynamics — Japan is the world’s largest net oil importer, creating a cross-current between yen safe-haven demand and yen weakness from energy costs.
From a monetary policy standpoint, Fed rate cut expectations have been entirely priced out for 2026. The January Core PCE reading came in at +0.4% MoM and +3.1% YoY — the hottest reading in nearly two years — keeping the Fed firmly on hold. Today’s February PCE reading is the week’s pivotal catalyst. A repeat or upside surprise would further entrench USD strength. The February CPI print (already released March 11) was in line at 2.4% YoY, which the market interpreted as “calm before the storm” given the energy shock impact that will only show up in March data.
Today is the final trading day of Q1 2026. Institutional rebalancing flows can create sharp, counter-trend moves across major pairs in the 2–4 PM London Fix window. Active traders should avoid chasing breakouts in the final two hours of the European session and position size conservatively around the Fix.
High-Impact Economic Calendar — March 27, 2026
All times are GMT. Only high-impact events from the USA, UK, Japan, Australia, Eurozone and China are included.
| Time (GMT) | Country | Event | Impact | Forecast | Previous | FX Implication |
|---|---|---|---|---|---|---|
| 07:00 | 🇬🇧 UK | Retail Sales MoM (Feb) | HIGH | −0.8% | +1.8% | Beat = GBP relief. Miss = GBP/USD tests 1.3250 |
| 07:00 | 🇬🇧 UK | Retail Sales YoY (Feb) | MED | +2.1% | +4.0% | Confirms consumer resilience narrative |
| 12:30 | 🇺🇸 USA | Core PCE Price Index MoM (Feb) | HIGH ★★★ | +0.3% | +0.4% | Hot print = USD up, EUR/GBP/AUD down sharply |
| 12:30 | 🇺🇸 USA | Core PCE Price Index YoY (Feb) | HIGH ★★★ | +2.9% | +3.1% | Key Fed gauge — above 3.0% = hawkish repricing |
| 12:30 | 🇺🇸 USA | Personal Income MoM (Feb) | MED | +0.4% | +0.9% | Supports consumption outlook |
| 12:30 | 🇺🇸 USA | Personal Spending MoM (Feb) | MED | +0.5% | −0.2% | Rebound expected; beat = USD positive |
| 14:00 | 🇺🇸 USA | Michigan Consumer Sentiment (Mar Final) | MED | 57.0 | 57.9 | Geopolitical anxiety weighing on sentiment |
| 14:00 | 🇺🇸 USA | Michigan 5-Year Inflation Expectations | HIGH | 4.1% | 3.9% | Rising long-run expectations = hawkish for Fed |
| Overnight | 🇯🇵 Japan | Tokyo CPI YoY (Mar) | HIGH | +2.5% | +2.9% | Above 2.5% = JPY strength; BoJ normalisation |
| Overnight | 🇨🇳 China | Industrial Profits YoY (Feb) | MED | N/A | +11.9% | Positive = risk appetite, AUD/USD supportive |
Note: UK Retail Sales (Feb) was already released this morning at −0.4% MoM, beating the −0.8% forecast — a mild GBP positive that is being partially offset by broader USD safe-haven demand. The US PCE data at 12:30 GMT remains the defining event for the remainder of the session.
Technical Analysis — Four Major Pairs

Trend & Structure
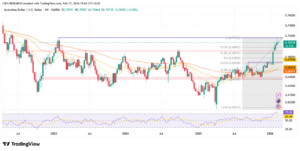
EUR/USD is in a confirmed descending channel on the daily timeframe since peaking at the 1.0 Fibonacci level near 1.20912 in late January. The pair has made a sequence of lower highs and lower lows through February and March. Current price at 1.15187 is trading just above the 0.236 Fibonacci retracement at 1.15315 — a level that has acted as dynamic support and is under active test today. The 200-day moving average is well above current price, confirming the intermediate-term downtrend. The descending channel’s lower bound lies near 1.1400–1.1408, which aligns with the 0 Fibonacci extension and represents the bear case target.
Fibonacci Levels
| Level | Price | Significance | Status |
|---|---|---|---|
| 1.000 (Swing High) | 1.20912 | Major resistance / origin of move | Far above — Abandoned |
| 0.786 Retracement | 1.18902 | Key Fibonacci resistance | Below — acts as resistance |
| 0.618 Retracement | 1.17313 | Secondary resistance band | Below — confluence with MA |
| 0.500 Retracement | 1.16696 | Mid-range equilibrium | Below price structure |
| 0.382 Retracement | 1.16079 | Near-term resistance on rally | Immediate resistance |
| 0.236 Retracement | 1.15315 | Active support under test | CURRENT BATTLEGROUND |
| 0.000 (Swing Low) | 1.14080 | Bear target / cycle low | Key downside target |
Candlestick Patterns (Daily)
Thursday’s daily candle on EUR/USD printed a bearish continuation candle — a near-full body red close with the lower wick barely testing the 0.236 level at 1.15315. No reversal pattern is visible. The absence of a bullish engulfing or hammer at this support level keeps the sell bias intact. If today’s session closes below 1.15187, the candle will likely form a bearish close below key support, opening the 1.1408–1.1434 target zone.
Trade Setups

Trend & Structure
GBP/USD has been in a clear downtrend since its January 2026 peak near 1.37858 (0.786 Fibonacci). The pair has now retraced to the 0 extension at 1.32021 zone, with current price at 1.33046 sitting just above this critical level. The pair has closed in negative territory for three consecutive days, and the descending channel is intact. The 0.238 Fibonacci retracement at 1.33368 is now acting as resistance overhead. UK Retail Sales printed a beat this morning (−0.4% vs −0.8% expected), which caused a brief bounce but failed to trigger any meaningful bullish follow-through — a bearish signal in itself.
Fibonacci Levels
| Level | Price | Significance | Status |
|---|---|---|---|
| 0.786 Retracement | 1.37172 | Swing high / origin of decline | Far above — abandoned |
| 0.618 Retracement | 1.36071 | Fibonacci resistance | Below — overhead resistance |
| 0.500 Retracement | 1.35298 | Midpoint equilibrium | Capped rallies in Feb |
| 0.382 Retracement | 1.34525 | Near-term resistance | Rejected multiple times |
| 0.238 Retracement | 1.33368 | Immediate resistance | ACTIVE RESISTANCE |
| 0.000 Extension | 1.32021 | Bear target / base of range | Key downside target |
Candlestick Patterns (Daily)
GBP/USD has formed a three-candle bearish sequence — a pattern of persistent selling pressure with no meaningful bullish rejection wicks at support. Today’s early candle shows a doji-like indecision near the 1.3300 handle, which is notable: if this level fails to attract buyers by the US close, the sequence evolves into a clean break below the 0 Fibonacci and opens the 1.3150–1.3200 zone. The BoE’s shift in tone (from rate cuts toward potential hikes) is providing a floor, but it’s not enough to fight USD safe-haven flows.
Trade Setups

Trend & Structure
USD/JPY has completed a full Fibonacci recovery from its January–February swing low near 152.12 (1.0 extension), trading back above the 0 extension at 159.94 which aligns with the widely-watched 160.00 intervention threshold. Current price at 159.865 is pressing toward this level, with the BoJ and Japanese Finance Ministry historically treating 160.00 as a line-in-the-sand requiring verbal or physical intervention. The ascending channel from the February low is intact, with the pair making consistent higher lows since mid-February. The broader context is a tug-of-war: USD strength from zero Fed cut expectations vs. potential BoJ rate hikes and intervention risk at 160.00.
Fibonacci Levels
| Level | Price | Significance | Status |
|---|---|---|---|
| 0.000 (Swing High) | 159.940 | Intervention trigger zone | AT LEVEL — Critical |
| 0.234 Retracement | 158.116 | Near-term support | Breakout level — now support |
| 0.382 Retracement | 156.988 | Key support | Strong demand zone on pullbacks |
| 0.500 Retracement | 156.076 | Mid-range equilibrium | Bull pivot on deep corrections |
| 0.618 Retracement | 155.164 | Secondary support | Below current price |
| 0.786 Retracement | 153.660 | Bull continuation line | Key structural support |
| 1.000 (Swing Low) | 152.121 | Origin of recovery move | Base of full retracement |
Candlestick Patterns (Daily)
USD/JPY’s recent daily candles show a staircase bullish structure — small-bodied bullish candles with progressively higher closes, characteristic of systematic institutional accumulation rather than speculative momentum. The candle from Thursday printed an inside bar near the 160.00 handle, suggesting compressed volatility ahead of a breakout or reversal. A decisive close above 160.00 would be a major technical and psychological event, likely triggering MOF/BoJ reaction. Conversely, a failure at this level — especially on a hot PCE print that causes USD buying to stall — could produce a sharp reversal candle back toward 158.00.
Trade Setups

Trend & Structure
AUD/USD is at a critical inflection point. After a six-week winning streak that took the pair from the 0.657 lows in early January all the way to the 0.720 area (above the 0.236 Fibonacci at 0.70612), the pair has reversed sharply. Current price at 0.68934 is testing the key 0.618 Fibonacci retracement at 0.68565, which is the last major support before the deeper correction zone. The pair lost more than 0.8% on Thursday alone, its worst single-day decline since the early-February risk-off shock. Today it is trading just above the 0.618 Fibonacci, with the dotted support line from the chart now being tested. The descending channel from the March high is intact, reinforcing the corrective bias.
Fibonacci Levels
| Level | Price | Significance | Status |
|---|---|---|---|
| 0.236 Retracement | 0.70612 | Swing high of recovery rally | Above — lost as support |
| 0.382 Retracement | 0.69830 | First major support on correction | Below — support turned resistance |
| 0.500 Retracement | 0.69198 | Midpoint equilibrium | Immediate resistance overhead |
| 0.618 Retracement | 0.68565 | Golden ratio support — critical level | ACTIVE TEST — next 24 hrs pivotal |
| 0.786 Retracement | 0.67665 | Deep retracement support | Bear target if 0.618 breaks |
| −0.618 Extension | 0.63208 | Extended bear target (cycle low) | Only active in major risk-off |
Candlestick Patterns (Daily)
Thursday’s AUD/USD daily candle was a large bearish engulfing candle, closing near session lows and engulfing the prior day’s body — a textbook continuation pattern for the downtrend. Today’s candle is forming a tentative doji just above 0.68565 support, suggesting a pause in selling. However, the context is bearish: a doji after a large bearish engulfing is a “pause before continuation” pattern unless confirmed by a strong bullish close above 0.6920. Traders should avoid buying the doji without confirmation — failed reversals at this level could accelerate the move to 0.6766.
Trade Setups
Cross-Pair Summary Matrix
| Pair | Price | Daily Trend | Fib Status | Key Support | Key Resistance | Session Bias | PCE Sensitivity |
|---|---|---|---|---|---|---|---|
| EUR/USD | 1.15187 | Downtrend ↓ | Testing 0.236 | 1.1408 | 1.1608 | SELL BIAS | HIGH — hot PCE = 1.1408 target |
| GBP/USD | 1.33046 | Downtrend ↓ | Near 0 Ext. | 1.3202 | 1.3380 | SELL BIAS | HIGH — 3 down days in a row |
| USD/JPY | 159.865 | Uptrend ↑ | At 0.000 (160) | 158.116 | 160.000 | INTERVENTION WATCH | MIXED — hot PCE = BoJ pressure |
| AUD/USD | 0.68934 | Corrective ↓ | Testing 0.618 | 0.6857 | 0.6920 | CAUTIOUS | HIGH — risk-sensitive |
Key Risk Factors for Next 24 Hours
| # | Risk Factor | Probability | Pairs Most Affected | Direction of Impact |
|---|---|---|---|---|
| 1 | US Core PCE ≥ 0.4% MoM (hot print) | 35% | EUR/USD, GBP/USD, AUD/USD | USD rally, all three down |
| 2 | US Core PCE ≤ 0.2% MoM (soft print) | 20% | EUR/USD, GBP/USD, AUD/USD | USD sold, counter-trend rally |
| 3 | BoJ/MOF verbal intervention above 160.00 | 65% | USD/JPY, all JPY crosses | USD/JPY sharp pullback |
| 4 | Iran escalation before April 6 deadline | 25% | All pairs — risk-off | USD/JPY up, others down |
| 5 | Quarter-end London Fix distortion | 90% | All pairs 14:00–16:00 GMT | Unpredictable — avoid trading Fix |
| 6 | China Industrial Profits beat (overnight) | 40% | AUD/USD, risk FX | AUD/USD supported |
Frequently Asked Questions
The euro’s sharp reversal reflects a fundamental shift in the macro landscape. Europe’s energy dependence means that the Iran conflict — and elevated Brent crude near $98/barrel — hits the eurozone’s trade balance and inflation dynamics simultaneously. The ECB is caught between cooling growth and sticky energy-driven inflation. Meanwhile, the Fed’s hawkish hold (zero rate cuts priced for 2026) means the US–Eurozone yield differential has widened materially, attracting capital back toward the dollar. The 0.236 Fibonacci level at 1.15315 is the last meaningful technical support before the 1.14080 cycle low.
The 160.00 level has historically prompted both verbal and physical intervention from the Japanese Ministry of Finance and Bank of Japan. In 2024, the MoF intervened twice — once at 160.25 and once at 161.95. With USD/JPY now at 159.865, the risk is acute. The asymmetry here is important: there is limited upside above 160.00 (intervention caps gains) but significant downside if intervention triggers a sharp reversal. Professional traders typically either avoid the pair in this zone entirely, or place tight stops above 160.50 on any short position. The safest approach is to wait for the reaction (BoJ verbal warning or action) and then trade the subsequent directional move.
The Personal Consumption Expenditures (PCE) price index is the Federal Reserve’s preferred inflation measure, unlike the more commonly reported CPI. The Fed explicitly targets Core PCE at 2.0%. When Core PCE prints above expectations — as it did in January 2026 at +3.1% YoY — it directly reduces the likelihood of rate cuts and strengthens the case for keeping rates higher for longer. For forex traders, a hot PCE print is one of the most reliable triggers for sharp USD appreciation across all major pairs. Today’s February Core PCE (forecast: +0.3% MoM, +2.9% YoY) will be watched more closely than almost any other release this month.
The key level to watch is the 0.618 Fibonacci retracement at 0.68565. A hold and bullish close above this level would suggest the six-week uptrend is merely pausing, making it a structural buying opportunity for patient traders targeting the 0.6983–0.7061 recovery zone. However, a clean daily close below 0.6857 would shift the technical bias firmly bearish and open the 0.6766 (0.786 Fib) target. The fundamental picture is mixed: Australia’s commodity-export base supports AUD at lower levels, but risk aversion from the Middle East conflict and the removal of all Fed cut expectations are powerful headwinds. We lean toward treating this as a correction within an intact uptrend — but only above 0.6857.
The London Fix at 4:00 PM London time (16:00 GMT) is a daily benchmark fixing where large institutional participants — pension funds, asset managers, corporates — execute large currency trades to rebalance their portfolios. At quarter-end, these rebalancing flows are significantly larger than normal, as investment portfolios are realigned based on Q1 2026 performance. This can create sharp, sudden, counter-trend moves that appear technically meaningless but are driven entirely by institutional flows. Experienced traders know to either step aside from active intraday positions in the 2–4 PM London window on quarter-end days, or reduce position size significantly to manage the risk of being wrong-footed by non-directional flow.
Without question, US Core PCE at 12:30 GMT is the dominant catalyst. UK Retail Sales (already released at −0.4% vs −0.8% forecast) provided a mild GBP positive, but it failed to materially move the pair because it is a second-tier driver relative to the Fed’s policy framework. PCE directly influences Fed policy expectations, which drive global capital flows and risk appetite across all major pairs. A hot PCE reading will override the positive UK Retail Sales print and push GBP/USD lower. The rule of thumb: always rank Fed-influencing data above any single country’s consumption survey.
Session Conclusion & Forward Outlook
What Today’s Session Tells Us
Friday, 27 March 2026 is a session defined by convergence risk — PCE data, UK Retail Sales, Iran geopolitics, BoJ intervention threat, and quarter-end flows are all active simultaneously. This is precisely the environment where experienced traders reduce leverage, wait for confirmation, and trade only the clearest setups.
The dominant medium-term narrative remains USD strength, supported by a hawkish Fed, elevated energy prices, and safe-haven demand. EUR/USD and GBP/USD are both in established downtrends, and the sell-on-rally framework continues to offer the highest probability setups. USD/JPY at 160.00 is the session’s single most important level — a break above without BoJ action would be a major event, while intervention could create the quarter’s most violent intraday reversal. AUD/USD’s test of the 0.618 Fibonacci at 0.68565 will define whether the six-week rally resumes or accelerates into a deeper correction toward 0.6766.
For the week ahead, attention turns to global PMI releases and the gathering pace of Q1 earnings season. But the Iran timeline — with President Trump’s extended deadline to April 6 — means geopolitical risk will remain the primary macro variable. Markets that fail to achieve diplomatic resolution will see further safe-haven premium in the dollar and yen. Markets that do achieve de-escalation could see a rapid reversal of recent USD gains, making the current short EUR/USD or GBP/USD setup inherently asymmetric: limited reward if Iran is resolved, but significant continuation if it isn’t.
Trade smart. Size conservatively. Respect the Fix window. And let PCE print first before committing to direction.