Trade FX, CFD, Stocks, BTC, Indices, Gold & Oil – 1:1000 Leverage & Bonus – CSFX

Mobile Header & Menu

Global Index Market Analysis – March 17, 2026 | Dow Jones · S&P 500 · FTSE 100 | Capital Street FX

March 17, 2026
CSFXadmin
Global Index Market Analysis – March 17, 2026 | Dow Jones · S&P 500 · FTSE 100 | Capital Street FX
FOMCDay 1 (Mar 17–18)
VIX23.47 — Elevated
Brent Crude$102.22
WTI Crude$94.46
US 10Y YieldRetreating
BoE DecisionMar 19
Nasdaq22,374 +1.22%
01
Market Overview
Global macro context, narrative & session themes — March 17, 2026
#FOMC #HormuzRisk #OilShock #Stagflation #NvidiaGTC #BoE #DotPlot

Global equity indices open Tuesday March 17, 2026 on a firmer footing after Monday’s sharp relief bounce — the strongest single session for US markets in over two weeks. The catalyst was straightforward: oil prices retreated sharply after reports emerged that select tankers successfully navigated the Strait of Hormuz over the weekend, dialling back the worst-case energy-shock fears that had driven a three-week equity rout. Brent crude, which had briefly spiked above $119 per barrel at the height of the panic, is now trading at $102.22 — still elevated, but materially lower than the crisis peak.

Yet Monday’s bounce arrives in a fundamentally cautious environment. The FOMC begins its two-day meeting today, concluding Wednesday March 18 with the rate decision at 2 PM ET and Chair Powell’s press conference at 2:30 PM ET. Markets are nearly unanimously expecting a hold at 3.50–3.75%, but the real event is the quarterly dot plot update — and specifically whether the median Fed official now projects zero or one rate cut in 2026, down from two projected in December. With oil above $100, the probability of a June cut has collapsed from 56% to just 23% in recent weeks according to Bloomberg data, and September — once considered a near-certainty for easing — is now only 54% priced for a cut.

Triple Macro Shock Week: This week delivers FOMC rate decision + dot plot (Mar 18), Bank of England rate decision (Mar 19), and Bank of Japan meeting (Mar 18–19) simultaneously. For index traders, this is one of the highest-risk calendar configurations of Q1 2026. Reduce position sizes by 30–40%, widen stops, and do not hold large directional bets through the Wednesday 2 PM ET decision window.

Structurally, all three US and UK indices recovered during Monday’s session but remain technically fragile. Less than 32% of S&P 500 stocks are trading above their 50-day moving averages — versus 65% earlier this month — signalling that the breadth damage from three consecutive losing weeks is deep. Nvidia’s GTC conference drove tech optimism, with CEO Jensen Huang projecting $1 trillion in chip orders through 2027, lifting the semiconductor complex and providing a counter-narrative to the energy shock. The FTSE 100 remains the technical outlier among the three — its long-term chart structure is genuinely bullish thanks to energy-sector tailwinds and the index’s commodity-heavy composition.

02
Economic Calendar
High-impact events driving index markets — next 48 hours
Time (UTC) Region Event Consensus Previous Impact Index Relevance
All Day 🇺🇸 USA FOMC Meeting — Day 1 HIGH Pre-positioning dominates. Expect choppy, directionless trade
13:30 🇺🇸 USA Housing Starts (Feb) 1.38M 1.37M MED Housing data feeds growth/recession narrative ahead of FOMC
13:30 🇺🇸 USA Building Permits (Feb) 1.46M 1.47M MED Forward-looking construction demand indicator
14:00 🇺🇸 USA NAHB Housing Market Index 42 44 MED Consumer sentiment proxy — watch for oil-driven deterioration
18:00 (Mar 18) 🇺🇸 USA FOMC Rate Decision + Dot Plot Hold 3.50–3.75% 3.50–3.75% HIGH Maximum volatility event. Dot plot determines direction
18:30 (Mar 18) 🇺🇸 USA Powell Press Conference Hawkish lean expected HIGH Tone on oil inflation vs. growth trade-off drives indices ±2%
12:00 (Mar 19) 🇬🇧 UK Bank of England Rate Decision Hold at 4.50% 4.50% HIGH Direct FTSE 100 driver. BoE tone on stagflation key for UK domestics
09:30 🇬🇧 UK UK CPI (February) +2.8% YoY +3.0% YoY HIGH Pre-BoE inflation print — hotter data = BoE hold = FTSE pressure
02:00 🇨🇳 China PBoC Loan Prime Rate Hold 3.10% 3.10% HIGH Global growth signal — easing positive for FTSE mining sector
All Day (Mar 18) 🇯🇵 Japan Bank of Japan Meeting (Day 1) Hold at 0.50% 0.50% MED Yen direction affects global risk appetite and US tech valuations
This Week’s Key Sequence: Tuesday Mar 17 — US Housing data (13:30 UTC) + FOMC Day 1 (no announcement). Wednesday Mar 18 — FOMC decision + dot plot at 18:00 UTC + Powell presser 18:30 UTC + BOJ Day 1. Thursday Mar 19 — UK CPI + BoE decision at 12:00 UTC. Traders should pre-position carefully today and reserve capital for Wednesday and Thursday’s volatility windows.
03
Live Index Snapshot
Current price action & key technical readings — March 17, 2026
Index Close Daily Chg 3-Wk Drawdown RSI (14D) Key Fib Level 200-Day MA Bias
DJ
Dow Jones
US30 · DJIA
46,946 +0.83% −7.0% 34 — Oversold 0.786 @ 46,722 Below — Bearish Bearish — Bounce
SP
S&P 500
US500 · SPX
6,699 +1.01% −4.8% 40 — Bearish Zone 0.500 @ 6,682 At / Below — Critical Neutral — FOMC Watch
UK
FTSE 100
UK100 · UKX
10,369 +0.50% −5.2% 47 — Near Neutral 0.382 @ 10,360 Below 200MA — Caution Structurally Bullish
04
Dow Jones Industrial Average — Technical Analysis
DJIA · US30 · Daily Chart · Capital Street FX (CSFX)
DJ
Dow Jones Industrial Average
46,946
O: 46,707 · H: 47,176 · L: 46,707 · C: 46,946 (+0.83%)
Dow Jones Daily Chart — Fibonacci Retracement — Capital Street FX
Fibonacci Levels (Daily)
LevelPriceRole
0.00050,525All-time swing high
0.23649,383Resistance
0.38248,677Key resistance
0.50048,106Mid-range
0.61847,535Resistance cluster
0.78646,722Near support
→ NOW46,946Current price (above 0.786)
1.00045,687Swing low / key support
1.61842,697Extended bear target
Technical Indicators
RSI (14-Day)
34.0 — Oversold
Below 35 — deeply oversold, bounce risk is real
20/50-Day MA Cross
Bearish Death Cross
20-day crossed below 50-day — confirmed downtrend
YTD Performance
−7.0% from ATH
Weakest of three indices in this report
Key Sector Leaders Mon
Salesforce +2.86%
Amazon +1.93%, Boeing +1.66% led Monday rebound
Candlestick Patterns & Trend
Weekly Pattern
Three Black Crows — Confirmed
The Dow printed three consecutive bearish weekly candles through March 3–13, 2026, each closing near session lows — a classic Three Black Crows formation. This is one of the most reliable bearish continuation signals, indicating sustained institutional selling. The pattern is now confirmed — all bounces are technically suspect until a weekly close above 47,535 (0.618 Fib) occurs.
Bearish Continuation
Daily Pattern (Mar 17)
Bullish Inside Bar / Doji Recovery
Monday’s session produced a bullish recovery candle with an upper wick forming near the 0.786 Fib zone (46,722). Today (Tuesday) is opening inside Monday’s range — a potential bullish inside bar that could confirm the short-term floor. However, without a close above 47,535, this remains a technical bounce within a larger downtrend.
Bounce — Not Reversal

Trend Analysis: The Dow Jones is in a confirmed medium-term downtrend, with the three-week selloff taking the index from its 50,525 high to a low near 45,687 — a decline of approximately 4,800 points or 9.5%. The current price of 46,946 sits just above the 0.786 Fibonacci retracement level at 46,722 — a zone that has acted as the first meaningful support during this correction. The RSI at 34 is in deeply oversold territory, which creates genuine short-covering and technical bounce risk. However, the death cross formation (20-day EMA below 50-day EMA) and bearish weekly candlestick structure argue against calling a bottom. Resistance levels at 47,535 (0.618 Fib) and 48,106 (0.500 Fib) will determine whether this is a genuine reversal or a standard dead-cat bounce ahead of FOMC. Only a weekly close above 48,677 (0.382 Fib) would signal a structural trend reversal.

⚡ Capital Street FX — Dow Jones Trade Setup
Direction
SELL RALLY
Entry Zone
47,400–47,535
Target 1
46,722
Target 2
45,687
Stop Loss
48,200
Risk:Reward
≈ 1:2.5
The dominant trade on the Dow remains selling into failed rallies at defined Fibonacci resistance. Enter short if price rebounds into the 47,400–47,535 zone (0.618 Fib) and fails to close above it with authority. The 48,200 stop maintains the bear thesis. If the FOMC dot plot signals two rate cuts on Wednesday — a dovish surprise — exit this setup immediately and reassess; the Dow could squeeze 1,000+ points on such a development. Do not enter this trade after 2 PM ET Wednesday without reading the FOMC outcome first.
05
S&P 500 — Technical Analysis
SPX · US500 · Daily Chart · Capital Street FX (CSFX)
SP
S&P 500 Index
6,699
O: 6,674 · H: 6,729 · L: 6,674 · C: 6,699 (+1.01%)
S&P 500 Daily Chart — Fibonacci Retracement — Capital Street FX
Fibonacci Levels (Daily)
LevelPriceRole
0.0007,008ATH anchor (Jan 2026)
0.2366,854Upper resistance
0.3826,759Near-term resistance
→ NOW6,699Current price
0.5006,682Critical support / 200 MA zone
0.6186,604Support / bear target 1
0.7866,495Bear target 2
1.0006,355Swing low base
1.6185,951Extended bear scenario
Technical Indicators
RSI (14-Day)
40.1 — Bearish Zone
Below 50 — sellers in control of medium-term structure
200-Day SMA
~6,668 — Critical
Price sitting just above 200-day — decisive level
Market Breadth
<32% above 50-day
Weakest breadth reading since Oct 2025 correction
VIX Level
23.47 — Elevated
Easing from 27+ peak but still above historical avg
Candlestick Patterns & Trend
Weekly Pattern
Bearish Engulfing + 200-Day MA Test
The S&P 500 printed a significant bearish engulfing weekly candle the week of March 9–13, closing near its lows and breaching the 200-day moving average intraday. While it recovered into the close, the candle body engulfed the prior week’s entire range — a high-conviction bearish continuation signal at a technically critical level. A weekly close below 6,682 (0.500 Fib / 200-day MA zone) would confirm the bearish regime shift.
Bearish Engulfing
Daily Pattern (Mar 17)
Bullish Marubozu / Strong Recovery Day
Monday’s session produced a near-marubozu bullish candle — opening at the session low and closing near the high (+1.01%). This is the strongest daily close since late February. However, the index is still below the 0.382 Fibonacci level at 6,759. Today’s inside-bar formation will confirm whether Monday was a genuine reversal or a volatility-driven fake-out ahead of FOMC.
Recovery — Confirm Needed

Trend Analysis: The S&P 500 sits at the most technically significant juncture of the year. The index is hugging the 0.500 Fibonacci retracement level (6,682) and the 200-day moving average (~6,668) — two of the most watched technical levels in all of global finance. A sustained weekly close below this dual support zone would historically signal a transition from correction to bear market regime. The current price of 6,699 sits just 17 points above this critical floor. Monday’s +1.01% session provides short-term relief, but with only 32% of S&P stocks above their 50-day averages and market expectations for Fed cuts in 2026 rapidly diminishing, the fundamental backdrop remains challenging. The FOMC dot plot on Wednesday is the single decisive event: a hawkish surprise (zero cuts projected) would likely break the 6,682 floor and target 6,604 and 6,495 sequentially. A dovish outcome (two cuts projected) would likely trigger a sharp 200–300 point relief rally toward 6,854–6,900.

⚡ Capital Street FX — S&P 500 Trade Setup
Direction
SELL BOUNCE
Entry Zone
6,740–6,759
Target 1
6,682
Target 2
6,604
Stop Loss
6,800
Risk:Reward
≈ 1:2.1
Sell any rally that reaches 6,740–6,759 (between 0.382 and mid-range) and fails to show strong buying volume. The 6,800 stop keeps the setup within the technical structure. This setup has the highest probability if the FOMC dot plot shows zero or one cut — which is the base case given current oil-driven inflation pressures. Alternative bull scenario: if the S&P closes decisively above 6,759 post-FOMC on Wednesday, flip to a long targeting 6,854 (0.236 Fib) with a tight stop below 6,700.
06
FTSE 100 — Technical Analysis
UKX · UK100 · Daily Chart · Capital Street FX (CSFX)
UK
FTSE 100 Index
10,369
O: 10,317 · H: 10,385 · L: 10,317 · C: 10,369 (+0.50%)
FTSE 100 Daily Chart — Fibonacci Retracement — Capital Street FX
Fibonacci Levels (Daily)
LevelPriceRole
0.00010,938Swing high (Feb 2026)
0.23610,581Near resistance
→ NOW10,369Current price
0.38210,360Critical support floor
0.50010,181Next major support
0.61810,003Psychological 10,000 floor
1.0009,425Swing low base
1.6188,489Extended bear scenario
Technical Indicators
RSI (14-Day)
47.3 — Near Neutral
Best RSI of the three indices — healthiest structure
Long-Term Trend
Bullish (6-Month)
All major MAs below price on monthly chart — bull trend intact
Energy Sector Support
BP + Shell +3% (Mar 12)
High oil prices cushion FTSE via energy-heavy composition
BoE Decision
March 19 — Hold 4.50%
Dovish signal would be significantly bullish for FTSE
Candlestick Patterns & Trend
Weekly Pattern
Bullish Hammer at 0.382 Support
The most recent weekly candle on the FTSE 100 formed a near-perfect hammer pattern at the 0.382 Fibonacci level (10,360) — the small body at the top with a long lower wick indicates that sellers pushed the index below 10,000 intraweek but buyers absorbed the pressure and drove it back up. This is a textbook bullish hammer at a key support zone and represents the FTSE’s long-term bull trend fighting back against the geopolitical selloff.
Bullish Hammer — Reversal Signal
Daily Pattern (Mar 17)
Doji / Inside Day at 0.382 Fib
The FTSE is printing a near-doji candle at 10,369 — effectively sitting right on top of the 0.382 Fibonacci support at 10,360. This is a pivotal zone: if the index holds and closes above 10,360 today, it confirms the 0.382 as support and sets up a rally toward 10,581 (0.236 Fib). The 6-month rising channel structure remains intact as long as 10,003 holds on a weekly basis.
Support Test — Bullish Lean

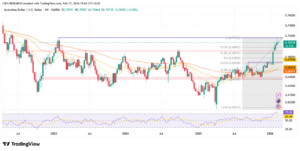
Trend Analysis: The FTSE 100 is the most technically constructive index in this report — a direct contrast to the US indices. The 6-month daily chart shows a clean rising channel with all major moving averages below price, confirming the longer-term bull trend remains structurally intact despite the recent selloff. The correction from the 10,938 high to the current 10,369 represents a healthy 5.2% pullback to the 0.382 Fibonacci retracement — a standard correction within an uptrend rather than a trend break. The FTSE benefits from two powerful structural supports: elevated oil prices boosting BP and Shell (which carry significant index weight), and a more dovish BoE narrative relative to the Fed. The critical level to watch is 10,360 — the 0.382 Fib. A daily close below this level, especially if confirmed by a hawkish BoE on Thursday, would extend the correction toward 10,181 (0.500 Fib). Conversely, a hold above 10,360 sets up a recovery toward the 0.236 level at 10,581 and potentially a re-test of the 10,938 highs.

⚡ Capital Street FX — FTSE 100 Trade Setup
Direction
BUY SUPPORT
Entry Zone
10,280–10,360
Target 1
10,536
Target 2
10,581
Stop Loss
10,180
Risk:Reward
≈ 1:2.4
The FTSE 100 is the only long trade in today’s report. Buy any dip into the 10,280–10,360 zone — the 0.382 Fibonacci support confirmed by the weekly hammer pattern. The 10,180 stop (below the 0.500 Fib) protects the position if the support breaks decisively. Targets are the 10,536 previous high and 10,581 Fib level. Note: BoE decision on Thursday March 19 is the risk event for this trade — a surprise hawkish hold citing oil inflation would pressure the index toward 10,181. Size accordingly ahead of Thursday and consider trimming at Target 1 (10,536) before the BoE.
07
Sector & Market Breadth Analysis
Monday March 16 session leaders, laggards & structural drivers
Sector / Stock Index Mon Performance 3-Week Trend Driver
Technology / AI (Nvidia, Micron) S&P 500 / Nasdaq Nvidia +1.6% · Micron +3.7% Underperforming YTD GTC 2026 — Huang $1T chip forecast ignited AI optimism
Financials (Goldman, Banks) Dow / S&P 500 Goldman +2.15% Under pressure from rate uncertainty Rate curve normalization — yield retreat relieved bank pressure
Industrials (Boeing, Caterpillar) Dow Jones Boeing +1.66% · CAT +2.09% Weak on supply chain fears Hormuz re-open signals eased shipping disruption fears
Energy (BP, Shell) FTSE 100 +2–3% (Mar 12 surge) FTSE 100 outperformer Oil above $100 — direct earnings windfall for FTSE energy names
Consumer Discretionary S&P 500 Amazon +1.93% Sensitive to energy-cost consumer squeeze Dollar Tree noted oil shipping offsets tariff relief
Communication / Social Nasdaq / S&P 500 Meta +2.3% Volatile on AI monetisation debate Workforce restructuring reports drove afternoon buying
Transports (Airlines, Logistics) Dow Trans. UAL, DAL led — Trans +1% −9% month-to-date Oil decline helps airline margins — 100-day MA support tested
UK Banks (HSBC, Barclays) FTSE 100 Mixed — HSBC lagging Middle East exposure concerns HSBC ex-div + ME broker downgrades weighing on UK financials
08
Fundamental Drivers
Key macro, geopolitical & structural catalysts for next 24–48 hours
🏛 FOMC — Day 1 Today
Dot Plot on Wednesday
The FOMC begins today with the announcement and dot plot on Wednesday March 18 at 2 PM ET. The Fed is holding at 3.50–3.75% — the question is whether 2026 cut projections fall to zero. Probability of a June cut has collapsed from 56% to 23%. Any shift to fewer than one projected 2026 cut would be the most bearish equity outcome possible this week.
🛢 Oil — Hormuz Pivot
Brent $102 — Off Peak
Brent crude has retreated from its crisis peak of $119+ to $102.22 after reports that tankers successfully transited the Strait of Hormuz. WTI is at $94.46. This oil retreat was the primary driver of Monday’s equity bounce. However, Trump’s call for allied nations to help escort tankers suggests the blockade risk has not fully resolved — oil remains structurally above $100 and a re-escalation is possible.
🤖 Nvidia GTC 2026
$1T Chip Forecast
CEO Jensen Huang announced that Nvidia expects $1 trillion in Blackwell and Vera Rubin chip orders through 2027 — double last year’s forecast. This dramatically revived AI optimism and lifted the semiconductor complex: Nvidia +1.6%, Micron +3.7%, Meta +2.3% on Monday. The GTC conference continues this week and could deliver further AI-related headlines that support tech valuations and the Nasdaq.
🇬🇧 Bank of England
Decision March 19
The BoE meets Thursday March 19 — the day after the FOMC. The UK faces a classic stagflation dilemma: oil-driven inflation at 3%+ vs. slowing growth. A dovish hold citing downside growth risks would be broadly positive for the FTSE 100, particularly rate-sensitive sectors. A hawkish hold citing oil inflation concerns would pressure UK domestic stocks, though the FTSE’s multinational revenue base provides some cushion via GBP effects.
📊 S&P Earnings Outlook
+15% EPS Growth 2026
Despite the current market turbulence, S&P 500 earnings growth consensus remains at +15% for 2026, with 74% of companies beating EPS estimates in the most recent reporting period. This fundamental foundation provides a long-term floor for the index even as macro headwinds dominate short-term price action. If oil normalises and FOMC surprises dovishly, the valuation case for US equities improves dramatically.
🇨🇳 China Data Beat
IP +6.3% vs 5.0% exp.
China’s January–February data released Monday beat all forecasts: Industrial Production +6.3% (vs 5.0% expected), Retail Sales +2.8% (vs 2.5%), Fixed Asset Investment +1.8% (vs −2.1%). Strong China data is modestly positive for the FTSE 100’s mining sector (Rio Tinto, BHP) via commodity demand, but analysts at Nomura caution the Iran oil shock will widen the gap between China’s export and domestic demand through 2026.
09
Frequently Asked Questions
Expert answers for active index traders
Is Monday’s equity rally the start of a genuine recovery or a temporary bounce?
Monday’s bounce was technically significant — the S&P 500 held above the 0.500 Fibonacci level and 200-day moving average — but the breadth picture argues for caution. Less than 32% of S&P 500 stocks are above their 50-day moving averages, a reading consistent with relief bounces rather than confirmed trend reversals. The oil price catalyst (Hormuz partial re-opening) has not resolved the underlying geopolitical risk. The decisive test will be whether the S&P 500 can sustain a weekly close above 6,759 (0.382 Fib). Until that occurs, the dominant structure remains a corrective bounce within a downtrend.
How will the FOMC dot plot specifically affect index markets on Wednesday?
Three scenarios are in play. If the dot plot shows two or more rate cuts in 2026 (dovish surprise): expect an immediate 1.5–3% rally in US indices, likely breaking the S&P through 6,759 and targeting 6,854. If it shows one cut (consensus / neutral): mild positive reaction, markets already partially priced for this — S&P likely consolidates 6,680–6,760. If it shows zero cuts in 2026 (hawkish surprise): the most negative outcome — expect S&P to break below 6,682 and test 6,604 within 48 hours, and Dow Jones to re-test 45,687 lows. Powell’s specific language on the Iran conflict’s inflation impact will be as important as the numbers themselves.
Why is the FTSE 100 outperforming US indices during this correction?
Two structural factors explain the FTSE’s relative strength. First, the index has significant exposure to the energy sector via BP and Shell — both of which benefit directly from elevated oil prices above $100/barrel, while US technology-heavy indices like the Nasdaq suffer from the same energy shock through higher input costs. Second, the FTSE’s long-term chart structure is genuinely bullish: it broke above the 10,000 psychological milestone for the first time in history in Q1 2026 and has all major moving averages below price on the monthly chart. The index is correcting within an uptrend, while US indices are potentially breaking down from one.
What is the significance of the S&P 500’s 200-day moving average at ~6,668?
The 200-day moving average is the most closely watched technical level in institutional equity trading. A sustained weekly close below this level — followed by a failed recovery attempt — has historically been the most reliable indicator of a transition from bull market to bear market regime. The S&P 500 has been oscillating around this level (currently around 6,668) for the past two weeks, with intraday breaches followed by recovery closes. As long as the index defends a weekly close above this level, the long-term bull thesis remains technically valid even amid the current correction. A decisive break below on closing basis, however, would likely trigger systematic selling from algorithmic and rule-based institutional managers.
Should I be buying dips in the Dow Jones at current levels?
The short answer is not yet, for technical reasons. The Dow has confirmed a “Three Black Crows” weekly pattern — one of the most bearish candlestick formations — and the 20-day EMA has crossed below the 50-day EMA (a “death cross”). The RSI at 34 is oversold, which creates bounce opportunities, but oversold can become more oversold in a downtrend. The professional approach is to wait for a confirmed weekly close above the 0.618 Fibonacci level at 47,535 before considering long exposure. Until that level is reclaimed and held, the Dow’s technical structure supports selling bounces rather than buying dips. The FOMC outcome on Wednesday March 18 will be the pivotal directional catalyst.
How does the Iran-Hormuz conflict continue to affect indices even as oil retreats?
The Hormuz situation creates a persistent risk premium in equity markets even when oil temporarily retreats, because the structural closure risk has not been resolved. Markets are repricing the probability distribution of oil outcomes: even if the base case is a partial normalisation toward $85–90/barrel, the tail risk of a full closure scenario — which would send oil to $150+ and effectively guarantee recession — justifies elevated volatility pricing (VIX at 23–27) and compressed equity valuations. Every time Trump makes a statement about Hormuz escorts or Iran makes a counter-statement, equity markets will react disproportionately because the uncertainty around the range of outcomes remains extremely wide.
10
Summary & Market Direction
Capital Street FX Research Desk — March 17, 2026

Global equity indices enter Tuesday March 17 with cautious optimism after Monday’s relief bounce, but the dominant market theme remains defined uncertainty ahead of the most consequential FOMC meeting of 2026. The oil crisis that drove three consecutive weeks of equity selling has partially eased — Brent is at $102 rather than $119 — but the geopolitical risk has not resolved, the stagflation narrative is intact, and rate cut expectations for 2026 have been dramatically repriced.

Among the three indices, the FTSE 100 is the standout from a structural perspective — its long-term bull trend is intact, it has energy-sector tailwinds, and its 0.382 Fibonacci support at 10,360 is holding. The S&P 500 sits at the most critical level of the year — the 200-day moving average and 0.500 Fib at 6,682 — and Wednesday’s FOMC outcome will determine whether this is a buying opportunity or the start of a deeper bear market. The Dow Jones faces the most technical damage, with a confirmed Three Black Crows pattern and death cross formation arguing for continued range-bound to bearish price action.

For all three indices, the next 48 hours are about capital preservation and preparation — not aggressive new position-taking. The FOMC dot plot on Wednesday and the Bank of England decision on Thursday will collectively determine Q2 2026 market direction.

DOW JONES — US30
Bearish — Bounce Only
Three Black Crows + death cross confirmed. Sell rallies at 47,400–47,535. FOMC hawkish outcome targets 45,687. Only a weekly close above 48,677 (0.382) reverses bias.
S&P 500 — US500
Neutral — FOMC Pivotal
Hanging above 200-day MA and 0.500 Fib (6,682). Dovish FOMC = target 6,854. Hawkish FOMC = target 6,604 and 6,495. Wednesday decides the regime.
FTSE 100 — UK100
Structurally Bullish
Best technical setup of the three. Bullish weekly hammer at 0.382 Fib (10,360). Long-term bull trend intact. Buy dips to 10,280–10,360, target 10,536–10,581.
Trade Indices with Capital Street FX: Access the Dow Jones, S&P 500, FTSE 100, DAX, Nikkei and 2000+ more instruments with up to 1:10,000 leverage, 0.0 pips spreads on Zero accounts, real-time execution, and 24/7 live support. Our risk infrastructure — including negative balance protection — is built for exactly these high-volatility FOMC and central bank windows. Open your account today →
CryptoDesk Research Intelligence — Global Index Report · Published March 17, 2026 | 08:00 UTC