Global Index Market Analysis – March 5, 2026 | Dow Jones · Nasdaq 100 · DAX 40

Global Index Markets Navigate Iran War Fallout and US Jobs Data
After five days of violent swings triggered by the US-Israeli military strikes on Iran, global equity benchmarks are attempting a fragile recovery. Here is everything experienced index traders need for the next 24 hours — geopolitical context, economic catalysts, technical setups, and actionable trade ideas across the Dow Jones, Nasdaq 100, and DAX 40.
Global Market Snapshot — Wednesday Close, March 4, 2026
Wednesday handed the bulls their first meaningful win since the US-Israel strikes on Iran triggered a full-scale risk-off event last Friday. A softer oil price, better-than-expected ADP jobs numbers, and an expansion in services sector activity convinced institutional investors to step back in — particularly in semiconductor and Big Tech names. Here’s where everything settled.
| Index | Wed Close | Mon Close | Wk Chg % | 52-Wk High | 52-Wk Low | YTD Trend |
|---|---|---|---|---|---|---|
| Dow Jones (DJI) | 48,739 | 48,904 | −0.34% | ~50,700 | ~41,100 | Volatile / Correcting |
| S&P 500 (SPX) | 6,869 | 6,881 | −0.17% | ~7,300 | ~5,800 | Near Support |
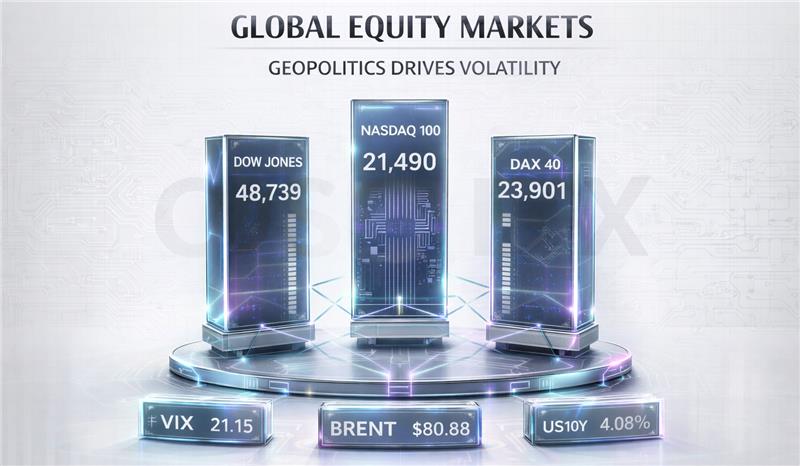
| Nasdaq 100 (NDX) | ~21,490 | 24,992 | −14% | 26,054 | ~20,000 | Bearish Phase |
| DAX 40 (DE40) | 23,901 | 24,638 | −3.00% | 25,507 | 18,489 | Correcting / Bouncing |
| FTSE 100 (UKX) | 10,567 | 10,780 | −1.97% | ~11,100 | ~7,400 | Off Record High |
| Nikkei 225 | 54,245 | ~56,200 | −3.60% | ~58,000 | ~35,000 | Sharply Lower |
The Macro Story: Five Days That Shook Global Markets
The dominant market narrative for the past five days has been the unexpected escalation of a US-Israeli military offensive against Iran, codenamed “Operation Epic Fury,” launched on Saturday, February 28, 2026. What followed was one of the most concentrated bouts of index volatility since the pandemic era. Understanding the arc of this episode is essential for calibrating risk over the next 24 hours.
Chronological Market Impact
| Date | Event | DJI Impact | Oil (Brent) | VIX | Market Sentiment |
|---|---|---|---|---|---|
| Feb 28–Mar 1 | US-Israel launches strikes on Iran (“Epic Fury”) | −73 pts (−0.15%) | +6.3% Mon | ~20 | Initial shock, dip-buying |
| Mar 2 (Mon) | Iran retaliates; Strait of Hormuz closure feared | Dow −543 intraday | +8% / $83.83 | 23.31 | Risk-off, energy spike |
| Mar 3 (Tue) | War spreads; Korea Kospi −7%; UAE markets halted | −403 pts (−0.83%) | ~$82/bbl | Peak ~25+ | Maximum fear; Dow −1,200 intraday |
| Mar 4 (Wed) | Trump offers naval escorts; ADP beats; oil retreats | +238 pts (+0.49%) | $80.88 | 21.15 | Recovery, tech-led bounce |
| Mar 5 (Today) | US Jobless Claims 8:30 AM; NFP tomorrow | TBD | ~$80 | ~21 | Cautious; watching claims data |
Key Fundamental Drivers for the Next 24 Hours
| Driver | Direction | Impact on Indices |
|---|---|---|
| Iran Conflict — Oil Price | Uncertain | Every $1 increase in Brent above $82 compresses equity multiples; below $80 = relief rally |
| US Initial Jobless Claims (8:30 AM ET) | Forecast: 215K vs Prior 212K | A beat (<210K) = Dow/Nasdaq bullish; miss (>225K) adds recession fear |
| US Trade Balance (8:30 AM ET) | Prior: −$70.3B | High deficit widens war spending concern; neutral-to-negative for USD |
| Friday NFP (Mar 6) | Consensus: ~75-80K | Today’s claims are the lead indicator; a strong number helps all indices |
| US 15% Global Tariff (Effective This Week) | Headwind | Stagflation risk; import-sensitive sectors (tech, retail) most exposed |
| Fed FOMC (March 17–18) | Hold Expected | Zero probability of cut before July 2026; higher-for-longer dampens multiples |
| Broadcom Earnings (after-hours Wed) | Mixed Outlook | Underwhelming guidance but $10B buyback; Nasdaq pre-market volatile |
Economic Calendar — High-Impact Events, March 5–6, 2026
Thursday and Friday pack a heavy one-two punch. Today’s US Jobless Claims serve as a crucial pre-cursor to Friday’s Non-Farm Payrolls. European, UK, and Asian central bank watch items are also live. Filter for the highest-impact releases below.
| Time (ET) | Country | Event | Prev. | Forecast | Impact | Market Relevance |
|---|---|---|---|---|---|---|
| 08:30 AM | 🇺🇸 USA | Initial Jobless Claims (Week of Mar 1) | 212K | 215K | HIGH | Primary labor market signal ahead of NFP; below 210K = bullish Dow/Nasdaq |
| 08:30 AM | 🇺🇸 USA | Continuing Jobless Claims | 1.833M | 1.85M | HIGH | Confirming or contradicting initial claims trend; prolonged claims = labor market concern |
| 08:30 AM | 🇺🇸 USA | Trade Balance (January) | −$70.3B | ~−$71B | HIGH | War-related import costs likely widened deficit; USD reaction key for Nasdaq pricing |
| 08:30 AM | 🇺🇸 USA | Challenger Job Cuts (February) | — | — | MED | Leading layoff indicator; relevant if cuts surge above recent trend |
| All Day | 🇺🇸 USA | 15% Global Tariff Takes Effect | — | — | HIGH | Per Treasury Sec. Bessent’s confirmation; adds stagflation risk to all equity indices |
| 07:00 AM | 🇬🇧 UK | Halifax House Price Index (Feb) | +0.7% | +0.4% | MED | Soft UK property data may reinforce BoE dovish lean; modest FTSE 100 tailwind |
| 03:00 AM | 🇪🇺 EU | Eurozone Retail Sales (Jan) | +0.3% | +0.2% | MED | Weak consumer spending in Europe = mild DAX headwind; ECB easing support still intact |
| 02:30 AM | 🇯🇵 Japan | BoJ Monetary Policy Meeting Minutes | — | — | MED | Nikkei already down 3.6% Wednesday; hawkish minutes could extend Asia selling |
| TBD | 🇨🇳 China | National People’s Congress — Policy Announcements | — | — | MED | GDP target and stimulus announcements could move Hang Seng/China-exposed DAX stocks |
| TBD | 🇦🇺 AUS | RBA Speech / Financial Stability Review | — | — | MED | AUD/USD reaction may influence commodity pricing; secondary index impact |
| ★ FRIDAY, MARCH 6 — NON-FARM PAYROLLS 08:30 AM ET | PRIOR: 130K | FORECAST: ~75-80K | HIGH IMPACT — THIS IS THE WEEK’S DEFINING CATALYST | ||||||
Dow Jones Industrial Average (DJI) — Full Analysis

The Dow Jones has been the most volatile of the three major US indices since the Iran conflict began. After punishing intraday moves that saw the index plunge more than 1,200 points at one point on Tuesday, Wednesday’s 238-point recovery is encouraging — but the chart still shows significant damage. The 50-day moving average at approximately 49,275 now acts as resistance overhead. Crucially, the index is currently testing the 48,383–47,857 Fibonacci retracement zone — a make-or-break area that will determine whether this is a genuine recovery or a dead-cat bounce.
Key Resistance Levels
Key Support Levels
| Indicator | Value / Reading | Signal | Interpretation |
|---|---|---|---|
| 50-Day MA | ~49,275 | Price Below | Short-term bearish; acting as resistance |
| 200-Day MA | ~46,843 | Price Above | Long-term trend still intact; major support |
| RSI (14-day) | ~38–42 | Oversold Approaching | Below 40 = oversold territory, mean-reversion watch |
| MACD | Negative / Diverging | Bearish | Signal line cross below zero; downward momentum |
| ATR (Avg True Range) | ~400–600 pts | High Volatility | Wide intraday swings expected; reduce leverage |
| Fibonacci Retracement | 48,383–47,857 | Testing Now | Must hold this zone for recovery to continue |
| Daily Trend Structure | Lower Highs / Lower Lows | Downtrend | Since the Jan ATH; corrective structure active |
| Volume (Wed Bounce) | Above Average | Bullish Bounce | High-volume recovery increases conviction of reversal bid |
Trend Assessment
The short-term trend (5–10 days) for the Dow is bearish-to-neutral. The index has formed a clear series of lower highs since the January all-time high above 50,700. The pattern from Jan 13 through March 3 constitutes a corrective wedge, with the Iran conflict acting as an acceleration catalyst rather than the root cause. The medium-term trend (3–6 months) remains in a broader bull market — the 200-day MA at 46,843 defines the line between cyclical correction and something more structural. Wednesday’s bounce was constructive but needs follow-through to be trusted.
Trade Setup — Dow Jones (DJI) Cautious Buy Dip
Given the corrective structure but oversold RSI and high-volume bounce on Wednesday, a conditional long setup is attractive if Jobless Claims come in at or below consensus (215K). The key is waiting for confirmation rather than chasing.
Nasdaq 100 (NDX) — Full Analysis

Of the three indices covered in this report, the Nasdaq 100 has suffered the most structurally damaging technical picture in 2026. The index was already in a corrective descending triangle pattern from its January high of ~26,054 when the Iran conflict struck — accelerating the breakdown. The 200-day MA near 24,106 was decisively broken during the sell-off. Wednesday’s tech-led bounce — powered by AMD (+5.5%), Micron (+5.6%), Nvidia (+1.7%) and Amazon (+3.9%) — was the most promising single-day recovery of the week, but the weight of bearish structure means rallies must be traded carefully.
Key Resistance Levels
Key Support Levels
| Indicator | Value / Reading | Signal | Interpretation |
|---|---|---|---|
| 20-Day MA | ~25,029 | Price Below | Broken; short-term trend bearish |
| 50-Day MA | 25,311 | Price Far Below | Major resistance on any bounce attempt |
| 100-Day MA | 25,260 | Price Below | Cluster resistance zone around 25,260–25,311 |
| 200-Day MA | 24,106–24,556 | Broken | Critical level now acting as overhead resistance |
| RSI (14-day) | ~42–47 | Mid-Range Neutral | Not deeply oversold; bounce not technically exhausted |
| ADX (Trend Strength) | ~18 | Weak Trend | Oscillating; no strong directional trend established |
| Pattern (Daily) | Descending Triangle | Bearish | Lower highs + horizontal support; breakdown risk |
| Elliott Wave (Short-term) | 5th Wave Complete? | Potential Bottom | Bounce from potential wave 5 low; requires follow-through |
| Sector Leadership | Semis Leading Bounce | Conditionally Bullish | AMD, Micron, Nvidia all surging — classic NDX recovery signal |
Trend Assessment
The Nasdaq 100’s short-term trend is bearish. The series of lower highs from January and the decisive break below the 200-day MA paint a clearly damaged chart. However, the medium-term picture depends critically on the outcome of Jobless Claims and NFP: a strong labor market reading would support the “soft landing” thesis and allow mega-cap tech earnings expectations to remain intact. The trading range of 24,112 (support) to 26,054 (resistance) has defined the index since November 2025. A break in either direction would be significant.
Trade Setup — Nasdaq 100 (NDX/NQ) Sell the Rally
The structural bearish pattern and cluster of MA resistance between 24,400–25,311 make the Nasdaq 100 the weakest of the three indices on a bounce. The preferred setup is to fade any rally into the resistance cluster, rather than chase the initial pop from Wednesday’s bounce. A break below 24,000 targets 22,000–22,500.
DAX 40 (DE40 / GDAXI) — Full Analysis

The DAX 40’s Iran-conflict correction has been among the most severe of any major global index. After hitting an all-time high of 25,507 on January 13, 2026, the index cascaded through multiple support levels, reaching its lowest point since early December 2025 at 23,725 on Tuesday. The damage was broad-based: financials, industrials, travel, energy, and consumer sectors all fell 4–6% on Tuesday alone, with Beiersdorf’s near-20% collapse adding single-stock idiosyncratic pain. Wednesday’s 0.46% recovery to 23,901 is tentative. The next critical area is whether the index can reclaim and hold the 24,000–24,200 zone — a level now serving as the dividing line between recovery and deeper retracement toward 23,000.
Key Resistance Levels
Key Support Levels
| Indicator | Value / Reading | Signal | Interpretation |
|---|---|---|---|
| 5-Day MA | ~25,311 | Price Far Below | Short-term trend decisively bearish |
| 50-Day MA | ~25,279 | Price Below | Cluster resistance with 5-DMA at ~25,280–25,311 |
| 200-Day MA | 24,610 | Price Below | Now overhead resistance; needed for medium-term recovery |
| Fibonacci Pivot | 25,312 | Price Below | Major directional pivot; price needs to close above to re-engage bulls |
| 30-Min Signal | Strong Sell | Bearish | Short-term traders seeing continued selling pressure intraday |
| Hourly Signal | Neutral | Indecision | Some balance returning; watch 24,000 as pivot |
| 5-Hr / Daily Signal | Buy / Strong Buy | LT Bullish | Longer-term trend still bullish; 12 buy MA signals vs 0 sell |
| Weekly / Monthly Signal | Strong Buy | Strategic Hold | The broader bull cycle from 2022 remains structurally intact |
| 52-Wk Performance | +4.87% | Positive | Despite recent 6.5% drawdown from ATH, still up on the year |
Trend Assessment
The DAX 40 presents a compelling paradox: the short-term chart is damaged (lower highs, broken support, selling across all sectors), while longer-term moving averages and institutional signals remain firmly bullish. The €500 billion German government investment programme (“Sondervermögen”) announced earlier in 2026, ECB room to ease further, and resilient corporate earnings among German multinationals all argue that this Iran-war correction is a buying opportunity rather than a structural reversal. DZ Bank targets 27,500 by end-2026, and the long-term bull cycle that began in late 2022 is intact. The critical question is whether the 23,000–23,700 support zone holds through Friday’s NFP.
Trade Setup — DAX 40 (GDAXI) Buy the Dip
The DAX offers the most attractive risk-reward of the three indices for a medium-term bullish trade, given the depth of correction from the ATH (+6.5% drawdown), the long-term bullish structure, and ECB policy support. The setup favors accumulation on dips toward the 23,700–23,900 range, targeting a recovery through 24,500 and ultimately 25,000+. The stop is a confirmed close below 23,000.
Candlestick Pattern Analysis — Active Signals
Candlestick patterns provide contextual price action intelligence layered on top of technical indicators. The patterns below have been identified from the daily charts of the three major indices covered in this report, and are meaningful in the current high-volatility environment.
| Index | Timeframe | Pattern | Type | Location | Signal | Confirmation Needed |
|---|---|---|---|---|---|---|
| Dow Jones | Daily | Hammer / Dragonfly Doji (Tue) | Bullish Reversal | At Fib support 48,200–48,400 | Potential bottom signal | Close above 48,800 today confirms |
| Dow Jones | Daily | Bearish Engulfing (Mon) | Bearish Continuation | At 48,900 resistance level | Sellers in control from that level | Break above 49,000 invalidates |
| Nasdaq 100 | Daily | Descending Triangle Breakdown | Bearish Pattern | Across 24,500–25,300 range | Distribution phase, lower target | Close back above 25,000 needed for recovery |
| Nasdaq 100 | Daily (Wed) | Bullish Marubozu / Strong Candle | Short-term Bullish | From oversold level ~21,000 | Powerful single-session recovery | Follow-through today confirms; failure = bear trap |
| DAX 40 | Daily (Tue) | Long-Legged Doji / Shooting Star | Bearish Exhaustion | 23,700–23,900 range | Volatility peak; potential washout | Close below 23,700 = more downside |
| DAX 40 | Daily (Wed) | Bullish Spinning Top | Tentative Recovery | At December 2025 support base | Buyers testing the base; tentative | Needs confirming bull candle (body >50% range) |
| All Indices | Weekly | Dark Cloud Cover (Week of Mar 2) | Bearish Reversal | Below prior week highs | Weekly bearish signal | Weekly close above prior week’s high reverses |
Dow Jones — Primary Pattern
The Tuesday doji / hammer formed at the 48,200–48,400 Fibonacci zone is a classic bottoming signal — but requires the Wednesday close to hold above it. Intraday follow-through today is the validation test.
Nasdaq 100 — Primary Pattern
The multi-week descending triangle from the January high is the dominant pattern. Wednesday’s bounce is a counter-trend move within this structure. Resistance at 24,950–25,100 is the key test area for today.
DAX 40 — Primary Pattern
Tuesday’s doji at the 23,700 base, followed by Wednesday’s tentative recovery, is the classic “washout + re-test” setup. The DAX needs a confirming bullish body candle today to establish a base. Long-wicked candles at support signal capitulation.
Quick-Reference: All Three Indices at a Glance
| Metric | Dow Jones (DJI) | Nasdaq 100 (NDX) | DAX 40 (DE40) |
|---|---|---|---|
| Last Close | 48,739 | ~21,490 (comp.) | 23,901 |
| Change (Wed) | +0.49% | +1.29% (comp.) | +0.46% |
| 52-Wk ATH | ~50,700+ | 26,054 | 25,507 |
| Drawdown from ATH | ~3.9% | ~17.5% | ~6.3% |
| Short-Term Trend | Corrective | Bearish | Corrective/Bearish |
| Medium-Term Trend | Neutral / Recovery | Range-Bound | Bullish (long-term) |
| Key Support | 48,000–48,383 | 24,000–24,112 | 23,700–23,900 |
| Key Resistance | 49,000–49,275 | 24,950–25,311 | 24,200–24,610 |
| RSI (14-Day) | ~38–42 (Oversold) | ~42–47 (Neutral) | ~35–42 (Oversold) |
| Key Pattern | Hammer at Support | Descending Triangle | Washout Doji |
| Today’s Bias | Cautious Long | Sell Rally | Buy the Dip |
| Main Risk | Oil spike > $83 | MA cluster rejection | Brent / Euro data |
| Main Catalyst | Jobless Claims (8:30) | Broadcom + Claims | Oil price + ECB tone |
Frequently Asked Questions — Index Markets March 5, 2026
Conclusion — What Experienced Traders Should Know Going Into Today
The global index landscape on March 5, 2026 is a study in fragile balance. Wednesday’s tech-led recovery offered genuine relief after four consecutive days of geopolitical shock selling. But experienced traders know better than to confuse a bounce with a trend reversal. The technical structures on both the Dow and DAX remain corrective, while the Nasdaq 100’s descending triangle pattern carries continuation risk. Three things matter most today: whether US Jobless Claims confirm labor market resilience, whether Brent crude holds below $82, and whether Wednesday’s reversal candles receive the follow-through volume they need to be trusted.
For active traders, the regime is clear: trade smaller, demand wider risk-reward ratios, and let the data lead — not the narrative. The Iran conflict introduces binary risk that no candlestick pattern can predict. Tight stops, asymmetric setups, and a clear plan for both upside and downside scenarios are not optional this week — they are table stakes.
Today’s Master Trade Framework
Three indices, three different profiles, one unifying truth: risk management is the edge in this environment.
Dow Jones (DJI)
Cautious long on dips to 48,200–48,400 if Claims ≤ 215K. Target 48,900 → 49,275. Stop: 47,700 close. Oil spike above $83 = immediate exit.
Nasdaq 100 (NDX)
Fade rallies into 24,950–25,100. Short target 24,300 → 24,000. Alt bull: close above 25,311 triggers long to 26,000. Pattern: descending triangle dominant.
DAX 40 (GDAXI)
Best medium-term buy-dip opportunity. Accumulate 23,700–23,950. Target: 24,500 → 25,000 → 25,507 (ATH). Stop: 22,900 daily close. LT bulls: year-end target 27,500.
Key Macro Trigger
US Jobless Claims at 8:30 AM ET. Below 210K = strong bull catalyst. Above 225K = risk-off. Brent crude remains the real-time macro dial for all three.
Risk Regime
VIX at 21.15 = elevated but declining. Trade at 50–70% normal position size. Widen stops proportionally. Avoid overexposure ahead of tomorrow’s NFP.
Outlook (24–48 Hr)
Lean modestly bullish on Dow/DAX IF Claims OK and oil calm. Lean bearish Nasdaq into resistance. Binary risk from Iran developments must be respected at all times.