Global Indices Under Fire: Dow Cracks, Nasdaq Falters, FTSE Holds | The Capital Dispatch — March 3, 2026
Daily Index Report
Updated 14:51 GMT
S&P 500 Defends 6,800 as Geopolitical Shock Reverberates; Nasdaq 100 Below 200-DMA While FTSE 100 Stages Tentative Recovery From Near-ATH Correction

Global equity indices are navigating one of 2026’s most consequential trading sessions. A live US–Iran military conflict is transmitting directly through the oil market — WTI has spiked 8%, threatening inflationary shocks to Fed policy expectations at a critical juncture. The Nasdaq 100 has broken below its 200-day moving average; the S&P 500 is defending its 2026 range floor at 6,800 for the fourth time; and the FTSE 100 is correcting sharply from its all-time high of 10,934. This edition provides full deep-dive technical analysis across all three major indices, economic calendar overlay, sector breakdown, and precise trade setups for today’s session.
The Shock That’s Driving Everything
Global equity markets are navigating one of the most complex risk environments in recent memory — a live military conflict between the United States, Israel, and Iran, now in its fifth day. US and Israeli forces carried out airstrikes; Iran’s IRGC claims a retaliatory missile strike on a US destroyer and supply ship. The Strait of Hormuz — through which approximately 13 million barrels of oil per day normally flow — has been effectively disrupted, with over 200 vessels reportedly waiting outside the chokepoint. JPMorgan warns that a continued closure could remove 4.7 million barrels per day from global supply by Day 18.
President Trump’s pledge to escort oil tankers with the US Navy partially calmed Tuesday’s session, allowing equities to recover from intraday lows. The S&P 500 cut its intraday loss from −2.5% to close at −0.94%; the Nasdaq recovered from −3% lows. However, diplomatic channels remain frozen and the conflict’s oil market transmission remains the principal macro risk for equities through Friday’s NFP.
High-Impact Events — Next 72 Hours
| Date / Time (GMT) | Country | Event | Previous | Forecast | Impact | Market Sensitivity |
|---|---|---|---|---|---|---|
| Wed 4 Mar · 01:30 | 🇦🇺 Australia | GDP Growth Q4 2025 (QoQ) | +0.3% | +0.4% | HIGH | AUD, ASX 200, risk sentiment |
| Wed 4 Mar · 09:30 | 🇬🇧 UK | Construction PMI (Feb) | 48.1 | 48.5 | MED | GBP, UK housebuilder stocks |
| Wed 4 Mar · 10:00 | 🇪🇺 Eurozone | Retail Sales (Jan, MoM) | −0.2% | +0.5% | HIGH | EUR, Euro Stoxx 50, consumer stocks |
| Wed 4 Mar · 13:15 | 🇺🇸 USA | ADP Non-Farm Employment (Feb) | 183K | ~150K | HIGH | S&P 500, Nasdaq, USD · NFP prelude |
| Wed 4 Mar · 15:00 | 🇺🇸 USA | ISM Services PMI (Feb) | 52.8 | 52.5 | ⚡ CRITICAL | All US indices, USD, rate expectations |
| Wed 4 Mar · 15:30 | 🇺🇸 USA | EIA Crude Oil Inventories | −2.3M bbl | −1.8M bbl | HIGH | WTI, Brent, energy stocks — critical vs Hormuz backdrop |
| Thu 5 Mar · 02:30 | 🇨🇳 China | Caixin Services PMI (Feb) + NPC Opens | 51.5 | 51.8 | HIGH | Hang Seng, commodities, global growth read |
| Thu 5 Mar · 12:00 | 🇪🇺 Eurozone | ECB Interest Rate Decision | 2.75% | 2.50% (−25bps) | ⚡ CRITICAL | EUR/USD, Euro Stoxx 50, FTSE via risk sentiment |
| Thu 5 Mar · 12:45 | 🇪🇺 Eurozone | ECB Press Conference (Lagarde) | — | Forward guidance critical | ⚡ CRITICAL | EUR, European equities, global risk tone |
| Thu 5 Mar · 23:50 | 🇯🇵 Japan | GDP Final Q4 2025 (QoQ) | +0.2% | +0.3% | HIGH | JPY, Nikkei 225 futures, BoJ rate path |
| Fri 6 Mar · 13:30 | 🇺🇸 USA | 🔥 Non-Farm Payrolls (Feb) | 130K (Jan) | ~60K | ⚡⚡ CRITICAL | S&P 500, Nasdaq, Dow, USD, Gold — all markets |
| Fri 6 Mar · 13:30 | 🇺🇸 USA | Unemployment Rate (Feb) | 4.4% | 4.4% | HIGH | Fed rate expectations, all risk assets |
| Fri 6 Mar · 13:30 | 🇺🇸 USA | Average Hourly Earnings (MoM) | +0.3% | +0.3% | HIGH | Inflation expectations, Fed path |

The Nasdaq 100 has shifted into short-term bearish territory following its failure to hold above the 25,300–25,500 resistance supply zone last week. The index has now crossed decisively below its 200-day moving average at 24,557 — a major structural signal. The pattern of lower highs since mid-January, combined with a Bearish Engulfing on the weekly chart that erased the prior week’s gains, confirms distribution. The descending triangle visible on the daily chart projects a measured move to 23,800–24,000 if the current low holds or breaks. RSI at 43.36 has not yet reached oversold territory, suggesting further downside pressure is possible before a technical bounce.
The Magnificent Seven trade is losing momentum: AI-capex enthusiasm is being offset by rising competition risk and the war-induced growth shock. Volume analysis shows elevated selling on down days with light participation on recovery attempts — classic distribution. Trade setup A (sell on rallies) targets 24,000 then 23,200; Trade setup B (counter-trend dip buy) only valid at 23,800–24,000 with a confirmed hammer + VIX below 20.

The S&P 500’s defining technical story in 2026 is a sideways-to-rolling range between 6,800 and 7,000 — statistically the tightest opening-year range since 1928. The geopolitical shock has now pierced the lower bound on an intraday basis (touching 6,648 on Tuesday), though closes have held above 6,800. Tuesday’s hammer-like recovery — from −2.5% intraday to close at −0.94% — signals that dip-buyers are not far below. Four consecutive tests of 6,800 in 2026 create an extremely important support cluster: multiple tests either build a very strong base or lead to an accelerated breakdown when the level ultimately fails.
The daily signal from Investing.com shows 8 sell vs 4 buy across the MA stack, while weekly and monthly signals remain Strong Buy — the bull market is not broken. The 200-DMA at 6,668 is the real battleground if 6,800 fails. Bollinger Band lower-band piercing historically signals a statistically elevated probability of mean-reversion bounce, but geopolitics can override this. Watch for the ISM Services PMI at 15:00 GMT as the key catalyst today.

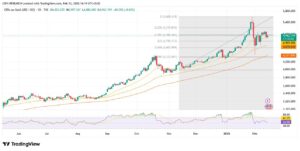
The FTSE 100 had one of its most remarkable starts in history — rising nearly 10% year-to-date through February, printing an all-time high of 10,934.94 on 27 February 2026. The ascending channel structure remains intact on the daily chart, with price now testing the lower boundary of that channel. This is fundamentally a geopolitical pullback within a structural bull market, not a trend reversal: the index remains well above its 50-day and 200-day moving averages (9,974), which is the most important technical context for longer-horizon positioning.
The Shooting Star on the weekly chart at the all-time high — one of the most reliable reversal patterns in classical technical analysis — confirmed the local top on February 27. Financial stocks suffered the most (HSBC −3.5%, Barclays −4%, Standard Chartered −3.5%), while BP edged positive on higher oil. The FTSE’s heavy weighting in energy, banks, and miners creates dual exposure: energy gains from Hormuz, while global growth fears weigh on miners. Near-term: sell into bounces at 10,550–10,650. Strategic dip-buy: 10,200–10,350 for a 2–6 week trade back toward 11,000.
All-Index Summary — March 4, 2026
| Index | Price | Daily Trend | RSI (14D) | MACD | Key Support | Key Resistance | Candle Pattern | Signal |
|---|---|---|---|---|---|---|---|---|
| Nasdaq 100 | 24,720 | Below 200-DMA · Lower Highs | 43.36 | Bearish crossover | 24,000 | 24,557 (200-DMA) | Bearish Engulfing Weekly | Sell / Short |
| S&P 500 | 6,816 | Range-Bound · 6,800 Tested | 43.03 | Bearish crossover | 6,800 | 6,932 (50-DMA) | Hammer (Tue intraday) | Caution / Watch 6,800 |
| FTSE 100 | 10,462 | Correcting from ATH · Channel | 47.72 | Bearish crossover at ATH | 10,211 | 10,571 | Shooting Star Weekly ATH | Sell Bounce / Dip Watch |
Performance Leaders / Laggards — March 3, 2026
| Asset / Sector | Performance (Tue) | Driver | Outlook (24h) |
|---|---|---|---|
| Energy (XLE) | +1–3% | WTI +8%, Hormuz fears — energy sector leads | OUTPERFORM |
| Aerospace & Defense (ITA) | +4–6% (record high) | War demand — Lockheed +6%, Northrop +5%, AeroVironment | OUTPERFORM |
| Cybersecurity | +1–2% | Elevated cyberattack risk warnings across critical infrastructure | WATCH |
| Materials (XLB) | −2.7% (worst sector) | Global growth fears; China demand concern | UNDERPERFORM |
| Industrials | −2.0% | Supply chain and energy cost pressure fears | UNDERPERFORM |
| Consumer Discretionary (XLY) | −1.5% | Higher gas prices; consumer spending squeeze | UNDERPERFORM |
| Financials (XLF) | −1.0% | Stagflation risk — HSBC −3.5%, Barclays −4% | UNDERPERFORM |
| Technology / Semis | −1.1% | Risk-off · Nvidia −1.3%, Tesla −2.7% | NEUTRAL |
| Gold (XAU/USD) | −3.44% ($5,129) | Profit-taking from ATH; USD safe-haven strength | WATCH |
| US 10-Yr Yield | 4.054% (near 11-mth low) | Flight to safety into bonds; equity risk premium rising | WATCH |
Critical Triggers & Decision Points — Next 24 Hours
| # | Trigger Event | Time (GMT) | Bullish Scenario | Bearish Scenario | Priority |
|---|---|---|---|---|---|
| 1 | Geopolitical Headlines — Iran/Hormuz | Ongoing | De-escalation; diplomatic channels open → risk-on, oil −5%+ | Further strikes; Hormuz fully closed → oil $90+, VIX 30+ | CRITICAL |
| 2 | ISM Services PMI (Feb) | Wed 15:00 | Beat above 53.5 → resilience narrative, S&P 500 bounce | Miss below 51 → stagflation fear amplified | HIGH |
| 3 | ADP Employment (Feb) | Wed 13:15 | >180K → labor holds, stocks relief rally | <100K → NFP anxiety spikes, indices sell lower | HIGH |
| 4 | EIA Crude Inventories | Wed 15:30 | Large build → supply ok, oil pullback supports equities | Large draw → validates Hormuz fears, oil extends gains | HIGH |
| 5 | S&P 500 — Hold or Break 6,800 | US Session | Close above 6,820 → dip buyers return, short-cover rally | Close below 6,750 → 200-DMA at 6,668 becomes target | HIGH |
| 6 | ECB Rate Decision | Thu 12:00 | Cut + dovish guidance → European equities rally, FTSE lifts | Hawkish surprise → EUR strengthens, equities fall | HIGH |
| 7 | China NPC — Fiscal Stimulus Target | Thu 02:30 | Aggressive stimulus → commodity stocks, miners bid (FTSE+) | Below-5.5% GDP target → global growth concerns worsen | MEDIUM |
| 8 | VIX Level Watch | Intraday | VIX fades below 20 → dip buyers return, range recovery | VIX spikes above 25–28 → forced selling, margin calls | MEDIUM |
The three most important events before Friday’s NFP: the ADP Employment Change at 13:15 GMT today, the ISM Services PMI at 15:00 GMT today, and the ECB rate decision Thursday at 12:00 GMT. Position sizing should remain conservative — a 30–50% reduction from normal — until geopolitical risk has a clearer resolution path. Protect capital first. The opportunities will be there when the dust settles.
Six Risks Every Index Trader Must Monitor Today
Active Index Trader FAQ — March 4, 2026
Not according to the weight of evidence — yet. The Nasdaq 100 has crossed below its 200-day moving average, which is a bearish short-term signal, but historically only 2 out of 13 Nasdaq corrections since 2003 have exceeded 20%. The current pullback from recent highs is approximately 10–12%. The broader bull market from 2023 remains structurally intact. Unless WTI oil sustains above $100 (a tail risk scenario), major bank strategists — Goldman Sachs, Wells Fargo, UBS — are maintaining year-end S&P 500 targets of 7,500–7,700. This is a risk-off correction within a bull market, not a structural reversal.
Iran’s disruption of the Strait of Hormuz — through which roughly 20% of global oil supply transits — is the single biggest risk factor for equities right now. JPMorgan estimates that by Day 8 of a full closure, approximately 3.3 million barrels per day of crude production would be shut in, rising to 4.7 million bpd by Day 18. This could push Brent toward $100+ and threatens significant equity damage. However, President Trump’s pledge to deploy the US Navy to escort tankers, if acted upon, would be a major de-escalation signal. Historical precedent — including the 1990 Gulf War — suggests disruptions beyond 3–4 weeks rarely materialize in their worst-case form.
Friday’s NFP is uniquely complex in the current environment. The consensus of approximately 60,000 jobs added for February is already historically soft. A miss (negative or near-zero NFP) might initially boost rate-cut hopes but could cascade into recession fears — a “bad news is bad news” outcome for equities. A surprise beat above 150K would trigger “higher-for-longer” Fed narrative, which also weighs on equities given oil-driven inflation. The cleanest scenario for stocks is a Goldilocks print of 80K–100K with +0.3% MoM wage growth. Traders should consider monitoring ADP today as a leading indicator and maintain reduced position sizes through the NFP print.
The FTSE 100 is a globally-exposed index — approximately 75–80% of its revenues are generated outside the United Kingdom. It is highly sensitive to geopolitical risk, commodity price swings, and global growth sentiment. The biggest weights are financials (HSBC, Barclays, Standard Chartered — all global banks) which have sold off sharply on stagflation and credit risk fears. The structural bull case — Bank of England rate cuts, attractive valuations, recovering UK productivity — remains fully intact. This is a temporary geopolitical pullback, not a fundamental story change for the FTSE.
The 6,800 level is the most critical near-term pivot, having been tested four times in 2026. A daily close decisively below 6,800 — particularly with negative geopolitical news flow — would open the door to 6,668 (200-day moving average). This is the ultimate bull-vs-bear battleground. If the S&P 500 defends 6,800 over the next one to three sessions, a counter-trend rally back toward 6,900–7,000 is plausible. For longer-term investors, the 200-DMA at 6,668 is the true “line in the sand” — below it, portfolio repositioning would be justified.
The clearest beneficiaries are Defense & Aerospace (Lockheed, Northrop, AeroVironment — the ITA ETF broke to all-time highs), Energy (Exxon, Chevron, BP — oil price tailwind), and Cybersecurity (elevated cyberattack risk drives demand). Gold remains a long-term safe haven but has seen short-term profit-taking from its recent all-time highs. The sectors to avoid include consumer discretionary (higher gas prices squeeze wallets), materials (global growth fears), and financials (stagflation risk). Defense and energy are the only two sectors in active bull trends during this specific risk episode.
Watch for this composite checklist: (1) Iran–US diplomatic channels reopening or ceasefire announcement; (2) WTI crude declining back below $70 sustainably; (3) VIX falling back below 18–20 on a closing basis; (4) S&P 500 closing back above 6,900 with two consecutive bullish days; (5) Nasdaq 100 reclaiming its 200-DMA on a weekly close; and (6) a solid NFP print Friday (above 80K). If three or more of these conditions are met within the next week, the pullback is likely over and the bull market resumes. If only one or two materialize, expect continued choppy trading with downside risk.
Today’s session is one of the most consequential of 2026. The US–Iran conflict is a genuine macro shock — not just geopolitical noise — because of its direct transmission through oil and potential to alter Federal Reserve policy expectations at the worst possible moment for inflation certainty.
For the Nasdaq 100: The story is simple and brutal — broken below the 200-DMA, lower highs confirmed, breadth deteriorating. Short on rallies toward 24,450–24,560. Only buy confirmed hammers below 23,800 with VIX below 20. Reduce position sizing to 50–70% of standard.
For the S&P 500: The 6,800 level is today’s single most important number. It has held four times. The daily signal is Sell, but Tuesday’s hammer recovery signals that dip-buyers are close. Cautious: short on break below 6,750; buy bounce only with bullish candle confirmation above 6,820.
For the FTSE 100: Correction from 10,934 to 10,484 (−4.1%) within a pristine structural bull trend. Near-term: sell into bounces at 10,550–10,650. Strategic dip-buy opportunity building at 10,200–10,350 for a 2–6 week trade toward 11,000. The bull thesis — BoE cuts, energy exposure, China stimulus — remains intact.
This report is produced for informational and educational purposes only. Nothing in this publication constitutes investment advice, a personal recommendation, or an offer or solicitation to buy or sell any financial instrument. Trading in indices, futures, CFDs, and leveraged products carries a high level of risk and may not be suitable for all investors. The value of investments can fall as well as rise, and you may lose more than your initial deposit. Past performance is not a reliable indicator of future results. Technical analysis, candlestick patterns, and trade setups described herein are not guarantees of future price movements. You should seek independent financial advice before making any trading decisions. All market data sourced from: Reuters, Bloomberg, CNBC, TradingView, Investing.com, JPMorgan — data as of approximately 14:51 GMT, March 4, 2026.