Trade FX, CFD, Stocks, BTC, Indices, Gold & Oil – 1:1000 Leverage & Bonus – CSFX

Mobile Header & Menu

Index Market Analysis — February 27, 2026 | Nasdaq 100, S&P 500 & FTSE 100 Deep Dive

February 27, 2026
CSFXadmin
Index Market Analysis — February 27, 2026 | Nasdaq 100, S&P 500 & FTSE 100 Deep Dive

Friday · 27 February 2026 · Pre-Market Edition

Market Intelligence Desk

Global Index Market Analysis

Nasdaq 100  ·  S&P 500  ·  FTSE 100  ·  Economic Calendar  ·  Trade Setups

High Volatility PPI Day AI Sell-Off FTSE Record High Futures Negative
S&P 5006,908.86▼ −0.54%
Nasdaq 10022,878▼ −1.18%
FTSE 10010,885▲ +0.36%
S&P Futures6,908.75▼ −0.16%
Nasdaq Futures25,071▼ −0.04%
VIX19.19▲ +3.01%
Gold$5,195▲ +0.03%
WTI Oil$65.10▼ −0.3%
US 10Y4.017%▼ −0.77%
S&P 5006,908.86▼ −0.54%
Nasdaq 10022,878▼ −1.18%
FTSE 10010,885▲ +0.36%
S&P Futures6,908.75▼ −0.16%
Nasdaq Futures25,071▼ −0.04%
VIX19.19▲ +3.01%
Gold$5,195▲ +0.03%
WTI Oil$65.10▼ −0.3%
US 10Y4.017%▼ −0.77%

01 · Market Snapshot

What Happened Yesterday — And Where We Stand Now

Thursday’s session was defined by a classic “sell-the-news” reaction to Nvidia’s blockbuster earnings. Despite the AI giant smashing every estimate on the board, investors locked in profits, sending tech indices sharply lower. Friday opens on a cautious note with all eyes on the 8:30 AM US PPI print.

Nasdaq 100 (NDX)
22,878
▼ −273.69 pts  ·  −1.18%
Thu Close · 52w High: 26,182 · 52w Low: ~20,400
Neutral Daily
S&P 500 (SPX)
6,908
▼ −37.27 pts  ·  −0.54%
Thu Close · Fib Pivot: 6,893 · VIX: 19.19
Neutral Daily
FTSE 100 (UKX)
10,885
▲ +38.54 pts  ·  +0.36%
Live London Session · 52w High: 10,885 · Record Zone
Record High
🔴 Key Risk Factor — Nvidia Contagion
Thursday’s tech rout was led by Nvidia shedding 5.5% despite record Q4 revenue of $68.13 billion (beat by $1.9bn) and Q1 guidance of $78bn (well above the $72.8bn consensus). Broadcom, Lam Research, Micron and Applied Materials fell between 5–7%. The iShares software ETF (IGV) is now down over 10% in February alone. Markets remain in “prove it” mode on AI capital expenditure expectations.
🟡 Macro Backdrop — Tariffs & Iran
President Trump defended his tariff agenda during Tuesday’s State of the Union. The Supreme Court struck down the IEEPA emergency tariffs; Trump swiftly replaced them with a 10% tariff under Section 122 of the Trade Act. Indirect US–Iran nuclear talks resumed in Geneva. WTI crude sits near $65, keeping energy markets on edge.

Global Index Performance Overview

Index Close / Live Change % MTD % YTD % Trend Bias
Nasdaq 100 22,878 −1.18% −2.5% +~6% Consolidation / Bearish Short
S&P 500 6,908 −0.54% −0.4% +~4% Neutral / Range Bound
FTSE 100 10,885 +0.36% +6.5% +~12% Bullish / Record High
Dow Jones 49,499 +0.03% +1.2% +~2% Mild Bullish
DAX (Germany) 25,175 +0.76% +4.5% +~12% Bullish
Nikkei 225 56,825 −1.12% −2.1% −3% Weak / Bearish
Hang Seng 26,413 −1.10% −2.3% +~8% Mixed / Volatile
ASX 200 9,081 −0.05% +0.6% +~3% Neutral

02 · Economic Calendar

High-Impact Events: Friday 27 February 2026

The headline event for today’s session is the US Producer Price Index (PPI) release at 8:30 AM ET — a data point that will directly influence Fed rate-cut expectations and set the tone for risk appetite into the weekend. Multiple events span global time zones requiring careful positioning management.

Time (ET) Country Event Impact Forecast Previous Market Risk
00:30 🇯🇵 Japan Tokyo CPI (Feb) HIGH ~2.6% 2.5% YoY Nikkei, USD/JPY
00:30 🇯🇵 Japan Unemployment Rate (Jan) MED 2.5% 2.4% JPY pairs
01:00 🇨🇳 China Manufacturing PMI (Feb) HIGH 49.8 50.1 Hang Seng, Commodities, Risk Sentiment
01:00 🇨🇳 China Non-Manufacturing PMI (Feb) HIGH 52.3 52.2 Global Risk / AUD
01:30 🇦🇺 Australia Private Credit (Jan) MED +0.6% +0.5% AUD, ASX 200
02:00 🇬🇧 UK GDP (Q4 2025 Revised) HIGH −0.1% QoQ −0.1% QoQ FTSE 100, GBP/USD, BoE expectations
02:00 🇬🇧 UK Business Investment (Q4) HIGH −0.3% −0.2% GBP, FTSE
03:00 🇪🇺 Europe German Retail Sales (Jan) MED +0.5% −1.6% EUR/USD, DAX
05:00 🇪🇺 Europe Eurozone CPI Flash (Feb) HIGH 2.3% YoY 2.5% ECB rate cut bets, EUR pairs, Euro Stoxx
08:30 🇺🇸 USA PPI Final Demand MoM (Jan) HIGH ⭐ +0.3% +0.5% S&P 500, Nasdaq, Fed expectations — HEADLINE EVENT
08:30 🇺🇸 USA Core PPI MoM (Jan) HIGH ⭐ +0.3% +0.7% Nasdaq 100, Fed pivot pricing
10:00 🇺🇸 USA Construction Spending (Jan) MED +0.2% +0.5% Industrials sector
11:30 🇺🇸 USA Atlanta Fed GDPNow (Q1 update) MED 3.1% 3.1% USD, broad sentiment
13:00 🇺🇸 USA Baker Hughes Rig Count LOW 409 Oil, energy stocks
15:30 🇺🇸 USA CFTC S&P 500 Speculative Positions MED −177.8K net Market sentiment indicator
🟢 PPI Scenario Analysis — The Trade That Matters Today
Bull case (PPI ≤ +0.2%): A softer-than-forecast print boosts Fed rate-cut expectations, likely driving a relief rally in Nasdaq and S&P 500 futures. Watch for a retest of 6,950–6,980 on the S&P 500 and 23,200–23,400 on Nasdaq 100.

Bear case (PPI ≥ +0.5%): A hot number would reinforce “higher-for-longer” fears, amplifying the tech sell-off. S&P 500 could test the critical 6,764 support level with Nasdaq 100 risks extending toward the 22,300–22,500 Fibonacci zone.

03 · Technical Analysis

Deep Dive: Three Major Indices

Full technical breakdown including trend structure, key price levels, moving average alignment, RSI/MACD readings, candlestick patterns and high-probability trade setups for the next 24 hours.

Nasdaq 100
NDX · NQ Futures · CME
22,878
▼ −273.69 (−1.18%) Thursday Close

Trend Structure & Price Action

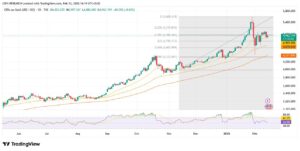
The Nasdaq 100 entered February 2026 in a mature bull market, but the month has exposed cracks beneath the surface. The index has now broken below the floor of its medium-term rising trend channel, a structure that had held since the April 2025 lows. This month is tracking as the worst February performance since March 2025, and the worst monthly result since the April tariff shock. The broader pattern forming across timeframes resembles a potential Double Top, with the October 2025 high and the late-January 2026 high acting as twin peaks — historically a meaningful reversal warning.

That said, the weekly chart signal remains “Strong Buy” on Investing.com’s MA analysis (12/0 buy signals across MA5–MA200), suggesting the longer-term bull structure is not yet broken. This divergence between short-term deterioration and long-term strength is the defining tension for the Nasdaq right now.

Resistance R2
23,800
Resistance R1
23,200
Fibonacci Pivot
25,316
Key Support S1
22,300
Support S2
22,000
200-DMA
~22,500
RSI (14D)~45Falling / Neutral
MACDNarrowingBearish crossover risk
50-DMA24,896Price below
200-DMA~22,500Near-term support
Daily SignalNeutralInvesting.com
Weekly SignalStrong BuyStructural trend intact
Feb SeasonalityNegativeAvg: −1.2% (25yr)
VIX Correlation19.19Elevated / Risk-off

Candlestick Patterns

🕯️
Bearish Engulfing — Daily Chart (Feb 26)
Thursday’s long red candle fully engulfed Wednesday’s modest green body, completing a classic bearish engulfing formation at the resistance zone near 23,150. This is a high-probability reversal signal, especially after a multi-week rally. Confirmation comes with a follow-through red day on Friday, which futures are suggesting at open.
📊
Potential Double Top — Weekly / Monthly Chart
Twin peaks near 25,800–26,000 (November 2025 and January 2026) with a valley around 24,000 form a textbook Double Top. A confirmed break below the neckline at ~23,400 would signal a measured move target of approximately 21,000–21,400. This remains the key pattern to watch over the next 2–4 weeks.
📉
Inside Day Risk — Pre-market Feb 27
With futures modestly lower pre-open, there is potential for an inside-day candle on Friday if the PPI print is near-consensus. An inside day at this support level would be interpreted as market indecision — watch for a directional breakout on Monday’s open for confirmation of the next swing.
🔴 Bearish Setup — Preferred Scenario (65% Probability)
Entry Zone
22,950–23,100
Stop Loss
23,450 (above R1)
Target 1
22,400 (200-DMA)
Target 2
22,000–22,300
Trigger: Short on any bounce toward the 22,950–23,100 zone, especially if PPI reads hot (≥ +0.4%). The post-Nvidia sell-off thesis remains intact as long as price holds below the 4H MA200. Risk-Reward: ~1:2.5.
🟢 Bull Setup — Counter-Trend (35% Probability)
Entry Zone
22,300–22,500
Stop Loss
21,900
Target 1
23,200
Target 2
23,800
Trigger: PPI soft print (≤ +0.2%) driving a dip-buy at the 200-DMA / Feb Fib retracement zone. March seasonality historically turns bullish — institutional dip-buyers may re-emerge here. Requires volume confirmation on the breakout candle.
S&P 500
SPX · ES Futures · CME
6,908
▼ −37.27 (−0.54%) Thursday Close

Trend Structure & Price Action

The S&P 500 has been range-bound between 6,800 and 7,000 since the start of December 2025. The February close is tracking a modest loss of 0.4%, but the broader bull structure remains intact — the weekly signal is “Strong Buy” and the monthly signal is equally bullish. Thursday’s close at 6,908 sits just above the critical Fibonacci pivot at 6,893, which has acted as a decisive swing point in recent sessions.

The most important observation for Friday is the S&P futures reading at 6,908.75 with a −0.16% dip pre-market. This puts price directly on the pivot, and the PPI data at 8:30 AM will almost certainly determine the day’s direction. The majority of S&P 500 stocks actually closed higher on Thursday — Nvidia’s 5.5% decline simply overwhelmed positive breadth, which is actually a constructive sign for the bulls.

Resistance R2
6,979–7,049
Resistance R1
6,923–6,952
Critical Pivot
6,866
Support S1
6,803–6,842
Key Support S2
6,764
Deep Support S3
6,683
RSI (14D)~50Neutral zone
MACDFlatNo clear signal
Fib Pivot6,893Investing.com daily
Daily SignalNeutral6 Buy / 6 Sell MAs
Weekly SignalStrong BuyLong-term intact
AAII Bull %33.2%4-week declining low
Feb MTD−0.4%Fading month
BreadthPositiveMajority stocks rose

Candlestick Patterns

🕯️
Shooting Star / Bearish Pin Bar — Daily
Thursday’s session printed a long upper wick on the 6,946 intraday high before closing near lows at 6,908 — a classic shooting star formation that signals rejection of higher prices. This is especially meaningful at a prior swing high zone. Sellers clearly stepped in aggressively after the morning open, pushing price back below the pivot.
📊
Bull Flag / Descending Channel — Intraday (4H)
On the 4-hour chart, the S&P 500 is forming a descending channel off the February highs near 7,050. Price is approaching the lower channel boundary near 6,880–6,900. A clean bounce off this zone combined with bullish PPI data would qualify as a valid bull flag breakout targeting 6,980–7,050.
🔴 Bearish Setup — Continuation (55% Probability)
Entry Zone
6,893–6,910 (below pivot)
Stop Loss
6,955
Target 1
6,842–6,827
Target 2
6,764
Trigger: Confirm daily close below 6,866 pivot. Hot PPI (+0.5%+) would act as the catalyst. The 6,764 level has been a stress-tested support since December 2025 and would be a high-conviction long zone on re-test. Risk-Reward: ~1:2.
🟢 Bull Bounce Setup (45% Probability)
Entry Zone
6,860–6,880
Stop Loss
6,810
Target 1
6,952
Target 2
6,979–7,000
Trigger: Soft PPI print + reclaim of 6,893 Fibonacci pivot on 1H candle close. Strong breadth (majority positive stocks Thu) supports a dip-buy narrative. Targeting the upper bound of December–February consolidation range. Risk-Reward: ~1:2.3.
FTSE 100
UKX · Z Futures · ICE
10,885
▲ +38.54 (+0.36%) Friday Live Session

Trend Structure & Price Action

The FTSE 100 is the standout global performer of 2026, and that story has intensified this week. The UK blue-chip index is trading at all-time record highs above 10,885 — up more than 23% over the past 12 months. This divergence from US tech indices reflects the FTSE’s structural advantage: it is dominated by globally-focused, internationally-priced companies in banking, mining, defence and energy — sectors that are thriving precisely as US mega-cap tech struggles.

HSBC Holdings’ 7.6% surge to a record high on the back of outstanding wealth management results was the catalyst for Tuesday’s breakout above 10,800. Rolls-Royce — the “FTSE’s answer to Nvidia” — added 5.1% on the same day Nvidia fell 5.5%, illustrating the sector rotation theme perfectly. The RSI has tipped into overbought territory, suggesting consolidation or a minor pullback is increasingly likely in the near term, but the blue-skies momentum argues for targets toward 11,000.

Next Target
11,000
Record High
10,885+
Trend Support
10,650
Support S1
10,500
Deep Support S2
10,250
Feb Low
10,100
RSI (14D)Overbought>70 — caution zone
TrendStrong UpRising since Apr 2025
52W Change+23.41%Outperforming S&P
UK GDP Q4−0.1%Contracting economy
HSBC+7.6%Record high, key driver
Rolls-Royce+5.1%Defence / AI power
Monthly SignalStrong BuyStructurally bullish
GBP/USD~1.3400Weak GBP tailwind
⚠️ FTSE Risk Factor: UK GDP Q4 Revised Release Today
The UK GDP Q4 2025 revised figure is due at 07:00 GMT. The advance estimate showed a contraction of −0.1% QoQ, and a confirmed negative print could pressure GBP/USD and trigger profit-taking in the FTSE. However, because the FTSE 100 is internationally-focused (over 70% of revenues from outside the UK), the domestic economic weakness has historically been a minor headwind compared to USD weakness and commodity price strength.

Candlestick Patterns

🚀
Breakaway Gap & New All-Time High Continuation
Tuesday’s +1.09% close at 10,797 was followed by continuation to a record 10,885. The weekly candle is a strong bullish continuation bar with little upper wick — a sign of sustained buying rather than speculative overextension. Record highs made on expanding volume are bullish until proven otherwise.
⚠️
Possible Doji / Evening Star Risk — Weekly Chart
If Friday closes flat to negative, the weekly chart would print a high-wave doji at record territory. Combined with overbought RSI, this is a classic setup for a minor 1–2% pullback to the 10,650 support zone. This would represent a healthy correction within the broader bull trend and a potential re-entry opportunity.
🟢 Bullish Continuation (60% Probability)
Entry Zone
10,820–10,860
Stop Loss
10,680 (below last week’s low)
Target 1
11,000
Target 2
11,200
Trigger: Intraday pullback on UK GDP data followed by a reclaim of 10,880. HSBC, Rolls-Royce and miner momentum remain the key drivers. A weak GBP further benefits the internationally-exposed names. Risk-Reward: ~1:2.5.
🔴 Overbought Fade (40% Probability)
Entry Zone
Short near 10,880–10,900
Stop Loss
11,050
Target 1
10,650
Target 2
10,500
Trigger: Negative UK GDP + global risk-off from hot US PPI. The overbought RSI and “prove it” mood on global indices creates a window for a mean-reversion trade. Use tight stops — the bull trend is strong. Risk-Reward: ~1:2.5.

04 · Macro Themes & Drivers

The Forces Moving Markets Right Now

🤖 AI Capital Expenditure — The Core Debate

The market’s central tension is not whether AI is real — it clearly is — but whether the extraordinary capex programmes at Microsoft, Amazon, Google and Meta are being priced in with sufficient discipline. Nvidia CEO Jensen Huang publicly argued markets “got AI wrong” on software disruption, and his Q1 guidance of $78 billion reinforces that demand remains red-hot at the infrastructure level. But traders are asking the harder question: when does this spending translate into earnings at the application layer?

Until that question is answered, every earnings report from an AI-adjacent name will be stress-tested. The IGV software ETF’s 10%+ February decline is the market’s answer in real time.

🏛️ Fed Policy — Rate Cut Timeline

The Federal Reserve is in a data-dependent holding pattern. Initial jobless claims came in at 212,000 (below the 216,000 consensus), confirming the labour market remains historically tight despite tech layoffs. Today’s PPI release is the final significant inflation datapoint before the next Fed meeting. Markets are currently pricing approximately two rate cuts in 2026, but a hot PPI print would push back those expectations and rattle growth stocks.

AAII bullish sentiment has fallen for four consecutive weeks to just 33.2% — from a recent high of 44.4% — suggesting the retail investor community is rapidly losing confidence. This contrarian indicator argues against aggressive buying right now.

🌍 Trump Tariffs — Evolving Picture

The Supreme Court struck down the IEEPA-based emergency tariffs last week. Trump moved quickly, replacing them with a 10% tariff under Section 122 of the Trade Act of 1974 — a more legally robust mechanism. The State of the Union confirmed tariffs remain a central policy pillar. Markets have largely absorbed this news, but renewed escalation toward China (potential 25%+ rates) or Europe would be a fresh shock catalyst.

🇬🇧 FTSE Divergence — Why UK Outperforms

The FTSE 100’s remarkable run — up 23% in 12 months and hitting all-time records above 10,885 — is no accident. The index structure is approximately 70% internationally-focused revenues, meaning a weaker pound actually helps. Defence spending across Europe is surging, directly benefiting BAE Systems, Rolls-Royce and Babcock. HSBC’s wealth management and Asian banking franchise is booming. Mining stocks gain from strong copper and precious metals pricing. The UK’s “boring” sectors are the 2026 market winners.

Sector Performance Monitor

SectorIndexThu PerformanceFeb MTDKey DriverOutlook
SemiconductorsNDX−5 to −7%−12%Nvidia sell-off, AI capex doubtCautious
AI/Software (IGV)NDX/SPX−2 to −4%−10%+AI automation disruption fearsBearish ST
Financials (XLF)SPX+1.7%+3%Strong banking earnings, ratesBullish
UK Banks (HSBC/Lloyds)FTSE+5 to +8%+8%HSBC record, wealth divisionStrong Bull
UK Defence (RR/BAE)FTSE+5%+7%NATO spending, AI power demandStrong Bull
Mining (Fresnillo/Anto)FTSE+4 to +7%+6%Copper/gold at elevated levelsBullish
Consumer StaplesSPXMixed+1%Defensive rotationNeutral
UK Consumer (Diageo)FTSE−13%−15%Dividend cut, profit warningBearish

05 · Frequently Asked Questions

Active Traders Ask

Answers to the most relevant and market-moving questions facing professional index traders today.

Q: Is the Nasdaq 100’s sell-off a buying opportunity or the start of something worse?
The evidence is genuinely mixed. On one hand, the weekly and monthly technical signals remain “Strong Buy” and the long-term AI growth narrative is intact — Nvidia’s $78bn Q1 guidance confirmed infrastructure spending has not peaked. On the other hand, the short-term pattern shows a potential double top, the RSI trend is falling, and the IGV software ETF has now lost 10%+ in a single month. The most prudent read is that this is a correction within a bull market rather than a full bear cycle — historical data shows Nasdaq corrections since 2003 have exceeded 10% only thirteen times. The 22,300–22,500 zone (Fibonacci retracement / 200-DMA) is the level every serious trader is watching for a higher-probability long entry.
Q: Why is the FTSE 100 at record highs when the UK economy is technically contracting?
This is the great paradox of the FTSE 100 and it confuses retail investors most. The index is not a barometer of the UK economy — it is a collection of globally-operating multinationals who happen to be listed in London. Over 70% of FTSE 100 revenues are generated outside the UK. When the pound weakens (as it has this month), overseas revenues translate back to more pounds, boosting reported profits. HSBC makes most of its money in Asia. Shell and BP price in dollars. Rolls-Royce wins defence contracts across Europe and North America. Mining stocks track global commodity prices. A sluggish UK GDP print actually tends to weaken GBP, which ironically boosts FTSE valuations.
Q: How should I trade around the PPI data release at 8:30 AM ET today?
For experienced traders, the core rule is: do not enter new positions into the data. Let the initial 5-minute candle after the release print, confirm direction, and then trade the follow-through with defined risk. A “soft” PPI (≤ +0.2%) historically gives at least 15–20 minutes of directional clarity before a reversal is possible — this is your window for a momentum entry on the long side in S&P 500 or Nasdaq. A “hot” PPI (≥ +0.5%) typically produces a sharp 20–40-point drop in S&P 500 futures followed by a “dead cat bounce” — the entry for shorts is on that bounce into the 6,893–6,910 resistance zone, not at the initial low.
Q: What does the declining AAII sentiment reading mean for markets?
The AAII (American Association of Individual Investors) bullish sentiment has fallen to 33.2% — down from 44.4% just four weeks ago. From a contrarian perspective, falling sentiment is actually a mildly bullish signal: when retail investors are pessimistic, there is less marginal selling pressure ahead, and professional “dumb money” fade strategies become less effective. However, sentiment is not a timing tool — it indicates the conditions for a potential recovery rally rather than confirming an immediate bounce. The key trigger would be a positive macro catalyst (soft PPI, better-than-expected China PMI) that changes the narrative and forces bearish retail positioning to unwind.
Q: Is the AI-driven growth story truly at risk, or is this just healthy profit-taking?
The AI infrastructure story is not at risk — Nvidia’s Q4 revenue of $68.13 billion (up 73% year-on-year) and Q1 guidance of $78 billion make that clear. What the market is repricing is the application layer valuation premium. Software companies that sold at 30–40x revenue on the assumption that AI would accelerate their growth are now being reassessed as AI tools potentially automate some of their core product functionality. This is a nuanced repricing, not a collapse of the AI thesis. Chips, data centre infrastructure, and AI power names remain structurally bullish. Software companies need to demonstrate genuine AI-driven revenue before the premium returns.
Q: What are the key levels to monitor on the S&P 500 for a potential trend change?
The S&P 500 has been range-bound between 6,800–7,000 since December 2025. A daily close below 6,764 (the December 2025 and early February 2026 stress-tested support) would be the first genuine warning signal, opening a path toward 6,683. A break above 7,000 and sustained holding above that level (daily close) would confirm the resumption of the primary uptrend and could trigger a momentum surge toward 7,200–7,300. In the current consolidation, avoid trading the middle of the range and focus on reactions at the extremes.
Q: Can the FTSE 100 realistically reach 11,000?
In the near term (4–6 weeks), yes — 11,000 is the natural next target with blue-sky conditions above 10,885. The structural drivers (defence, banking, mining, weak GBP) all remain in play. The primary risk is a global risk-off event — a major escalation in geopolitical tensions, a hard US recession, or a commodity price collapse — that would drag the mining and energy sectors lower. On pure technical analysis, with the weekly chart in a clear uptrend and record highs printing on expanding volume, the path of least resistance is toward 11,000 over the next 4–8 weeks, with strong support at 10,650 on any pullback.

06 · Conclusion

Today’s Trading Playbook — Bottom Line

February 27, 2026 is a session defined by a single data point: the 8:30 AM ET US PPI release. Everything else — candlestick patterns, pivot levels, trend signals — is secondary until that number prints. Here is the complete directional summary for each market.

Master Summary — 24-Hour Outlook

  • Nasdaq 100: Bearish bias (65%). Short on bounces toward 22,950–23,100. Watch 22,300–22,500 as high-probability support for counter-trend long. Key risk: hot PPI accelerates sell-off toward 22,000.
  • S&P 500: Neutral with downside risk (55%). Critical pivot at 6,866 — a daily close below opens 6,764 target. Soft PPI could trigger bull bounce to 6,952–6,979. Range 6,800–7,000 remains the defining structure.
  • FTSE 100: Bullish (60%) but overbought. Trend favours 11,000 target. Intraday pullbacks on UK GDP data are buy-the-dip opportunities at 10,820–10,860. Tight stop below 10,680.
  • PPI Catalyst: Soft (≤ +0.2%) = risk-on, buy dips. In-line (+0.3%) = range continues, no clear trend. Hot (≥ +0.5%) = sell rallies, defensives outperform.
  • China PMI: A sub-50 Manufacturing PMI print adds Asia-Pacific risk-off pressure and weighs on mining/commodity stocks globally.
  • Weekly Close: February ends today. Month-end flows and position squaring could amplify any directional move post-PPI in the final 2 hours of the US session.

Key watchlist: NVDA reaction, IGV ETF, GBP/USD, US 10Y yield response to PPI, and VIX direction at 9:30 AM open.

Risk Disclosure: This analysis is published for informational and educational purposes only and does not constitute financial advice, a solicitation, or a recommendation to buy or sell any financial instrument. Index trading and CFD trading involve a high level of risk and may not be suitable for all investors. Past performance is not indicative of future results. All levels, targets and stop-loss values are based on current technical analysis and may change materially with new data. Always conduct your own due diligence and consult a qualified financial advisor before making any trading decisions. The author and publisher accept no liability for any trading losses incurred.