Silver Market Outlook Today | XAG/USD Technical Analysis & Trade Signals – March 20, 2026
Silver Market Outlook: XAG/USD
Technical & Fundamental Analysis
⚠️ Risk Disclosure: This report is for informational and educational purposes only and does not constitute financial advice. Trading precious metals involves significant risk of loss. Past performance does not guarantee future results. Always conduct your own due diligence before trading.
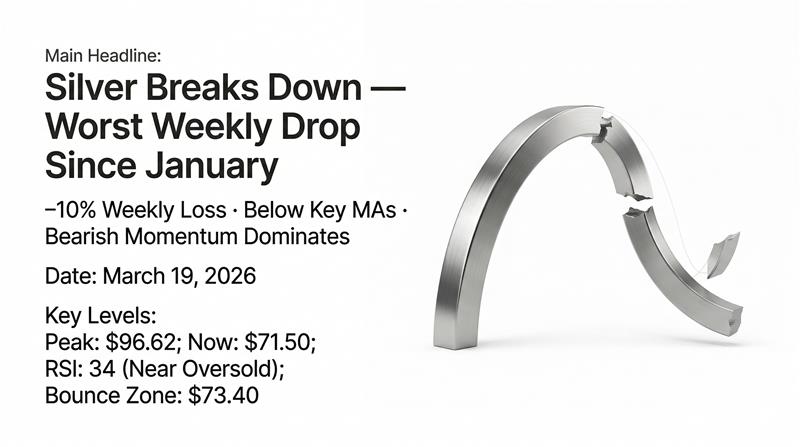
Silver Crashes to 6-Week Lows – Worst Week Since January
Silver (XAG/USD) is on pace for its worst weekly decline since January 2026, having shed over 10% this week amid a toxic combination of USD strength, rising inflation fears tied to the Iran war, and a hawkish Federal Reserve hold. Having peaked near $96.62 earlier this month, silver has collapsed below critical moving averages and now trades near $71.50. With RSI approaching oversold territory at 34 and MACD firmly negative, the path of least resistance over the next 24 hours remains to the downside — though a potential dead-cat bounce toward the $73.40 pivot is possible.
Daily / 5H / 1H
Weekly / Monthly
XAG/USD — Full Technical Breakdown (Next 24 Hours)
Silver’s technical picture is unambiguously bearish across all short-term timeframes. The metal has broken below all three major moving averages — 20-day, 50-day, and 100-day SMA — confirming that sellers firmly control price action heading into the March 20 session.
🔴 Bearish Signals
- ✗ Price below 20-day SMA ($84.70)
- ✗ Price below 50-day SMA (declining)
- ✗ Price below 100-day SMA ($73.40)
- ✗ MACD below signal line — negative histogram widening
- ✗ RSI at 34 — approaching but not yet oversold
- ✗ ATR elevated — rising volatility confirms sellers
- ✗ Descending trendline remains intact
- ✗ Break of structure (BOS) confirmed lower
🟢 Potential Counterarguments
- ✓ RSI nearing oversold (below 30 = bounce risk)
- ✓ Session low $65.51 — strong selling exhaustion
- ✓ Weekly + Monthly tech = BUY
- ✓ 200-day SMA rising long-term
- ✓ $64.08 is major historical support
- ✓ Gold-silver ratio at 80:1 — deeply stretched
Support & Resistance Map — 24H Focus
| Type | Level (USD/oz) | Significance | Action Zone |
|---|---|---|---|
| R3 | $84.70 | 20-Day SMA — Key resistance zone | Strong sell on retest |
| R2 | $77.60 | Prior support flipped resistance | Sell on bounce |
| R1 | $73.40 | 100-Day SMA — near-term pivot (current area) | Watch for rejection |
| R0 | $72.81 | Prior session close — immediate resistance | Short bias active |
| CURRENT | ~$71.50 | Live spot price — in free-fall zone | Caution — high volatility |
| S1 | $65.51 | Session low March 19 — key intraday | Watch for bounce |
| S2 | $64.08 | Feb 6 swing low — major support | Potential reversal |
| S3 | $60.00 | Psychological round number | Extreme scenario |
⚡ Recommended Trade Setup — Next 24 Hours
Short BiasSentiment Gauges — 24H
Top News Drivers Impacting Silver — March 20, 2026
🗓 Key Events Impacting Silver — Next 24 Hours (March 20–21, 2026)
-
02:30 IST
Iran-Israel War Escalation Updates HIGH IMPACTAny ceasefire signals → USD weakens → Silver spike. Escalation → further silver decline via risk-off USD buying and demand destruction fears.
-
08:30 EST
US Jobless Claims (Weekly) HIGH IMPACTWeak claims data → rate cut bets rise → USD dip → Silver relief bounce possible. Strong data → opposite effect, extends silver decline.
-
10:00 EST
Philadelphia Fed Manufacturing Index MEDIUMWeak print supports silver via rate cut expectations. Strong print bearish for silver — confirms inflation persistence.
-
Throughout
Strait of Hormuz Shipping News HIGH IMPACTIsrael stated Iran “no longer able to enrich uranium.” Any formal ceasefire or de-escalation would sharply boost silver as a risk asset while removing safe-haven USD premium. Watch for Netanyahu and Trump statements throughout session.
-
14:00 EST
Fed Speakers (Various FOMC Members) MEDIUMPost-FOMC commentary may clarify dot-plot trajectory. Dovish tone = silver relief. Hawkish confirmation = further pressure.
-
Post-Market
EIA Oil Inventory Report MEDIUMBuilds (bearish oil) → may ease inflation fears marginally → slight silver relief. Draw (bullish oil) → higher inflation expectations → silver pressure continues.
Silver Market FAQ — March 20, 2026
Silver Bears Dominate — But Eyes on $64.08 Support & Ceasefire Risk
Silver (XAG/USD) enters March 20, 2026 under severe technical and fundamental pressure. The convergence of a hawkish Fed, a strong USD, and leveraged fund deleveraging has created one of the worst weekly declines for the metal since January. With price below all short-term moving averages, RSI near 34, and MACD firmly in negative territory, the path of least resistance over the next 24 hours remains bearish.
The primary bear target is a retest of the $65.51 session low, with a potential extension toward the critical $64.08 February swing low. Any sustained close below $64.08 would signal a deeper corrective phase toward $60. However, traders must be alert to a potential sharp reversal catalyst: any credible ceasefire announcement in the Iran war would simultaneously weaken the USD, boost risk appetite, and trigger a powerful short-covering rally potentially toward $77–$84.
For long-term investors, silver’s structural story remains compelling — supply deficits, record industrial demand, and a gold-silver ratio at 80:1 versus historical 15–20:1 suggest the metal is deeply undervalued on a multi-year basis. Short-term pain may represent a medium-term buying opportunity.