The Dollar Ratio Masterclass: 110 Years of Cycles, War & What We Cannot Name — Capital Street FX
Every Dollar Index Ratio
Is at an Extreme.
110 Years of History Says
This Is What Comes Next.

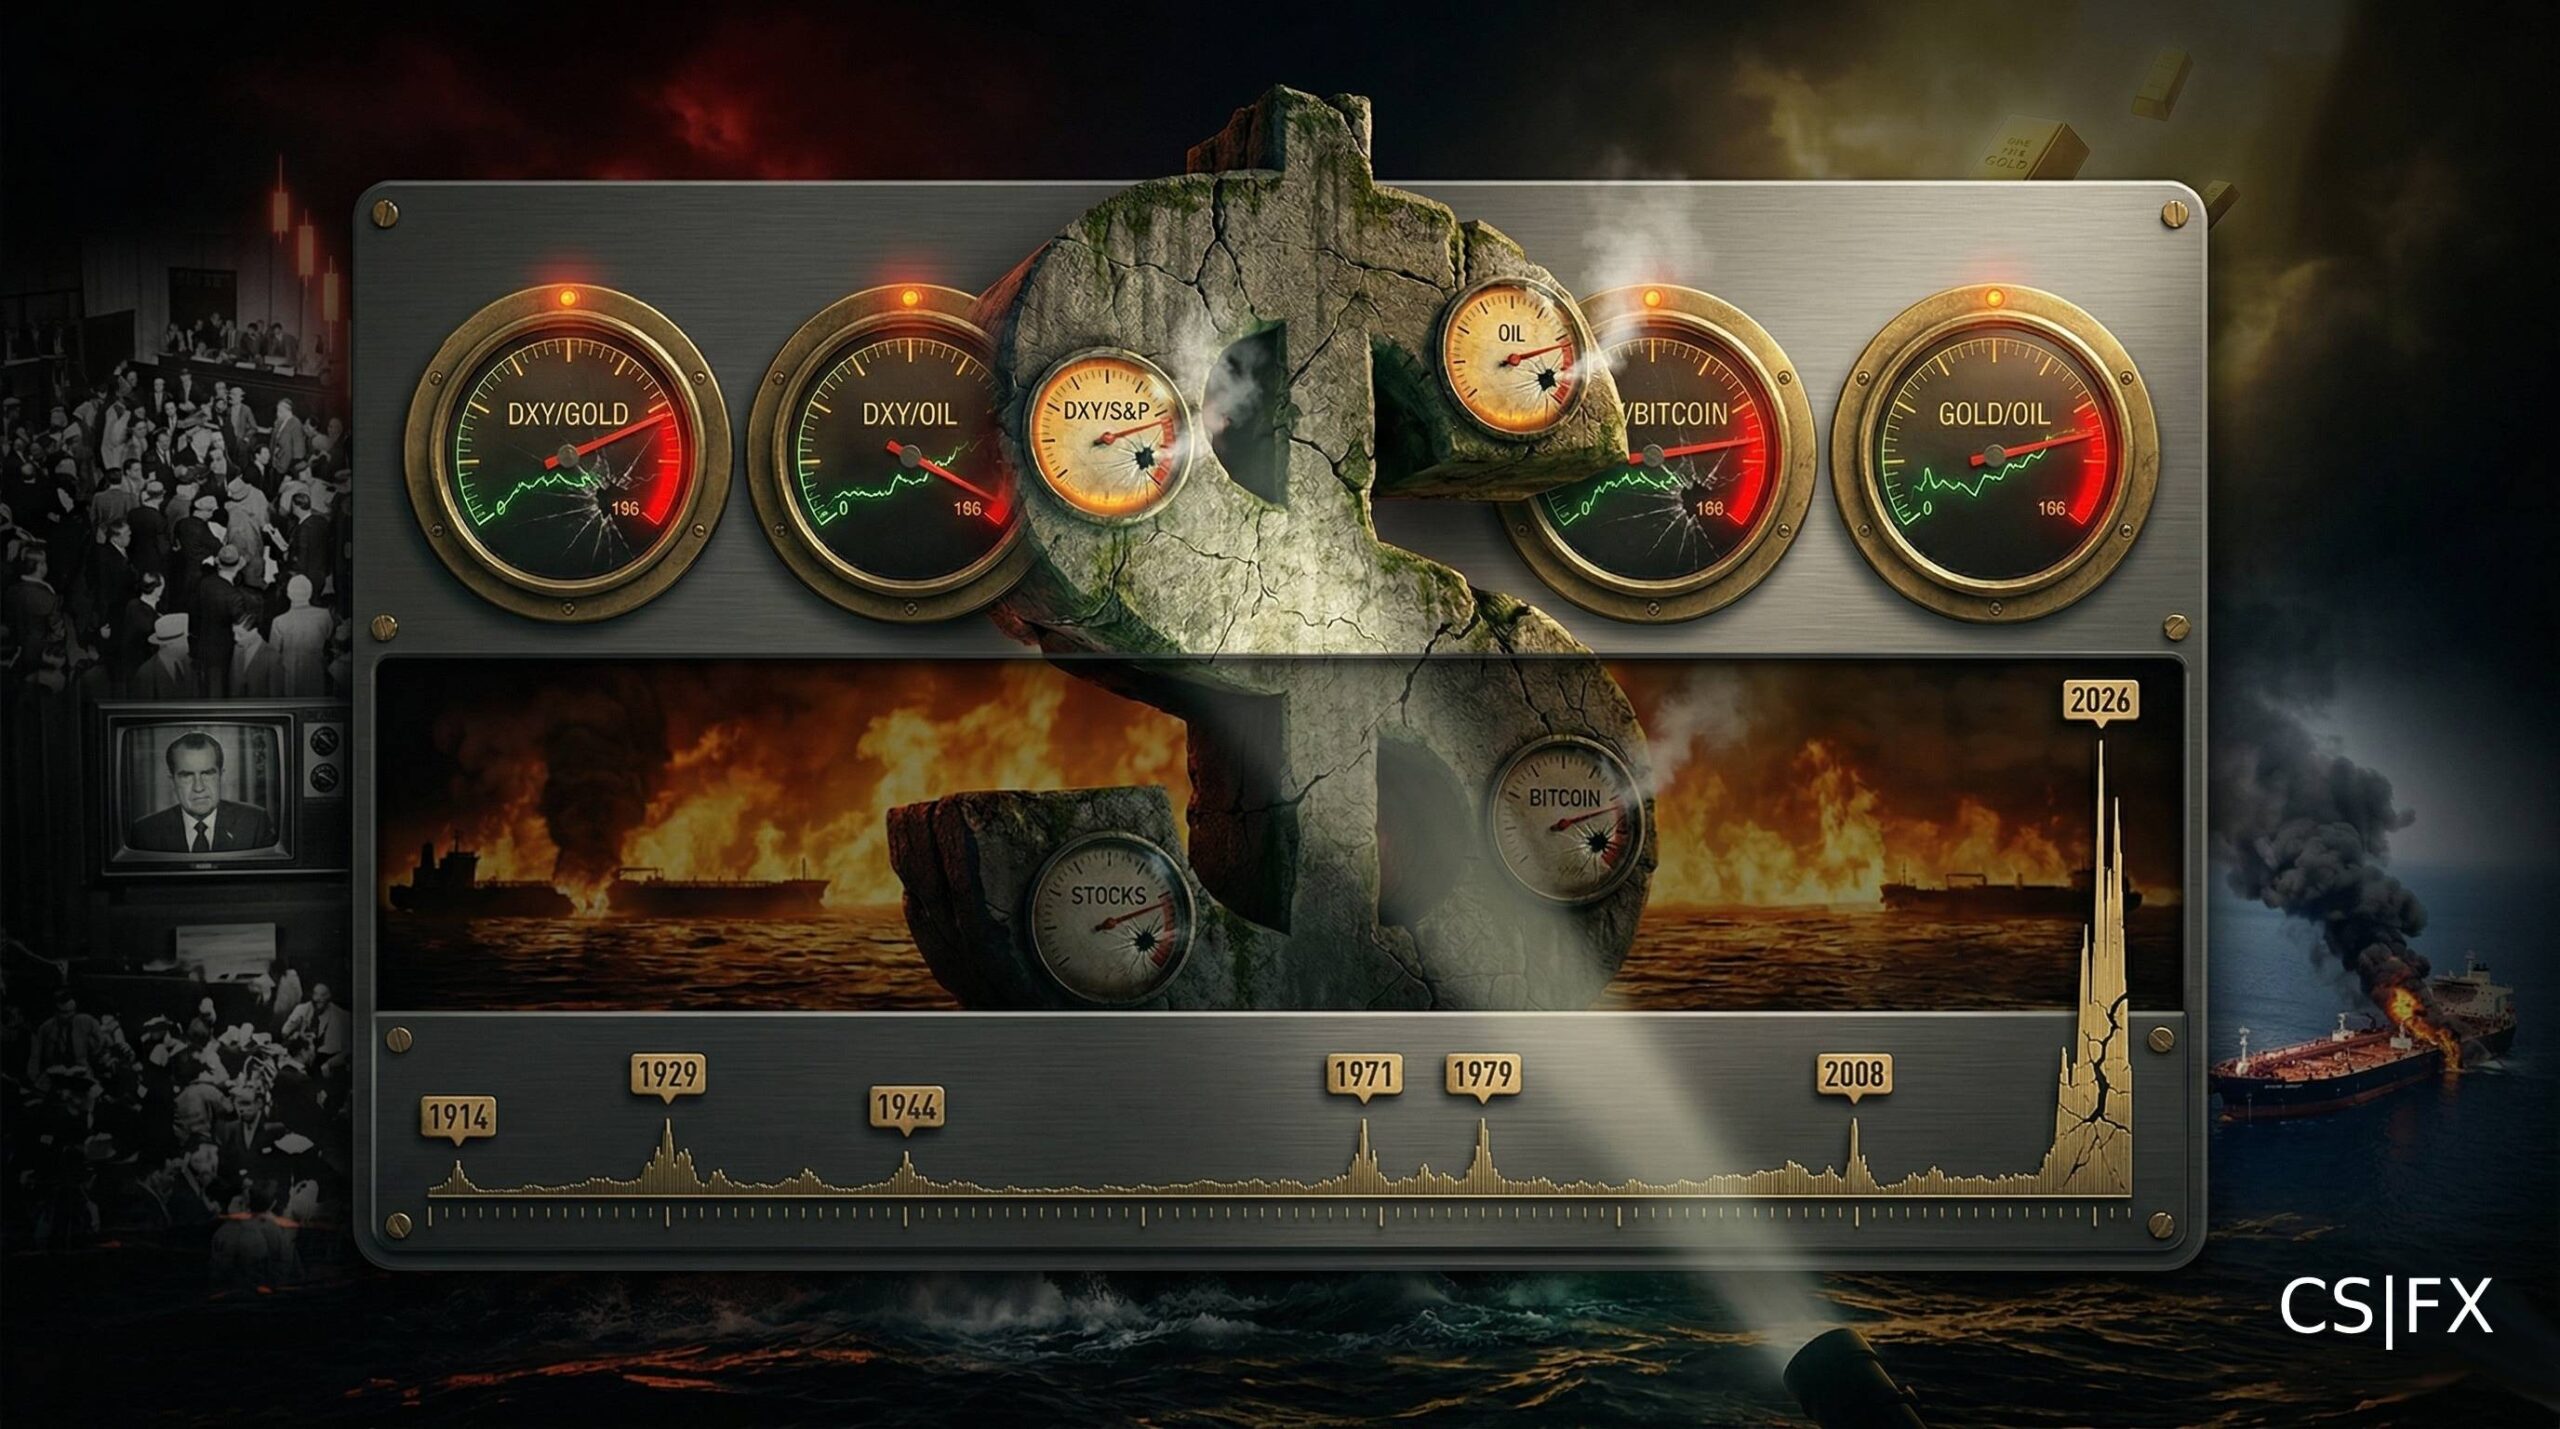
For the first time in recorded history, all five key dollar ratios — against gold, oil, equities, and Bitcoin — are simultaneously at 50-year extremes. The last time even two of them converged like this, the system reset: 1971, 1979, 2008. A war has now sealed the world’s most important oil chokepoint for 23 days. The Fed is paralysed. The data from 110 years of dollar cycles points to a resolution. Whether that resolution is up, down, or something no model has yet named — this is the complete picture.
Live Ratio Snapshot — March 22, 2026
Bars show stress percentile vs 53-year DXY history. Red = maximum stress.
There is a specific feeling that comes before a major market shift. Not panic. Not euphoria. Something quieter and more unsettling than both. It is the feeling of standing in a room where all the instruments are giving readings they have never given simultaneously before — and every rational voice is saying something different about what it means.
That is where we are right now. The DXY/Gold ratio is at its lowest reading in 53 years — lower than when Lehman Brothers failed and the world stopped. The dollar cannot buy a single barrel of Brent crude per index unit. Gold put in its best annual gain since 1979 — the year before everything broke. A war that began 36 hours after peace was described as “within reach” has produced events in three weeks that no model placed above single-digit probability the morning before they occurred.
The five key ratios that have tracked the dollar’s purchasing power across 110 years of wars, crashes, and monetary resets are all simultaneously at or near 50-year extremes. The last time something close to this happened — 2008 — the resolution was Lehman, QE, zero rates, and the invention of Bitcoin. Before that — 1971 — it was Nixon closing the gold window on a Sunday night with 48 hours’ notice.
We do not know what the resolution looks like this time. That is not false modesty. Nobody does. The data says the spring is coiled. It does not say which direction the door flies open. It could be a managed de-escalation that unwinds the war premium and sends oil back to $75 in a fortnight. It could be power plants struck and Brent at $200 by next weekend. It could be a global liquidity event that crashes everything simultaneously the way 2008 did — gold included — before a massive monetary response drives it all to new highs. Or it could be something that currently has no name and no probability assigned to it, the way every truly consequential market event did before it happened.
What follows is 110 years of data showing you exactly how this kind of coiled-spring moment has resolved every time before. The conclusion is not a price target. It is a probability distribution — and the most honest thing this analysis can tell you is that 35% of that distribution currently has no name.
What Is the DXY — and Why Ratios Matter More Than the Index Alone
The index number in isolation is meaningless. The ratio against real assets tells the whole 110-year story.
The DXY launched at 100 on March 1, 1973 — the day Bretton Woods finally died. Every reading since is measured against that starting gun. Its all-time high: 164.72 in February 1985 (Volcker era). All-time low: 70.70 in March 2008 (commodity peak). Today: 99.29 — and the number itself tells you almost nothing.
Here is the part most traders miss: a DXY of 99 in 2026 is not the same as a DXY of 99 in 1997. In 1997, 99 DXY bought you approximately $325 of gold. Today, 99 DXY buys you $4,502 of gold. Same index reading. 93% less purchasing power. The DXY number is a score in a currency beauty contest between six fiat currencies — Euro (57.6%), Yen (13.6%), GBP (11.9%), CAD (9.1%), SEK (4.2%), CHF (3.6%). It tells you nothing about what the dollar actually buys in the real world.
What tells you that is the ratio of DXY against real assets — gold, oil, equities, and Bitcoin. These ratios have traced deep, repeating supercycles across 110 years. Right now, all four are at historic extremes simultaneously. That has happened before. It has never ended quietly.
The Gold Standard Era — WWI to Bretton Woods (1914–1944)
Before the DXY existed: how wars destroy currencies and why the 1970s playbook — and the 2026 playbook — started in 1914.
The modern dollar ratio story begins not in 1973 when the DXY was created, but in 1914 — the year the global gold standard collapsed under the weight of World War I. Everything since has been a variation on the same theme.
Under the classical gold standard (1870–1914), all major currencies were fixed to gold. The US dollar was convertible at $20.67 per troy ounce. One British pound was worth $4.86. There were no floating ratios; just fixed conversion tables enforced by law. The ratio of dollars to gold was immovable — the only period in modern financial history when a ratio truly could not move.
World War I (1914–1918) shattered this arrangement overnight. Britain, France, and Germany suspended gold convertibility immediately upon declaration of war, printing money to fund armies and munitions. By 1919, European currencies had lost 50–90% of their pre-war gold value. The dollar, backed by the world’s largest gold reserves and an emerging creditor position, emerged as the de facto global reserve currency — not by design, but by the elimination of all alternatives.
The Great Depression (1929–1933) delivered the next major ratio reset. President Roosevelt’s Executive Order 6102 in April 1933 confiscated private gold holdings, forcing citizens to sell at $20.67/oz. The government then repriced gold to $35/oz overnight — a deliberate 69% devaluation of the dollar against gold. This was the first modern currency-to-gold ratio reset by government fiat. The pattern it set — fiscal stress → government gold repricing — has repeated in every major monetary crisis since.
“War → fiscal expansion → money printing → currency debasement → real asset repricing. This sequence has repeated without exception for 110 years. The only variable is the timeline.”
— Capital Street FX Historical Analysis, March 2026Bretton Woods — The Dollar’s Golden Age (1944–1971)
The architecture of dollar supremacy, the fatal flaw that doomed it, and the 48-hour weekend that ended it.
The Bretton Woods Conference of July 1944 established the post-war monetary order that would define the dollar’s global role for the next 27 years. The architecture was elegant in its simplicity: 1 USD = 1/35th of a troy ounce of gold. All other currencies fixed to the dollar. The US, holding two-thirds of the world’s monetary gold reserves and the only major economy undamaged by war, was the logical anchor.
For two decades, this system worked flawlessly. The dollar/gold ratio was fixed at $35/oz by law. The Bretton Woods era (1944–1971) is the only period in modern history when the dollar was not subject to ratio cycles — it was simply defined. Dollar reserve share reached approximately 90% of global reserves by 1960. The Marshall Plan had exported dollars across Europe. The petrodollar system was emerging. The dollar was, in every meaningful sense, the world’s money.
The fatal flaw was identified by economist Robert Triffin in 1960: to supply the world with reserve currency dollars, the US had to run chronic balance of payments deficits. Those deficits would eventually undermine confidence in dollar-gold convertibility. Vietnam War spending (1965–1975) — costing the equivalent of $840 billion in 2026 dollars — accelerated this contradiction to breaking point. By 1971, the US held only $10 billion in gold against $85 billion in dollar obligations held overseas. France, under De Gaulle, had been demanding gold for dollars since 1965.
On August 15, 1971, President Nixon ended dollar-gold convertibility in a surprise Sunday evening television announcement. Gold began its first free-market price discovery in 40 years. Within 9 years, it rose from $35 to $850/oz — a 2,329% move. The DXY was created in March 1973 precisely to measure the dollar’s value in the new floating-rate world. The ratio era had begun. It has not ended since.
The 9 Dollar Supercycle Phases (1914–2026)
Complete annotated timeline — gold prices, DXY levels, key events, ratio signals, and what each phase means for 2026.
Gold Standard Collapse & Dollar Ascent
WWI suspends European gold convertibility. Dollar emerges as de facto reserve currency by elimination. Roaring Twenties credit boom inflates asset prices to extreme ratios. 1929 Crash triggers Great Depression. Dollar remains gold-convertible at $20.67/oz — the last stable ratio era in financial history. The lesson: when dollar credibility is absolute, ratio cycles cannot exist.
FDR Gold Confiscation & 69% Overnight Devaluation
Executive Order 6102 (April 1933) forces gold sale at $20.67/oz, then government reprices gold to $35/oz — a 69% dollar devaluation in one stroke. Gold Reserve Act (1934) enshrines this. WWII drives US deficit to 119% of GDP by 1946. Bretton Woods (1944) re-pegs global currencies to dollar-at-$35/oz. Dollar becomes the unchallenged global reserve. The lesson: governments reprice gold rather than accept austerity when fiscal pressure peaks — a template directly relevant to $35 trillion of US debt today.
Bretton Woods — Dollar as the World’s Money
US holds 2/3 of global gold reserves (≈574M oz). Marshall Plan exports dollars worldwide. $35/oz gold peg holds for 27 years. Dollar reserve share: ~90% by 1960. Vietnam War spending ($840B in 2026 dollars) blows out US deficit. France demands gold for dollars. By 1971: $10B gold vs $85B in overseas dollar claims. Triffin Dilemma reaches its terminal conclusion. The lesson: reserve currency status is not permanent — it ends when the issuer can no longer defend the implicit promise.
Nixon Shock, OPEC Embargo & DXY Birth — The Direct 2026 Precedent
Nixon closes gold window August 15, 1971. DXY created at base 100 in March 1973. 1973 Arab oil embargo: oil quadruples in months. Gold rises from $35 to $850 (+2,329%). DXY falls from 120 to 84 (−30%). DXY/Gold ratio collapses to then-all-time low. CPI peaks at 14.8% (1980). Stagflation decade. This is the most direct precedent for 2026’s ratio readings. Iran war = oil shock. Fed boxed in by debt = unable to do full Volcker. DXY/Gold at 2.206 today mirrors the 1979 reading just before gold’s final blow-off to $850.
Volcker Shock — DXY All-Time High 164.72
Fed Chair Volcker hikes rates to 20.5% (June 1981). Breaks inflation at the cost of deep recession (GDP −2.5% in 1982). Dollar surges to its all-time high of 164.72 (Feb 1985). Gold crashes from $850 to $280 (−67%). DXY/Gold ratio fully recovers to highest-ever levels. Real interest rates deeply positive — kills gold. This remains the ONLY period in history where today’s DXY/Gold ratio extremes could theoretically reverse quickly. The question for 2026: can the Fed hike to 20% with $35T in debt? Most analysts say no. Which means the ratio extreme may persist or deepen.
Plaza Accord — The One Time Dollar Weakness Was Official Policy
G5 nations (US, UK, France, W.Germany, Japan) sign the Plaza Accord (Sept 22, 1985) to deliberately weaken the dollar and correct US trade deficits. DXY falls 40% in two years — from 164 to 85. The first and only time a major dollar decline was a deliberate multilateral policy. Japanese yen doubles vs dollar, sowing seeds of Japan’s 1990 bubble. Gulf War (1990) briefly spikes oil. Lesson: engineered currency devaluations have unintended consequences that last decades.
The Clinton Bull Run — Dollar Reserve Share Peak
Balanced budgets, tech boom, and global dollar demand push DXY to 121 (2001). Gold falls to $252/oz — its lowest point in the post-Bretton Woods era. Dollar reserve share peaks at ~71% in 1999. Euro launches January 1, 1999. Dot-com bubble inflates DXY/S&P to its all-time extreme. 9/11 (2001) and the Iraq War mark the beginning of the end of this dollar supremacy cycle. The lesson: even the most powerful dollar bull market contains the seeds of its own reversal through overvaluation.
China Supercycle, GFC & Bitcoin’s Birth
DXY falls from 121 to its all-time low of 70.70 (March 2008) as China-driven commodity demand, Iraq War deficits, and the GFC unfold. Gold rises from $252 to $1,921 (+662%). Oil spikes to $147 (July 2008). DXY/Oil hits its 2008 nadir — until 2026. GFC triggers QE; Bitcoin is born on January 3, 2009 with Satoshi embedding “Chancellor on brink of second bailout for banks” in the genesis block. Bitcoin was created as a direct response to the dollar system fragility these ratios measure.
QE Era, Crypto Emergence & Dollar Recovery
Gold peaks at $1,921 (Sep 2011), enters a multi-year correction. DXY recovers from 70 to 114 (Sep 2022) as Fed tapers QE and eventually hikes. Bitcoin goes from $0.06 (2010) to $69,000 (Nov 2021) — the most extreme ratio compression in financial history. COVID (2020) triggers $5T of fiscal stimulus. Gold reaches $2,075 ATH (Aug 2020). Dollar reserve share continues declining from 71% to 59%. Russia-Ukraine (2022) pushes DXY to 114 — its highest since 2000. Era ends with inflation at 40-year highs and the seeds of Phase 9 planted.
Debasement Era Accelerates — Five Simultaneous Ratio Extremes
DXY falls from 114 to 95.55 (2026 low). Gold rises from $1,600 to ATH $5,595 (Feb 28, 2026) — a 60% gain in 2025 alone, the biggest annual move since 1979. Bitcoin rises to ATH $126,198 (Oct 2025) before falling 44% to $70,800. S&P 500 AI-driven bull market reaches 6,506. Dollar reserve share: ~57% — lowest since at least the 1970s. Iran war begins February 28, 2026. Hormuz blocked. Oil at $106. ALL FIVE RATIOS AT SIMULTANEOUS EXTREMES. The DXY/Gold ratio at 2.206 is below the 2008 crisis trough. The era of maximum fragility has arrived.
DXY / Gold — The Monetary Credibility Ratio
The purest measure of dollar purchasing power vs the 5,000-year monetary standard. Now at its most extreme reading in 53 years of tracked history.
The DXY/Gold ratio is the single most important ratio in this analysis. It is not a gold price forecast. It is a measurement of the gap between what the dollar claims to be worth and what it can actually purchase in the asset that has served as money for 5,000 years.
Today’s reading of 2.206 (×100) mirrors the late 1979 level — just before gold made its final blow-off move to $850/oz. In November 1979, the ratio was approximately 2.4. Gold then rose a further +70% in 12 weeks before the Volcker shock reversed it. The critical question for 2026: can a Volcker-style response (rates to 20%+) happen with $35 trillion in US national debt? At $35T, a 1% rate rise costs the US government an additional $350 billion per year in interest. A 20% rate environment would require approximately $7 trillion in annual interest payments alone — roughly twice the entire current federal budget.
The structural forces driving this compression are three-fold. First, central banks are buying gold at a 16-year high, averaging 950+ tonnes per year. Second, the Federal Reserve faces a stagflation trap — oil at $106 creates inflation, but cutting rates risks further dollar debasement. Third, the Iran war has added a geopolitical risk premium that did not exist in the 1979 analogy: the Strait of Hormuz is physically blocked, and the IEA has called this the largest supply disruption in oil market history.
In November 1979, DXY/Gold was at ~2.4 — above today’s 2.206. Gold then rose +70% in 12 weeks. Volcker reversed it by hiking to 20.5%. Today’s ratio is lower than 1979’s, the Fed funds rate is at 3.5% (not 20%), US debt is $35T (not $1T in 1979), and a war is actively blocking 20% of global oil supply. The structural case for the 1970s outcome — gold continues higher — is stronger in 2026 than it was in 1979. The only question is whether a Volcker-equivalent response is politically and fiscally possible. The evidence says no.
DXY / Oil — The Petrodollar Stress Test
Oil is the dollar’s deepest geopolitical anchor. When this ratio breaks down, the entire system strains. It is breaking down now.
The petrodollar arrangement — struck between the US and Saudi Arabia in 1974–1975 in the aftermath of the OPEC embargo — was the economic foundation of dollar reserve status after Bretton Woods collapsed. In exchange for US security guarantees, Saudi Arabia agreed to price all oil exports in dollars and recycle surpluses into US Treasuries. This created structural demand for USD that persisted for 50 years.
The DXY/Oil ratio currently sits at 0.933 — meaning the world’s reserve currency cannot purchase a single barrel of the commodity that powers the global economy, measured against its own benchmark index. In 1999 (DXY 121, oil $10/bbl), one dollar’s worth of the DXY basket bought 12.1 barrels of oil. Today (DXY 99, oil $106), it buys 0.93 barrels. The dollar has lost 92% of its oil purchasing power since the late 1990s. This compression is more severe than at the 2008 oil peak of $147.
The Iran war’s closure of the Strait of Hormuz has pushed this ratio to extremes not seen since the 2008 crisis trough of 0.91. The Strait normally handles 20 million barrels per day — approximately 20% of global oil supply. The IEA’s March 2026 Oil Market Report calls this the largest supply disruption in the history of the global oil market. Gulf production has been cut by at least 10 mb/d. Oil stored at sea is “quickly falling.” If Brent reaches $120 — which it touched intraday last week — the DXY/Oil ratio falls to 0.827, the lowest reading in recorded history.
DXY / Bitcoin — The 21st Century Ratio (2009–2026)
Born in a financial crisis, Bitcoin has created the most extreme ratio compression in financial history. But in 2026’s war cycle, it’s behaving like a tech stock — not gold.
Satoshi Nakamoto’s genesis block contains an embedded message: “The Times 03/Jan/2009 Chancellor on brink of second bailout for banks.” Bitcoin was, from its first moment, a direct response to the exact forces driving the DXY/Gold and DXY/Oil ratios to extremes today. It was designed as an alternative to the system these ratios measure.
The DXY/BTC ratio’s journey: DXY/BTC was effectively infinite at Bitcoin’s birth (price ~$0.0008 in 2010) → 0.001402 today (March 2026). In ratio terms, DXY went from buying infinite Bitcoin to buying 0.001402 BTC per index unit. The ratio has compressed by a factor of roughly 68,000× in 16 years. No asset in recorded financial history has compressed its ratio against a major currency this dramatically in this short a time period.
| Halving Event | Date | Price at Halving | Subsequent ATH | % Gain to ATH | DXY at Halving |
|---|---|---|---|---|---|
| 1st Halving | Nov 28, 2012 | $12.35 | $1,163 (Nov 2013) | +9,316% | ~80.0 |
| 2nd Halving | Jul 9, 2016 | $650 | $19,783 (Dec 2017) | +2,943% | ~96.0 |
| 3rd Halving | May 11, 2020 | $8,740 | $69,000 (Nov 2021) | +690% | ~100.0 |
| 4th Halving | Apr 20, 2024 | $63,900 | $126,198 (Oct 2025) | +97% | ~106.0 |
The critical 2026 divergence: Bitcoin is NOT behaving like digital gold during the Iran war. While gold rose from $2,870 to its ATH of $5,595 (+95% in 15 months), Bitcoin fell from its $126,198 ATH (Oct 2025) to ~$70,800 today (−44%). The BTC/Gold ratio compressed from 27× to 15.7×. Data from February–March 2026 shows Bitcoin’s correlation with the Nasdaq-100 at approximately +0.72 — meaning Bitcoin is trading as a risk asset, not a safe haven. When Brent surged past $100, equities fell and Bitcoin fell with them. Gold did the opposite. The market is making a clear distinction: gold = monetary reserve collateral. Bitcoin = speculative monetary asset still in price discovery, with an institutional floor that has not yet been tested in a full global recession.
DXY / S&P 500 — The Equity Purchasing Power Gauge
How many units of the S&P 500 one dollar-basket buys has compressed to near 20-year lows — while the Fed is signalling rates will stay elevated.
The DXY/S&P 500 ratio (currently 15.26 ×1,000) measures the dollar’s purchasing power in the US equity market. When the ratio is low, equities are expensive relative to the dollar’s real purchasing power — whether because stocks are overvalued, the dollar is undervalued, or both.
In 2000 (DXY 121, S&P 1,480), the ratio was approximately 81.8 ×1,000 — meaning the dollar had 5.4× more equity purchasing power than it does today. Today’s reading near its 20-year low is consistent with an equity market priced at peak-cycle valuations against a backdrop of a weakening dollar. The post-2009 QE era inflated this ratio extreme systematically: cheap money drove equities while printing debased the dollar simultaneously.
The Federal Reserve’s March 18, 2026 decision crystallised the challenge. Voting 11-1 to hold at 3.50–3.75%, the Fed acknowledged “tension between goals” — inflation heading higher from oil costs, growth softening from the war premium. Powell did not say stagflation. He described it precisely. JPMorgan now models zero rate cuts for all of 2026. Futures markets have priced the first cut out to December 2026 at the earliest. Kevin Warsh, expected to replace Powell around May, is characterised as hawkish. The rate tailwind that inflated this ratio over the past decade is not just absent — it is reversing.
The S&P 500 fell 1.36% on Fed day (March 18) — its worst rate-decision performance since December 2024. The Dow is down more than 5% month-to-date: its worst month since 2022. The VIX at 26.78 is elevated but not panicking. Consumer staples led the decline. Amazon fell 2.5%. Defence stocks and energy producers are the only S&P sectors with positive earnings convexity across the current environment. Both equities and Treasuries fell together on March 18 — the classic “everywhere risk” environment that signals systemic stress, not sector rotation.
The 2026 Iran War — Day 23 Full Asset Impact
February 28 to March 22: the complete timeline, every significant event, and the full pre-war vs post-war asset pricing table.
On February 27, 2026, Oman’s Foreign Minister announced a breakthrough: Iran had agreed to IAEA verification and never to stockpile enriched uranium. Peace was “within reach.” Talks were set for March 2. Thirty-six hours later, the US and Israel had launched nearly 900 strikes in 12 hours. Supreme Leader Khamenei was dead. The Strait of Hormuz was closed. The most important data point in this analysis is not any ratio reading. It is the 36-hour gap between “peace within reach” and 900 strikes. It tells us exactly how reliable the consensus probability framework is in this environment.
The war produced events in the first three weeks that had collectively been assigned near-zero probability by every major financial model: Iran firing an ICBM at Diego Garcia (4,000km range never previously demonstrated), mutual strikes on nuclear research facilities (Dimona and Natanz, both), Kuwait’s Mina al-Ahmadi refinery (730,000 bpd) hit by drones, Qatar’s Ras Laffan LNG complex struck, Saudi Arabia receiving three ballistic missiles targeting Riyadh, and the USS Gerald R. Ford carrier withdrawing to Crete after fire and mechanical failures.
On Sunday March 22, President Trump posted a 48-hour ultimatum: reopen Hormuz or the US will “obliterate” Iran’s power plants, starting with the largest. Iran’s military immediately declared: power plant strikes will trigger indefinite Hormuz closure and attacks on all US/Israel-linked energy infrastructure across the Middle East. Iran simultaneously announced it is exploring “monetising control” of the Hormuz — moving from blockade to revenue extraction. This is the most directionally binary 48-hour window in the oil market since the 1991 Gulf War.
| Asset / Instrument | Live Price (Mar 22, 2026) | Pre-War Feb 27 | Change | 1-Yr Change | DXY Ratio | Signal | Trade Stance |
|---|---|---|---|---|---|---|---|
US Dollar Index DXY · ICE |
99.29 |
95.96 | +3.47% | −5.2% from Jan 2025 peak | — | Safe haven vs debasement tug | Watch 96 / 102 |
Gold Spot XAU/USD |
$4,502 |
$2,870 (1yr ago) | −19.4% from ATH $5,595 | +57% YoY | 2.206 (53yr low) | Structural bull intact | Buy dips |
Brent Crude Oil Brent Crude |
$106.41 |
$72.10 | +47.6% | +49% YoY · 52WK HIGH $119.50 | 0.933 (near 2008 low) | IEA: largest disruption ever | Options only |
Bitcoin BTC/USD |
$70,800 |
$84,000 (pre-war) | −15.7% | −43.9% from Oct 2025 ATH | 14.02 (×10,000) | Risk asset, not safe haven | Accumulate <$72k |
S&P 500 SPX |
6,506 |
~6,050 (pre-war) | −5.2% MTD (worst since 2022) | VIX: 26.78 (+11.3% Fri) | 15.26 (×1000) | 3 bull assumptions challenged | Buy 4,900 dip / own defence |
US 10yr Treasury US 10yr |
4.391% |
4.12% | +27bps | Rising — stagflation trap | Inverse to DXY | Fed on hold — 1 cut max 2026 | 2yr long; avoid 10yr+ |
Defense Sector LMT · RTX · GD · NOC |
+8–15% sector |
Pre-war baseline | +8–15% | Outperforming all sectors | Inverse USD | Multi-year procurement locked | Structural buy |
EM Bonds / FX India, Egypt, Pakistan |
Under pressure |
Stable | −3 to −8% | Deteriorating | Oil import exposed | Triple squeeze: oil + FX + food | Reduce |
Iran War — 5 Scenario Models with Asset Targets
Four named scenarios plus one that cannot be named — with specific price targets, timelines, and the revised probability framework that ratio extremes demand.
The conventional scenario table makes a hidden assumption: that the analyst has correctly enumerated the full outcome space. Given that this war started 36 hours after peace was “within reach,” and has produced a Diego Garcia ICBM, mutual nuclear-site strikes, and the largest oil supply disruption in history in its first three weeks, that assumption deserves explicit scrutiny.
- Trump power-plant ultimatum not acted upon; Iran signals on Hormuz
- Partial Hormuz opening emerges by week 5–6, full by week 10
- Fed resumes easing path; risk-on returns
- Bitcoin biggest beneficiary as geopolitical ceiling removed
- Gold holds structural bid; war premium partially unwinds
- War settles into attritional phase; partial contested Hormuz opening
- Oil holds $90–110 through H2 2026
- Stagflation embeds: Fed on hold all year, one cut max
- Gold grinds higher as monetary debasement thesis strengthens
- Bitcoin range-bound; ETF floor holds; S&P earnings compressed
- Power plants struck; Iran closes Hormuz indefinitely as promised
- Saudi Abqaiq targeted; Gulf infrastructure broadly hit
- Global CPI re-accelerates above 5%; Fed forced into policy error
- Dollar reserve share accelerated decline; EM crisis emerges
- Gold to $5,500–7,000; Bitcoin acute sell-off then recovery
- Unknown trigger → cross-asset liquidation; DXY paradox spike 106–112
- Gold Phase 1: falls 25–35% in liquidity panic, then recovers to $6k–$8k
- S&P trough: 3,600–4,400 (35–45% from Feb 2026 peak)
- Fed restarts QE; dollar structural collapse resumes
- Bitcoin Phase 1: $28k–$45k · Phase 2: $150k+ (steepest recovery)
- The outcome that currently has no description in any model — exactly as Lehman’s failure, Nixon’s gold window closure, and 9/11 had no description the week before they happened
- Every major system-level reset in the 110-year record was triggered by an event in this category
- The conditions that make such events lethal — five simultaneous ratio extremes, maximum systemic fragility — are present today at their highest reading since 2008
- DXY/Gold is below the 2008 crisis trough. If the unknown trigger arrives in this configuration, the impact is amplified by the accumulated fragility all five ratios are measuring
- Probability assigned not because we can describe it, but because 110 years of history demand we acknowledge it
The Trader’s Playbook — Near-Term Signals, Targets & Rationale
Every signal grounded in the 110-year ratio cycle framework. Entry levels, targets, and positioning logic for each major asset.
Risk Matrix — What Could Reverse Each Ratio Cycle
Upside and downside risks to the current ratio extremes — and the 110-year lesson that ties them all together.
Every major war and monetary shock of the past century — WWI (1914), WWII (1939), OPEC (1973), Iran Revolution (1979), Gulf War (1990), GFC (2008), COVID (2020), Iran War (2026) — followed the same ratio sequence: war → deficit spending → money printing → inflation → currency debasement → real asset repricing → ratio extreme → policy response → new equilibrium.
The current DXY/Gold and DXY/Oil ratio extremes are not random noise. They are the mathematical expression of 110 years of accumulated dollar debasement confronting the largest oil supply disruption in recorded history. DXY/Gold at 2.206 is below the 2008 crisis trough — the 53-year most stressed reading — while a war is actively expanding its scope by the day.
The only question is whether the equilibrium restores through a Volcker-style tightening response (impossible with $35T debt) or through continued real asset appreciation and a further decline in dollar purchasing power. The 110-year cycle points clearly toward the latter — while leaving open the door to the unknown mechanism that has always, in every prior cycle, arrived before anyone expected it.
Important Risk & Regulatory Disclosure: This article is produced by Capital Street FX for educational and informational purposes only. It does not constitute investment advice, a solicitation, or a recommendation to buy or sell any financial instrument. Trading in financial instruments including Forex, CFDs, commodities, stocks, indices and cryptocurrencies involves significant risk of loss and may not be suitable for all investors. Past performance is not indicative of future results.
Regulatory Notice: Institutional clients, STP accounts, and promotions are managed by Capital Street Bancclear Corporation (CSBC), registered in Saint Vincent and the Grenadines under FSA license 22064-IBC-2014. ECN and prime accounts are managed by Capital Street Intermarkets Limited (CSIML), regulated by the FSC Mauritius under license C112010690. Technology services provided by Artha Labs, UAE. You must be 18 years or older to trade with Capital Street FX. Leverage can work against you as well as for you. Please read our full Risk Disclosure before trading.