Trade FX, CFD, Stocks, BTC, Indices, Gold & Oil – 1:1000 Leverage & Bonus – CSFX

Mobile Header & Menu

Weekly Forex Market Analysis | March 2–6, 2026 | EUR/USD · GBP/USD · USD/JPY · AUD/USD

February 28, 2026
CSFXadmin
Weekly Forex Market Analysis | March 2–6, 2026 | EUR/USD · GBP/USD · USD/JPY · AUD/USD
Weekly Forex Market Report

FX Weekly Outlook
March 2 – 6, 2026

A comprehensive, institutional-grade analysis of the major currency pairs, economic calendar events, technical setups, and tactical trade ideas for the week ahead — built for experienced, active traders.

Published28 February 2026
EditionWeek 09 / 2026
Coverage4 Major Pairs
DXY Level~97.90
EUR/USD · 1.1780
GBP/USD · 1.2640
USD/JPY · 155.80
AUD/USD · 0.7084
FED FUNDS
3.50 – 3.75%  ON HOLD
BOJ RATE
0.75%  ▲ HIKE
BOE RATE
3.75%  ON HOLD
RBA RATE
3.85%  ▲ HAWK
DXY INDEX
97.90  ▼ WEAK
US CPI (JAN)
2.4% YoY
Section 01

Macro Environment & Key Market Drivers

The week of February 23–27 closed in a state of deliberate unresolution. Traders navigated an extraordinary confluence of US trade-policy disruption, a widening US–Japan monetary policy divergence, sticky inflation readings, and geopolitical noise — leaving all four major pairs range-bound heading into a pivotal first week of March.

The Big Story: On February 20, the US Supreme Court struck down the Trump administration’s IEEPA-based reciprocal tariff framework, briefly triggering a relief rally across risk assets and pressuring the US dollar. Within hours, the administration responded by announcing a 15% blanket global tariff under alternative legal authority. Markets are now awaiting whether trading partners absorb the new framework or pivot to retaliation — keeping FX volatility elevated and USD directional clarity elusive.
Driver Detail FX Impact Bias
Tariff Policy Shift SCOTUS voided IEEPA tariffs; Trump pivots to 15% global levy + Section 232 national-security tariffs under consideration USD vol ↑ · Risk-off spikes then fades Neutral–Bearish USD
Fed on Extended Pause FOMC minutes (Jan) show several members discussed potential rate hikes if inflation stays above target. Fed funds at 3.50–3.75% USD supported on dips Neutral USD
BoJ Policy Tug-of-War PM Takaichi reportedly pushed back on rate hikes in meeting with BoJ’s Ueda. BoJ already hiked to 0.75% in Dec 2025 JPY weakens on political interference signal Bearish JPY Near-Term
RBA Hawkish Surprise Australia CPI rose to 3.8% YoY vs 3.5% expected. RBA rate at 3.85%, highest of major CBs. Inflation fight ongoing AUD supported; rate hike risk alive Bullish AUD
BoE Dovish Tilt February hold with a surprising 5–4 split toward cut. UK CPI eased to 3.0%. April/May rate cut increasingly priced GBP upside capped Mildly Bearish GBP
ECB Steady Stance ECB on hold through 2026. Lagarde says inflation on track to 2%. Euro spec-long positioning at highest since 2020 EUR capped; crowded long risk Neutral EUR
China PMI Slip Official China Manufacturing PMI 49.3, Non-Manufacturing 49.4 in Jan — both below 50. Modest growth drag on AUD/CNY-linked pairs AUD drag on risk-off China signals Neutral–Mildly Bearish AUD
DXY Technical Dollar Index hovering around 97.90, targeting 98.00 resistance. Below 2025 highs near 110 — in a clear bearish medium-term trend Dollar structurally weak; oversold bounces possible Bearish USD Medium-Term
Section 02

Economic Calendar — High-Impact Events (Week of March 2–6, 2026)

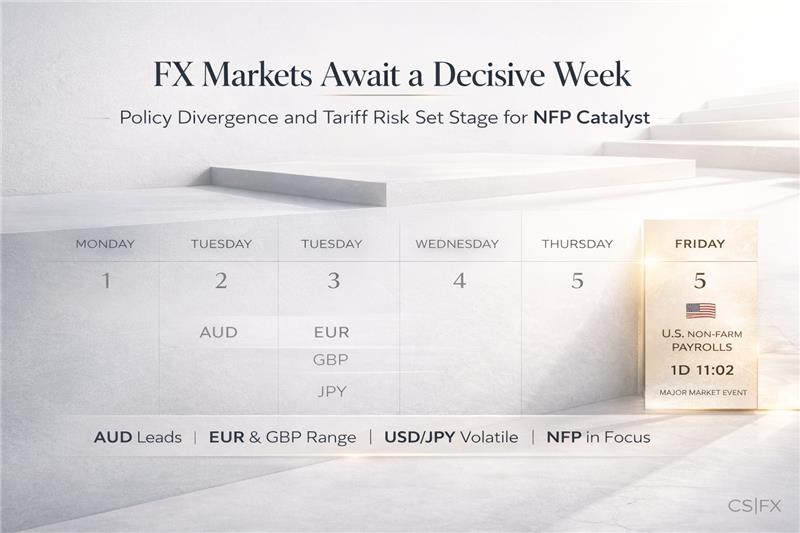
This is a data-dense week with catalysts across all six regions. The US Non-Farm Payrolls report on Friday is the headline risk event of the week. Japan’s Tokyo CPI (Monday) sets the tone for BoJ policy expectations, while Australian GDP (Wednesday) and UK final PMIs (Monday) round out the major risk.

Day / Time (GMT) Region Event Previous Forecast Impact Pairs to Watch
Mon Mar 2
23:30 Sun
🇯🇵 Japan Tokyo CPI (Feb)
Core ex. Fresh Food
1.9% YoY 1.7% YoY HIGH USD/JPY
Mon Mar 2
09:55 GMT
🇩🇪 Germany Unemployment Change (Feb) +11K +8K MED EUR/USD
Mon Mar 2
14:30 GMT
🇺🇸 USA ISM Manufacturing PMI (Feb) 48.2 49.5 HIGH All USD pairs
Tue Mar 3
03:30 GMT
🇦🇺 Australia RBA Rate Decision
Gov. Bullock press conf.
3.85% 3.85% (Hold) HIGH AUD/USD
Tue Mar 3
All Day
🇨🇳 China NPC Annual Session Begins
Policy announcements expected
HIGH AUD, CNH pairs
Wed Mar 4
00:30 GMT
🇦🇺 Australia GDP Q4 2025 +0.8% QoQ +0.6% QoQ HIGH AUD/USD
Wed Mar 4
14:30 GMT
🇺🇸 USA ADP Employment (Feb) +183K +175K HIGH All USD pairs
Wed Mar 4
15:00 GMT
🇺🇸 USA ISM Services PMI (Feb) 52.8 53.0 HIGH All USD pairs
Thu Mar 5
12:00 GMT
🇬🇧 UK BoE MPC Member Speeches
Bailey / Pill expected
MED GBP/USD
Thu Mar 5
13:30 GMT
🇺🇸 USA Weekly Jobless Claims 212K 210K MED All USD pairs
Thu Mar 5
All Day
🇪🇺 Eurozone ECB Consumer Inflation Expectations (Jan) 25.8 MED EUR/USD
Fri Mar 6
00:30 GMT
🇯🇵 Japan Household Spending (Jan)
Proxy demand gauge
-0.4% YoY +0.2% YoY MED USD/JPY
Fri Mar 6
07:00 GMT
🇬🇧 UK Halifax House Prices (Feb) +0.7% +0.3% MED GBP/USD
Fri Mar 6
13:30 GMT
🇺🇸 USA ⭐ Non-Farm Payrolls (Feb)
+ Unemployment Rate + Avg Hourly Earnings
+198K · 4.3% +180K · 4.3% HIGH ⭐ ALL PAIRS
Fri Mar 6
15:00 GMT
🇺🇸 USA Michigan Consumer Sentiment Prelim (Mar) 91.2 89.5 MED All USD pairs
Trader’s Note on NFP Friday: With the USD in a structurally weak medium-term trend, a miss on payrolls (below ~160K) could accelerate dollar selling and target new cycle lows on the DXY below 97.00. A surprise beat (above 220K) may trigger a short-squeeze on crowded USD shorts. Avoid positioning prior to 13:25 GMT Friday without tight stops.
Section 03

Market Sentiment Dashboard

A quick-reference view of weekly bias and short-term directional leaning for each pair entering the week of March 2.

EUR/USD
Range-Bound
1.1740–1.1840
Bias: Slight Bearish
GBP/USD
Cautious
1.2550–1.2750
Bias: Slight Bearish
USD/JPY
Volatile
153.50–157.00
Bias: Neutral
AUD/USD
Bullish Lean
0.7030–0.7150
Bias: Moderately Bullish
Section 04 — Currency Pair Analysis

EUR/USD — Euro / US Dollar

EUR / USD
Euro — US Dollar  |  Weekly Close: ~1.1780
1.1780
Range / Slight Bear
Weekly Trend & Structure
The EUR/USD is caught in a narrow 70-pip consolidation band (1.1740–1.1840), compressing after a failed push to the upside mid-week. Price has been unable to sustain above 1.1830 — the 50% midpoint of the recent move — and is grinding back toward the 55-day SMA at approximately 1.1770. The medium-term trend remains bullish (EUR/USD is up ~13% from 2025 lows), but the short-term structure suggests exhaustion of the rally.
Key Levels
R3: 1.2000 R2: 1.1900 R1: 1.1834
Current: 1.1780  |  55-Day SMA: 1.1770
S1: 1.1740 S2: 1.1680 S3: 1.1580
Candlestick Patterns (Weekly)
The weekly candle closed as a Bearish Doji / Spinning Top near 1.1780, with a long upper wick rejected at 1.1840. This indecision candle follows two consecutive bull candles and signals a potential stalling of the uptrend. A close below 1.1740 next week would confirm a Evening Star formation on the daily timeframe — a classic reversal signal. Watch for a Bullish Engulfing off 1.1740 support to re-engage the bull case.
Technical Indicators
RSI (14, Daily): ~52 — neutral, fading from overbought. MACD: Crossed below signal line on Thursday, confirming short-term bearish momentum. 200-day SMA: Sitting near 1.1730–1.1740 — a critical level where buyers are expected. Speculative net longs at highest since 2020 per COT data, increasing reversal risk. Bollinger Bands: Narrowing — breakout imminent in either direction.
Fundamental Drivers
ECB on hold through 2026 with Lagarde affirming inflation is “on track.” No ECB meeting this week, but Eurozone PMI finals and German jobs data add context. The USD remains under structural pressure from tariff uncertainty, three Fed cuts priced for 2026 (June, September, December). Speculative EUR net long positioning at a 6-year high creates vulnerability to a washout on any USD strength surprise.
News Catalysts This Week
Monday: German Unemployment (minor). Wednesday: Euro area data dribble. Friday: US NFP — single largest volatility event. A weak jobs number could push EUR/USD back toward 1.1900; a strong print could flush back to 1.1680. Chinese NPC policy signals (Tuesday) could also indirectly affect USD direction.
Trade Setup — Week of March 2–6
Direction
SELL RALLY
Entry Zone
1.1820 – 1.1840
Stop Loss
Above 1.1870
Take Profit 1
1.1740
Rationale: Sell the resistance zone on a retest of 1.1820–1.1840. Upper wick rejections, MACD cross lower, and crowded spec longs all point toward a corrective pullback toward the 200-day SMA / 1.1740 support. Avoid fresh sells below 1.1760. Post-NFP: reassess based on payrolls data — a miss re-opens 1.1900+.
Alternative bull play: Buy bounces at 1.1740 (200-day SMA) targeting 1.1840 on confirmed bullish reversal candle (Hammer / Engulfing) with stop below 1.1690.
Section 05 — Currency Pair Analysis

GBP/USD — British Pound / US Dollar

GBP / USD
British Pound Sterling — US Dollar  |  Weekly Close: ~1.2640
1.2640
Cautious / Neutral
Weekly Trend & Structure
GBP/USD remains at an inflection point after a Market Structure Shift from bearish to tentatively bullish during February. Price is retesting a major broken trendline and has held above the 200-day MA throughout the week. However, the 5–4 BoE split in favour of an eventual cut and UK CPI falling to 3.0% has placed a ceiling on upside momentum. The pair is structurally range-bound between 1.2550 and 1.2750 for now. A close above 1.2760 would open a run toward 1.2870.
Key Levels
R3: 1.2870 R2: 1.2760 R1: 1.2700
Current: 1.2640  |  200-Day MA: ~1.2580
S1: 1.2580 S2: 1.2500 S3: 1.2400
Candlestick Patterns (Weekly)
The weekly candle printed a High-Wave / Doji near the broken trendline, indicating indecision at a critical juncture. On the daily chart, Friday formed a Bearish Harami after a strong Thursday move higher, warning of short-term consolidation. The most important pattern watch for the week is a Three Inside Down confirmation below 1.2600 — which would signal the recovery has stalled — or a Marubozu Body close above 1.2700 confirming bulls are in control.
Technical Indicators
RSI (14, Daily): ~50 — neutral, no trend conviction. MACD: Flat with histogram near zero — compression ahead of breakout. 50-day SMA: ~1.2560 — aligning with key support; a break below is structurally bearish. Fibonacci (swing low 1.2100 to high 1.2760): 38.2% at 1.2508, 50% at 1.2430 — major support cluster if 200-day MA fails. Weekly ADX below 20 — trending market absent; range-trading preferred strategy.
Fundamental Drivers
BoE at 3.75% with a razor-thin hold vote. UK inflation at 3.0% — above target but trending lower. Markets now pricing a rate cut in April or May 2026, which is earlier than consensus just a month ago. US tariff uncertainty provides GBP indirect support (USD weakness) but BoE easing expectations serve as a fundamental cap. UK housing data and potential BoE member speeches (Thursday) are the key domestic catalysts this week.
News Catalysts This Week
Monday: UK Services PMI Final (potential market mover if diverges from flash). Thursday: BoE member commentary — any hint of April cut would weigh on GBP. Friday: US NFP dominates. A weak NFP (bearish USD) could spike GBP/USD above 1.2700 briefly; a strong NFP could break 1.2580 support.
Trade Setup — Week of March 2–6
Direction
RANGE FADE
Long Entry
1.2560 – 1.2580
Stop Loss (Long)
Below 1.2510
Take Profit
1.2700
Rationale: Range-fade strategy is preferred given ADX < 20 and no clear trend conviction. Buy the 200-day MA / 50-day SMA cluster at 1.2560–1.2580 targeting the top of the range at 1.2700–1.2750. Short entry: sell 1.2700 stops above 1.2770, target 1.2580. Avoid holding positions through Friday NFP without hedging.
Section 06 — Currency Pair Analysis

USD/JPY — US Dollar / Japanese Yen

USD / JPY
US Dollar — Japanese Yen  |  Weekly Close: ~155.80
155.80
Volatile / Neutral
Weekly Trend & Structure
USD/JPY is trading in a wide, volatile range between approximately 152.00 and 157.00, having oscillated in that band since late January. The pair saw dramatic intra-week swings driven by two competing forces: PM Takaichi’s reported pushback against BoJ rate hikes (JPY bearish) versus BoJ Governor Ueda’s reaffirmation that hikes will continue if economic forecasts materialize (JPY bullish). The failed topside breakout at 156.60 trendline is a bearish technical signal in the near term.
Key Levels
R3: 157.50 R2: 156.60 R1: 156.28
Current: 155.80  |  100-hr MA: ~155.47
S1: 155.47 S2: 154.34 S3: 153.30
Candlestick Patterns (Weekly)
The week closed with a Bearish Shooting Star pattern at the 156.60 trendline resistance — the pair thrust to new weekly highs, then failed to sustain momentum and reversed back below 156.20. This is a high-conviction reversal signal at resistance. On the daily chart, an Inside Bar on Friday after Thursday’s weakness suggests a measured pullback into 155.00–155.47. A Dragonfly Doji at 155.47 would confirm bull resumption.
Technical Indicators
RSI (14, Daily): ~48 — slipping below the neutral 50 level, short-term bearish lean. MACD: Bearish cross forming on the daily chart. 156.20–156.28: Key pivot zone — acts as resistance while price holds below it. Former support now resistance. 100-hour MA at 155.47: Next downside target if 155.72 cracks. Correlation with 2-year US yield differential remains strongest indicator: -0.77 coefficient. Watch US yield moves closely.
Fundamental Drivers
Three-way tension: (1) BoJ tightening bias (Ueda hawkish, Takata calls for “gear shift”) vs. (2) PM Takaichi political opposition to rate hikes, complicating BoJ timeline. (3) Fed on extended pause but minutes show rate hike discussion. Japan’s core underlying inflation still runs at 2.6% — keeping BoJ fundamentally hawkish. Tariff uncertainty adds USD volatility. US–Japan 2Y yield differential remains the primary driver; narrowing differential = JPY strength.
News Catalysts This Week
Monday: Tokyo CPI — key for BoJ expectations. A downside surprise on Tokyo CPI could quickly re-price March/April hike expectations and weaken JPY. BoJ board member speeches (Takada, Himino expected during the week) — unusual clustering suggests policymakers may be laying groundwork for a move. Friday: US NFP — peak volatility event. Japan Household Spending Friday also a secondary gauge.
Trade Setup — Week of March 2–6
Direction
SHORT USD/JPY
Entry Zone
156.20 – 156.50
Stop Loss
Above 156.80
Take Profit 1 / 2
155.47 / 154.34
Rationale: Sell the 156.20–156.50 former support / now resistance zone on a retest. The Shooting Star weekly pattern and failed breakout at 156.60 support the bearish case. TP1 at 100-hour MA (155.47), TP2 at 154.34 swing low. Move stops to break-even at TP1.
Invalidation: A sustained daily close above 156.60 re-opens the 157.50+ bullish target.
Section 07 — Currency Pair Analysis

AUD/USD — Australian Dollar / US Dollar

AUD / USD
Australian Dollar — US Dollar  |  Weekly Close: ~0.7084
0.7084
Bullish Lean
Weekly Trend & Structure
AUD/USD is in a confirmed medium-term uptrend, having broken above its long-term descending channel from the February 2021 high earlier in December 2025. The pair is up ~13% over the past year and is now consolidating around the 0.7086 pivot area. Price has established a clear bullish channel with higher highs and higher lows since April 2025. The current pullback is corrective; dips have consistently attracted buyers. Key structure: hold above 0.7030 = bullish; break below = caution.
Key Levels
R3: 0.7386 R2: 0.7234 R1: 0.7110
Pivot: 0.7086  |  Current: 0.7084
S1: 0.7030 S2: 0.6997 S3: 0.6897
Candlestick Patterns (Weekly)
The weekly chart printed a Bullish Hammer / Pin Bar closing at 0.7084 after testing the 0.7030–0.7050 support zone. This is a classic demand-zone rejection pattern within an ongoing uptrend. On the daily chart, a Three White Soldiers pattern formed Monday–Wednesday (the strongest bullish continuation signal) before a mild Thursday–Friday retracement created a Doji. The structure screams “buy the dip” — but only above 0.7030 support.
Technical Indicators
RSI (14, Daily): ~57 — healthy bullish range, not overbought. MACD: Positive, above signal line — bullish momentum confirmed. EMA50 (Daily): Acting as dynamic support; price has hugged it throughout the rally. ADX: ~28 — moderate trend strength, confirming directional move. Resistance: 0.7090 is the immediate barrier; a clean close above opens 0.7110 then 0.7150. Fib (23.6% retracement of recent swing): 0.6976 — major support below the current range.
Fundamental Drivers
AUD is structurally supported by three factors: (1) RBA at 3.85% — the highest rate among G10 central banks — with an inflation fight not yet won (CPI 3.8% vs 3.5% expected); (2) China as a stabilising GDP partner at 4.5% annual growth; (3) USD structural weakness providing a tailwind. Risks: China PMI slip below 50, risk-off episodes hurt AUD disproportionately as a high-beta currency. RBA decision Tuesday is the key event — a hold with hawkish rhetoric is the base case, AUD positive.
News Catalysts This Week
Tuesday: RBA Rate Decision — market pricing a hold at 3.85%. Hawkish language from Governor Bullock could spike AUD 30–50 pips. Wednesday: Australia GDP Q4 2025 (exp. +0.6% QoQ) — a beat reinforces RBA hawkish case. Tuesday: China NPC — fiscal stimulus announcements would be a significant AUD catalyst. Friday: US NFP — determines dollar direction; weak NFP is AUD’s best friend this week.
Trade Setup — Week of March 2–6
Direction
BUY ON DIPS
Entry Zone
0.7030 – 0.7060
Stop Loss
Below 0.6997
Take Profit 1 / 2
0.7110 / 0.7160
Rationale: Buy dips into the 0.7030–0.7060 demand zone within the established bullish channel. The Hammer weekly candle and EMA50 alignment support the long bias. TP1 at 0.7110 (near-term resistance); TP2 at 0.7160 on hawkish RBA outcome. RBA decision Tuesday is a binary risk — wait for post-RBA settlement before entering if risk-averse.
Invalidation: Daily close below 0.6997 opens a corrective decline to the 38.2% Fibonacci at 0.6870.
Section 08

Frequently Asked Questions

Answers to the questions active traders ask most heading into the week of March 2–6, 2026.

What is the single most important event for forex traders this week?
Without question, the US Non-Farm Payrolls (NFP) release on Friday March 6 at 13:30 GMT is the week’s peak volatility event. February payrolls are forecast at around 180K, with unemployment steady at 4.3%. Average Hourly Earnings is also closely watched for inflation signals. The USD’s medium-term bearish trend means a weak number (below ~160K) could accelerate dollar selling aggressively, while a strong beat (above 220K) would likely trigger short-covering rallies across all USD pairs. Always reduce position size or stay flat in the 30 minutes before the release.
How is the Supreme Court tariff ruling affecting forex markets right now?
The February 20 Supreme Court ruling that voided the Trump administration’s IEEPA-based reciprocal tariffs sent a temporary relief wave through risk assets — EUR/USD spiked, USD/JPY fell, AUD/USD rallied. However, within hours, the administration responded by announcing a blanket 15% global tariff under alternative legal authority, and is reportedly considering further Section 232 national-security tariffs. The net effect is that tariff uncertainty remains elevated but at a lower absolute level than peak fears. For forex traders, this means: USD directional conviction is still impaired, volatility remains asymmetrically high, and any fresh retaliatory tariff headlines will generate sharp, brief risk-off moves.
Is the Bank of Japan going to hike rates again in March or April 2026?
This is the most actively debated central bank question in FX markets right now. The BoJ already hiked to 0.75% in December 2025 — a 3-decade high. Governor Ueda has reaffirmed the tightening bias, and hawkish board member Takada has called for a “gear shift.” However, newly elected PM Takaichi has reportedly expressed reservations about further near-term hikes in meetings with Ueda, adding political risk to the timeline. Markets are pricing a move toward 1% by end-June. Tokyo CPI on Monday (forecast 1.7% vs 1.9% prior) is a critical data point: a miss could push the next hike toward Q3, weakening JPY. An upside surprise re-energises the April case and would likely see USD/JPY test 154.00 or below.
Why is AUD/USD the most bullish major pair heading into March 2026?
AUD/USD has three mutually reinforcing tailwinds: First, the RBA sits at 3.85% — the highest rate among all G10 central banks — and the inflation fight is not yet over (February CPI came in at 3.8% vs 3.5% expected). Second, China’s economy (Australia’s top trading partner) expanded 4.5% annually in Q4 2025, providing a stable demand floor for Australian commodity exports. Third, the US dollar remains under structural downward pressure from tariff uncertainty and three expected Fed cuts in 2026. The technical picture reinforces this: AUD/USD broke its multi-year descending channel in December 2025 and has maintained a clean series of higher highs and higher lows since. Tuesday’s RBA decision and Wednesday’s Australian GDP release are the pair’s key binary risk events this week.
What is the current trajectory for EUR/USD — will it break 1.20?
EUR/USD has had a remarkable 2025–2026 run, gaining approximately 13% from its lows and now trading around 1.1780. The medium-term trend remains bullish, supported by the USD’s structural weakness (DXY well below its 2025 peak above 110). However, several factors cap EUR upside in the near term: speculative net-long positioning in EUR is at its highest since 2020 (contrarian warning), ECB is on hold through 2026 providing no incremental policy support, and the pair failed twice to hold above 1.1840. A push through 1.19–1.20 is possible on a weak NFP Friday, but will likely require a decisive catalyst beyond current fundamentals. The 2026 base-case consensus sits around 1.19–1.21 by year-end per institutional forecasts reviewed.
How should experienced traders manage risk around high-impact events this week?
The cardinal rule: reduce position size to 30–50% of normal before binary events like NFP, RBA, and Tokyo CPI — then add back post-release on confirmed directional momentum. For this week specifically: (1) Flatten or hedge USD positions before Friday 13:30 GMT; (2) For AUD/USD, wait for Tuesday’s RBA outcome before adding to longs — a surprise dovish tone could flush the pair 40–60 pips; (3) USD/JPY — the 156.20–156.60 resistance zone is a defined risk area; selling that zone with tight stops is a reasonable risk/reward; (4) Use limit orders rather than market orders on major event weeks to avoid slippage; (5) Watch spread widening ahead of NFP — many brokers widen EUR/USD spreads to 2–5 pips around the release. Factor this into your stop placement.
Conclusion — The Trader’s Weekly Edge

The week of March 2–6, 2026 presents experienced traders with a rich but disciplined opportunity set. The macro backdrop — characterised by ongoing US tariff policy flux, a politically complicated BoJ tightening path, a structurally weak USD, and a hawkish RBA — creates meaningful divergence between the four major pairs. That divergence is exactly where the edge lives.

AUD/USD emerges as the week’s highest-conviction long candidate, backed by the highest G10 rate environment, sticky domestic inflation, and robust Chinese demand. The RBA decision on Tuesday and GDP on Wednesday serve as natural entry catalysts for position sizing decisions. USD/JPY offers the week’s most defined short setup at 156.20–156.60 resistance — a failed breakout pattern with clear invalidation level. EUR/USD and GBP/USD remain range-bound ahead of NFP Friday, rewarding range-fade strategies over directional trend-following.

Non-Farm Payrolls on Friday March 6 is the week’s macro pivot. Position accordingly: enter your highest-conviction setups early in the week, bank partial profits mid-week, and reassess with reduced exposure heading into the US session Friday. In markets driven by this level of policy uncertainty, the traders who manage risk first — and profits second — consistently outperform.

Trade with precision. Manage with discipline. Review every setup without ego.

Risk Disclaimer: This report is produced for informational and educational purposes only and does not constitute financial advice, investment recommendations, or an offer to buy or sell any financial instrument. Forex trading involves significant risk of loss and is not suitable for all investors. Past performance is not indicative of future results. All price levels, economic forecasts, and trade setups are based on publicly available data as of February 28, 2026, and are subject to change. Always conduct your own due diligence and consult a licensed financial advisor before making trading decisions. Leverage can work against you as much as for you. Never risk more than you can afford to lose.