Weekly Index Market Analysis | Week of March 2–6, 2026 | Dow Jones · Nasdaq 100 · FTSE 100
Index Markets:
Week of March 2–6, 2026
Executive Overview
February closed with a broad sell-off that left US equity indices nursing monthly losses, while the FTSE 100 defied the gloom — notching record highs on the back of firmer commodity prices and sterling weakness. Heading into the March 2–6 week, traders face a packed macro calendar headlined by US Non-Farm Payrolls and a full global PMI update.
The final week of February delivered a hard reality check for equity bulls. Hot Producer Price Index (PPI) data — with headline PPI climbing 0.5% MoM versus a 0.3% consensus estimate, and core PPI surging 0.8% — reinforced that the Federal Reserve has little room to ease. Markets are now pricing essentially no rate cut before June 2026, with futures showing only a 9.8% probability of a March cut.
Overlaying the inflation story is a growing narrative of AI fatigue. The tech-heavy Nasdaq posted its worst monthly performance since March 2025, as CoreWeave collapsed 20% on weak guidance, Nvidia extended post-earnings losses, and software stocks like CrowdStrike, Microsoft and Oracle continued to haemorrhage. Meanwhile the FTSE 100 offered a sharp contrast — mining stocks, international airlines, and defensive names drove the index to successive record highs, benefiting from a weaker pound and resilient commodity demand.
Key Market Drivers This Week
Five themes dominate the trading agenda for the week of March 2–6, 2026. Experienced traders should keep these front and centre when calibrating position size and directional bias:
| Theme | Current State | Market Implication | Signal |
|---|---|---|---|
| AI Sector Rotation | Mega-cap tech underperforming; iShares IGV software ETF −10% in February, −23% YTD | Nasdaq headwinds; capital rotating to value/defensives | Bearish Tech |
| US Inflation / PPI | Core PPI +0.8% MoM — well above 0.3% est. 10-yr yield dipping below 4%, driven by credit risk fear | Fed stays on hold; valuation multiples under pressure | Hawkish Risk |
| Private Credit Risk | UK lender Market Financial Solutions collapsed; contagion fear pulling Apollo −8%, Jefferies −9% | Financial sector drag on DJIA; flight to Treasuries | Risk-Off |
| UK / FTSE Outperformance | FTSE 100 +6.5% in February; mining, energy, airlines leading; pound weak | Divergence trade: long FTSE vs short Nasdaq viable | Bullish FTSE |
| US NFP (Friday 6 Mar) | Jan payrolls +130k; prior month +50k. Feb consensus ~+100–130k expected | Weak print = dovish pivot expectations; strong = hawkish re-pricing | Binary Event |
High-Impact Economic Calendar — March 2–6, 2026
This is one of the most data-dense weeks of Q1 2026. The week is bookended by global PMI data on Monday and US Non-Farm Payrolls on Friday, with significant releases from the UK, Eurozone, Australia, Japan and China in between. Plan your risk accordingly.
| Date / Day | Country | Event | Previous | Forecast | Impact |
|---|---|---|---|---|---|
| — Monday, 2 March 2026 — | |||||
| 2 Mar | 🇺🇸USA | ISM Manufacturing PMI (Feb) | 49.0 | 49.5 | High |
| 2 Mar | 🇬🇧UK | S&P Global Mfg PMI Final (Feb) | 48.2 flash | Confirm flash | High |
| 2 Mar | 🇨🇳China | Caixin Manufacturing PMI (Feb) | 50.3 | 50.3 | High |
| 2 Mar | 🇪🇺Eurozone | S&P Global Mfg PMI Final (Feb) | 47.3 flash | Confirm flash | Medium |
| 2 Mar | 🇯🇵Japan | Jibun Bank Mfg PMI Final (Feb) | 48.7 prelim | Confirm | Medium |
| — Tuesday, 3 March 2026 — | |||||
| 3 Mar | 🇦🇺Australia | GDP Q4 2025 (Annual Growth) | +0.8% Q/Q | +0.5% Q/Q est. | High |
| 3 Mar | 🇬🇧UK | Mortgage Lending & Approvals (Jan) | Prior month | — | Medium |
| 3 Mar | 🇪🇺Eurozone | PPI (Jan) | — | — | Medium |
| 3 Mar | 🇯🇵Japan | Unemployment Rate (Jan) | 2.4% | 2.5% | High |
| — Wednesday, 4 March 2026 — | |||||
| 4 Mar | 🇺🇸USA | ADP Employment Change (Feb) | +130k | ~+120k | High |
| 4 Mar | 🇺🇸USA | ISM Services PMI (Feb) | 52.8 | 52.5 | High |
| 4 Mar | 🇨🇳China | Caixin Services PMI (Feb) | 51.0 | 51.0 | High |
| 4 Mar | 🇬🇧UK | S&P Global Services/Composite PMI Final (Feb) | Flash 51.1 | Confirm | High |
| 4 Mar | 🇪🇺Eurozone | GDP Q4 (3rd Estimate) | +0.1% Q/Q | +0.1% | High |
| 4 Mar | 🇪🇺Eurozone | Unemployment (Jan) | 6.2% | 6.2% | Medium |
| — Thursday, 5 March 2026 — | |||||
| 5 Mar | 🇺🇸USA | Initial Jobless Claims | ~215k | ~215k | High |
| 5 Mar | 🇺🇸USA | US Trade Balance (Jan) | −$98.4bn | −$96bn | High |
| 5 Mar | 🇪🇺Eurozone | Flash CPI Inflation (Feb) | 2.5% YoY | 2.4% | High |
| 5 Mar | 🇬🇧UK | Halifax House Price Index (Feb) | +0.7% MoM | — | Medium |
| — Friday, 6 March 2026 — ⚠️ NFP DAY ⚠️ | |||||
| 6 Mar | 🇺🇸USA | Non-Farm Payrolls (Feb) | +130k | ~+100–130k | Very High |
| 6 Mar | 🇺🇸USA | Unemployment Rate (Feb) | 4.3% | 4.3% | High |
| 6 Mar | 🇺🇸USA | Average Hourly Earnings (Feb) | +0.3% MoM | +0.3% | High |
| 6 Mar | 🇪🇺Eurozone | Germany Factory Orders (Jan) | — | — | Medium |
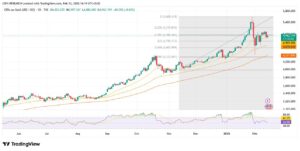
Dow Jones Industrial Average (DJIA)
| KEY LEVELS — DJIA | ||
|---|---|---|
| Level Type | Price | Note |
| Resistance 2 | 50,000 | Psychological ceiling; failed breakout zone |
| Resistance 1 | 49,500–49,630 | Thursday close level; overhead supply |
| Current Price | 48,977 | Friday close — end of Feb sell-off |
| Support 1 | 48,700–48,800 | Feb 23 low — critical short-term floor |
| Support 2 | 48,200 | 200-day MA / Jan demand zone |
| Support 3 | 47,500 | April 2025 swing low — macro demand |
| 50-day MA | ~49,400 | Price trading below — bearish signal |
| 200-day MA | ~48,100 | Long-term bull/bear decision line |
| Fibonacci 61.8% | 48,650 | Fib retracement from Nov high to Apr low |
The Dow is in a short-term downtrend since its January all-time high near 50,100. The index has carved out a series of lower highs and is now trading below both its 20-day and 50-day moving averages. The daily chart shows a clear descending channel pattern, with price currently hugging the lower bound around 48,800–49,000.
Friday’s bearish engulfing candle — where the session body completely overwhelmed the prior day’s range — is technically significant. The engulfing candle was accompanied by above-average volume, confirming institutional distribution rather than casual selling.
The primary catalyst remains the private credit contagion story (Market Financial Solutions collapse), with Apollo and Jefferies dragging the financial sector component of the DJIA notably lower. Until this credit risk narrative is fully absorbed or dismissed, financial heavyweights will continue to weigh on the index.
The monthly view is less alarming: February’s +0.2% gain keeps the long-term uptrend intact. A decisive break below the 200-day MA (~48,100) would be a material technical deterioration worth respecting.
Stop: Above 49,750
Target 1: 48,700 Target 2: 48,100 (200-MA)
R/R: ~1:2
Stop: Below 48,500
Target: 49,400–49,500
R/R: ~1:3
NFP (Fri 6 Mar) — weak jobs print may trigger short-covering bounce to 49,500.
Private credit headlines — any further UK/US credit stress = additional downside.
Nasdaq 100 (NDX)
| KEY LEVELS — NDX | ||
|---|---|---|
| Level Type | Price | Note |
| 52-Week High | 26,182 | All-time high ceiling — very distant |
| Resistance 1 | 25,131 | Key technical barrier; 40% probability of break |
| Current Price | 24,882 | 28 Feb pre-market / intraday estimate |
| Support 1 | 24,622 | Recent swing low — critical short-term floor |
| Support 2 | 24,000 | Major psychological support; 2025 November lows |
| Support 3 | 23,000 | Higher-low candidate; bull market structure intact above |
| 50-day MA | ~25,520 | Now acting as resistance; price well below |
| 200-day MA | ~25,500 | Convergence with 50MA = strong overhead resistance |
| Trend Channel Low | ~24,100 | Lower bound of symmetrical triangle pattern |
The Nasdaq 100 is in a confirmed short-to-medium term downtrend. The 50-day and 200-day moving averages have converged at approximately 25,500 and now form a formidable resistance cluster. Price is over 600 points below this dual-MA zone — a structurally bearish configuration that technical traders call a “ceiling of doom.”
The index has formed a symmetrical triangle pattern on the daily chart, capped near 26,054 (high) and supported around 24,100. The triangle is compressing, and a directional resolution is overdue. Given the current bearish momentum and macro headwinds, the probability tilts toward a downside break of the triangle, targeting 23,000.
RSI at approximately 36 is in neutral-to-oversold territory. While this alone is not a buy signal, a close below RSI 30 alongside a break of 24,622 support would be the cleanest confirmation of accelerating bearish momentum. Conversely, a snapback above 25,131 on strong volume (supported by, say, a weak NFP triggering dovish pivots) would represent the first genuine bull signal in several weeks.
The iShares Tech-Software ETF (IGV) is down nearly 23% year-to-date — its trajectory is a warning sign for the broader Nasdaq that this is a structural shift, not just normal volatility.
Stop: Above 24,900
Target 1: 24,000 · Target 2: 23,000
R/R: 1:2.5 to 1:4
Entry: Long on break above 25,131 with volume
Target: 25,500 (50-MA) then 26,000
R/R: 1:2 — low probability, high reward
Bullish: AAPL (only Mag-7 still positive YTD), PDD (tariff ruling beneficiary)
Neutral: AMZN (choppy near 200), META (shooting star)
FTSE 100 (UK100)
| KEY LEVELS — FTSE 100 | ||
|---|---|---|
| Level Type | Price (GBP) | Note |
| Resistance 2 | 11,000 | Elliott Wave target for impulse wave (3) |
| Resistance 1 | 10,950–10,960 | Immediate near-term ceiling / current YTD high |
| Current Price | 10,890–10,901 | 27–28 Feb close — record territory |
| Support 1 | 10,800 | Broken resistance — now key support; channel resistance-turned-support |
| Support 2 | 10,600 | Prior consolidation zone; strong demand area |
| Support 3 | 10,400 | Jan demand / swing low structure |
| 5-day MA | 10,900 | Price at MA — bullish if holding |
| 50-day MA | 10,772 | Price trading well above — strong bull signal |
| 200-day MA | 10,526 | Long-term bull trend firmly intact |
The FTSE 100 is in a strong, unambiguous uptrend across all major timeframes. All 12 moving average signals on Investing.com’s technical dashboard are currently registering a “Buy” or “Strong Buy.” The index has broken decisively above the key 10,800 resistance level — the former ceiling of its daily up channel from December — and is now targeting the psychologically significant 11,000 level.
Elliott Wave analysis from market analysts points to the current rally being the active intermediate impulse wave (3) from mid-January lows. Wave 3 moves are characteristically the strongest and most sustained, which aligns with the FTSE’s exceptional +6.5% February performance.
The week’s standout candlestick formations include several bullish continuation candles with high closes and limited upper wicks — a characteristic of genuine institutional buying pressure. The Thursday close at 10,850 showed a Marubozu-style bullish candle, confirming buyers in full control.
One technical note of caution: RSI at 68.7 is approaching overbought territory at 70. A brief consolidation or shallow pullback to 10,800 support would be healthy and technically expected before a continuation toward 11,000. The pullback, if it materialises, is a buying opportunity, not a reversal signal.
Key sectoral drivers: Mining stocks (Rio Tinto, Anglo American, Glencore), International Airlines Group, Rightmove (+6% on strong revenues + buyback), and energy majors continue to provide the index’s backbone. UK-listed banks, however, face headwinds from the private credit risk contagion narrative.
Stop: Below 10,740
Target 1: 10,950 · Target 2: 11,000
R/R: 1:2.5 — clean structural setup
Stop: Below 10,900
Target: 11,200–11,300 (extension targets)
R/R: 1:3 — momentum breakout trade
GBP strength risk — if USD weakens, GBP may rally, capping FTSE gains (inverse relationship)
Eurozone CPI (Thu 5 Mar) — ECB rate expectations impact UK gilts / financial sector
Cross-Index Snapshot & Divergence Trade
| Index | Close (28 Feb) | MTD (Feb) | YTD 2026 | Trend | RSI | MA Signal | Outlook |
|---|---|---|---|---|---|---|---|
| Dow Jones (DJIA) | 48,977 | +0.2% | ~+0.5% | Downtrend | 42 | Mixed | Cautious |
| S&P 500 | 6,878 | −0.43% | −0.8% | Topping | 44 | Neutral | Watch 6,800 |
| Nasdaq 100 (NDX) | 24,882 | −3.1% | −4.5% | Downtrend | 36 | Sell | Bearish |
| FTSE 100 (UKX) | 10,890 | +6.5% | +7.2% | Uptrend | 68.7 | Strong Buy | Bullish |
| DAX (Germany) | 25,289 | +2.3% | +6%+ | Uptrend | 62 | Buy | Bullish |
| VIX (Fear Gauge) | 20.42 | +9.6% | Elevated | Rising | — | Risk-Off | Hedge positions |
Frequently Asked Questions
Conclusion
The Week Ahead: Navigate the Divergence
The overarching theme entering March is one of sharp transatlantic divergence. European and UK equities — benefiting from commodity strength, currency dynamics, and lower AI exposure — are posting record highs while US growth stocks grind through a structural correction driven by stubborn inflation, AI expectation fatigue, and private credit stress signals.
For the Dow Jones and Nasdaq 100, the path of least resistance remains lower until the market gets clarity on two fronts: the durability of private credit stress, and whether February’s labour market data (NFP Friday) revives any credible case for Federal Reserve rate cuts in H1 2026. Until then, resistance levels at 49,400–49,500 (DJIA) and 25,131 (NDX) should be treated as selling zones for experienced traders.
The FTSE 100, by contrast, is one of the strongest index trades in the developed world right now. The Elliott Wave structure points toward 11,000, all moving averages are aligned bullish, and the underlying sectoral drivers (mining, energy, international airlines) have fundamental catalysts behind them. Pullbacks toward 10,800 are buyable with well-defined risk.
The week’s single most important data point is US Non-Farm Payrolls on Friday, March 6. Position sizing should reflect the binary nature of that release — reduce size into Thursday’s close, and let the market show its hand before committing to directional positions of size. Trade the reaction, not the anticipation.