Fading Fed Hike Bets Lift Bitcoin Back Above 82,000 as ETF Outflows Cap the Rebound | Technical Analysis – Crypto Report | 19-10-2026
Crypto Today | Monday 19 October 2026
Fading Fed Hike Bets Lift Bitcoin Back Above 82,000 as ETF Outflows Cap the Rebound
Market Overview
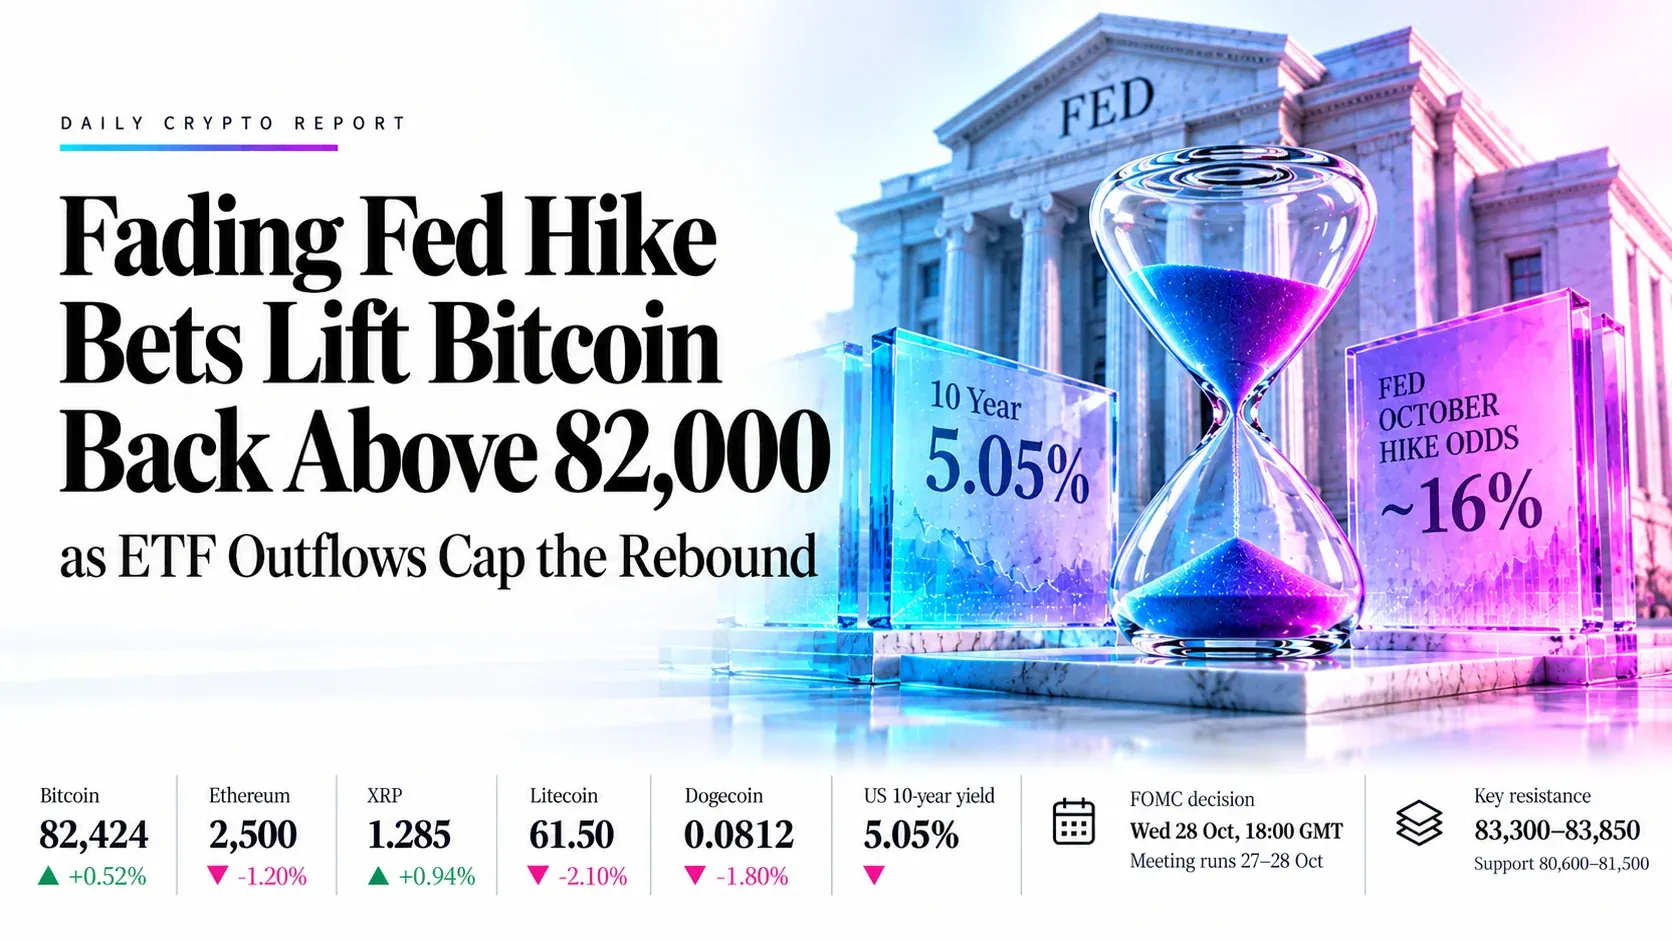
Bitcoin traded near 82,424 at 12:23 GMT on Monday, up about 0.5% on the day and about 0.9% above Sunday’s close near 81,900, as Federal Reserve (Fed) Chair Kevin Warsh gave no signal on the October meeting at an IMF event in Bangkok and the odds of a hike on 27–28 October slipped to about 16%. Markets still price a December increase, and the Fed’s target range is 3.75%–4.00% after the 16 September hike. The US 10-year yield eased to about 5.05%, and China’s third-quarter growth beat forecasts at 4.5%, which helped risk assets rebound with Nasdaq futures up about 1% as oil fell. The recovery is fragile: last week’s 3.7% September inflation print triggered nearly $1 billion of liquidations, and US spot ETFs lost about $576 million across Bitcoin, Ethereum and Solana. We read the session as a relief bounce inside a range, with resistance near 83,300–83,850 and support near 80,600–81,500.
Key highlights
- Fed: CME FedWatch shows about 85% odds of no change in October, while a 25 basis point hike in December sits near 75–92% after September consumer prices hit 3.7%.
- Bitcoin: Price recovered from an intraday low near 79,732 last week; daily Bollinger Bands are at multi-year tightness, which often precedes a larger move.
- ETF flows: Bitcoin funds lost $228.6 million (second weekly outflow), Ethereum funds $320.0 million (third) and Solana funds $25.5 million, per SoSoValue.
- XRP: US spot XRP ETFs posted their first weekly outflow in 13 weeks, about $1.84 million, while cumulative inflows stay near $1.8 billion.
- Liquidations: CoinGlass logged about $972 million of liquidations in 24 hours after the inflation report, with longs making up 91.7%.
- Sentiment: The Coinbase Premium Index hit −0.14 last week, its lowest since late June, a sign of soft US spot demand.
What’s Moving Crypto Today
Warsh stays silent and hike odds fade
Warsh said he does not prejudge meetings, and traders read the lack of guidance as mildly dovish. October hike odds fell to about 16% and the US 10-year yield eased to about 5.05%, which helped Bitcoin reclaim 82,500 in the Asian session.
ETF outflows continue for a second and third week
US spot Bitcoin and Ethereum funds both lost money last week, and XRP funds ended their 13-week inflow run. Ethereum accounted for about 56% of net withdrawals across the four tracked ETF categories.
China growth beat and a tech rebound lift sentiment
China’s third-quarter GDP of 4.5% topped forecasts, South Korea’s KOSPI rose nearly 1.8%, and Nasdaq futures gained about 1% as oil eased with Brent near 108. Big technology earnings later this week are the next test for risk appetite.
Key Drivers Today
Five readings and events that set direction for crypto. All times are GMT.
- US 10-year yield
- ~5.05%
- Lower on AI-growth worries
- Fed October hike odds
- ~16%
- December hike still ~75–92%
- Spot ETF flows
- −$576M
- Bitcoin, Ethereum, Solana
- Canada CPI
- Sep, y/y
- August was 3.0%
- FOMC decision
- 3.75%–4.00%
- Meeting runs 27–28 Oct
Swipe the strip to see every driver.
Trade Setups for Today
Ranked by conviction and valid for today’s session. A 1-hour close beyond the stop cancels the idea.
| Instrument | Direction | Entry | Stop | Target 1 | Target 2 | Reward:risk | Conviction |
|---|---|---|---|---|---|---|---|
| Bitcoin | Long | 82,000.00 | 80,300.00 | 84,500.00 | 86,500.00 | 1.5 / 2.6 | Medium |
| Ethereum | Short | 2,500.00 | 2,580.00 | 2,340.00 | 2,285.00 | 2.0 / 2.7 | Medium |
| XRP | Long | 1.285 | 1.240 | 1.360 | 1.410 | 1.7 / 2.8 | Low |
| Litecoin | Short | 61.50 | 64.30 | 56.80 | 53.50 | 1.7 / 2.9 | Medium |
| Dogecoin | Short | 0.0812 | 0.0845 | 0.0760 | 0.0720 | 1.6 / 2.8 | Medium |
Reward:risk is the distance from entry to each target divided by the distance from entry to the stop. Prices: Bitcoin, Ethereum, XRP and Litecoin are US dollar quotes per coin (Bitstamp chart feed) and Dogecoin is DOGE/USDT on Binance. Levels are conditional technical references, not recommendations.
Fed Policy Scenario Analysis
The path of Fed hike pricing and Treasury yields is the swing factor for crypto. The FOMC decision at 18:00 GMT on Wednesday 28 October is the next scheduled test.
Hawkish repricing: hot data revives an October hike
Another hot inflation or oil-driven surprise, or a Fed that signals more tightening, would lift yields and the dollar, extend ETF outflows and put the August channel floors back in play.
- Bitcoin80,600, then 79,700
- Ethereum2,340, then 2,285
- US 10-year yieldRises
Fed relief: a hold with softer language
A hold in October with cautious wording would trim December hike odds, ease yields and let short positions near 83,200 and 85,940 be squeezed, which could extend the rebound.
- Bitcoin83,850, then 86,500
- Ethereum2,550, then 2,800
- US 10-year yieldFalls
Bitcoin | BTC/USD, US dollars per coin
Bitcoin Analysis: Price Retests Channel Floor From Below as Fed Hike Bets Fade
82,424.00 +423.00 (+0.52%) day Day range 81,920–83,062
Outlook: Bias is neutral to mildly higher while 80,600 holds. Fading October hike odds, a China growth beat and a tech-led rebound lifted Bitcoin back above 82,000, but ETF outflows and a December hike still priced in cap rallies below 83,273.
Key levels
- Support 2
- 78,000.00
- Support 1
- 80,600.00
- Resistance 1
- 83,270.00
- Resistance 2
- 86,500.00
- Price sits between the 81,492 and 83,273 averages after dipping to a low near 79,732 last week; the 74,386 slow average is the deeper floor, and FXStreet flags the 50-day EMA near 80,607 as the line buyers defended.
- RSI 50.41 is level with its signal line at 50.36, a neutral reading; daily Bollinger Bands are at multi-year tightness, so a larger move is likely once 80,600 or 83,850 breaks.
Setup: Long at 82,000.00, stop 80,300.00, targets 84,500.00 and 86,500.00. Reward:risk 1.5 / 2.6, medium conviction.
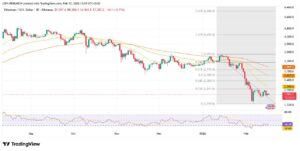
Ethereum | ETH/USD, US dollars per coin
Ethereum Analysis: Sub-2,550 Averages Cap the Bounce as ETF Outflows Reach Three Weeks
2,421.80 +13.80 (+0.57%) day Day range 2,400.7–2,444.0
Outlook: Bias is lower while 2,550 caps rallies. Ethereum funds lost about $320 million last week, the third straight weekly outflow and 56% of all tracked crypto ETF withdrawals, which outweighs the Monday rebound toward 2,420.
Key levels
- Support 2
- 2,150.00
- Support 1
- 2,285.00
- Resistance 1
- 2,550.00
- Resistance 2
- 2,800.00
- The 2,544.8 and 2,550.5 averages sit together overhead as the first hurdle; the 2,283.9 slow average and the channel floor converge just beneath price as the key support, with the 200-day EMA near 2,345 flagged by FXStreet in between.
- RSI 39.80 is under its signal line at 41.33 and close to oversold, which favours a bounce into resistance rather than a reversal.
Setup: Short at 2,500.00, stop 2,580.00, targets 2,340.00 and 2,285.00. Reward:risk 2.0 / 2.7, medium conviction.
XRP | XRP/USD, US dollars per coin
XRP Analysis: Price Rests on the 1.278 Average After First ETF Outflow in 13 Weeks
1.308 +0.00260 (+0.20%) day Day range 1.29689–1.32010
Outlook: Bias is neutral while 1.278 holds. US spot XRP funds ended a 13-week inflow streak with a small $1.84 million outflow, and XRP is down about 7% on the week, but the token has bounced back to 1.31.
Key levels
- Support 2
- 1.200
- Support 1
- 1.278
- Resistance 1
- 1.403
- Resistance 2
- 1.500
- The 1.278 slow average has held a mid-October wick near 1.26; the broken trendline and the 1.403 and 1.414 averages stack up as resistance near 1.40.
- RSI 37.59 is under its signal line at 41.24, a weak reading that argues for waiting for a close back above 1.35 before trusting the bounce.
Setup: Long at 1.285, stop 1.240, targets 1.360 and 1.410. Reward:risk 1.7 / 2.8, low conviction.
Litecoin | LTC/USD, US dollars per coin
Litecoin Analysis: Rally Stalls Under the Broken Channel Line Near 61
60.00 +0.95 (+1.60%) day Day range 58.99–60.18
Outlook: Bias is lower while 64.29 caps rallies. Litecoin gained about 1.5% with the majors but is still below the floor of the rising channel it broke in early October, and sits on the 60.34 average.
Key levels
- Support 2
- 51.50
- Support 1
- 53.43
- Resistance 1
- 64.29
- Resistance 2
- 71.00
- Price is level with the 60.34 average with the 64.29 average and the broken channel line above near 61–62; the 53.43 slow average is the next floor.
- RSI 43.59 is below its signal line at 46.45 and under 50, so momentum has not yet turned up despite the bounce.
Setup: Short at 61.50, stop 64.30, targets 56.80 and 53.50. Reward:risk 1.7 / 2.9, medium conviction.
Dogecoin | DOGE/USDT, US dollars per coin (Binance)
Dogecoin Analysis: Price Stays Under the 0.0813 Average After Breaking the Rising Channel
0.0797 +0.00028 (+0.35%) day Day range 0.07874–0.08029
Outlook: Bias is lower while 0.0813 caps rallies. Dogecoin fell out of its rising channel in mid-October and trades below all three averages, with RSI near oversold, so any bounce faces supply near 0.081.
Key levels
- Support 2
- 0.0670
- Support 1
- 0.0720
- Resistance 1
- 0.0813
- Resistance 2
- 0.0870
- The 0.08134 slow average is now overhead, with the 0.0870 and 0.0880 averages above it; the 0.0720 area is the next chart support, then 0.0670.
- RSI 36.28 is under its signal line at 40.46 and close to oversold, which favours a bounce but not a reversal until 0.0813 is regained.
Setup: Short at 0.0812, stop 0.0845, targets 0.0760 and 0.0720. Reward:risk 1.6 / 2.8, medium conviction.
Conclusion
Bitcoin is rebounding inside an 80,000–85,000 range on fading October hike bets and a China-led risk bid, but ETF outflows and a still-priced December hike limit follow-through. We prefer buying Bitcoin on dips above 80,300 and selling rallies in Ethereum, Litecoin and Dogecoin, with XRP held at low conviction near its 1.278 average. Canadian inflation at 12:30 GMT is the nearest risk, followed by big technology earnings later this week, daily ETF flow data and the Fed decision at 18:00 GMT on Wednesday 28 October. A daily close above 83,850 would challenge the cautious view, while a close below 80,300 would turn Bitcoin bearish.
Trade Bitcoin, Ethereum, XRP, Litecoin, Dogecoin and other markets with Capital Street FX.
Frequently Asked Questions
Why does Bitcoin rise when Fed hike odds fall?
Lower expected rates and falling Treasury yields reduce the appeal of interest-bearing assets and ease financial conditions, which tends to help speculative assets such as Bitcoin. Hot inflation data can reverse the move quickly.
What do spot ETF outflows mean for crypto prices?
Outflows mean investors are redeeming fund shares, which forces funds to sell the underlying coins. Several weeks of outflows signal weaker institutional demand and can cap rallies, as seen in Bitcoin and Ethereum this month.
Why do crypto liquidations move prices so fast?
Many traders borrow to bet on a price move. When price crosses a set level, exchanges close those positions automatically, and that forced buying or selling can push price further and trigger more liquidations.
What does a tight Bollinger Band mean for Bitcoin?
Tight bands show volatility has contracted. Large moves often follow quiet periods, but the bands do not show direction, so traders wait for a break of nearby support or resistance.