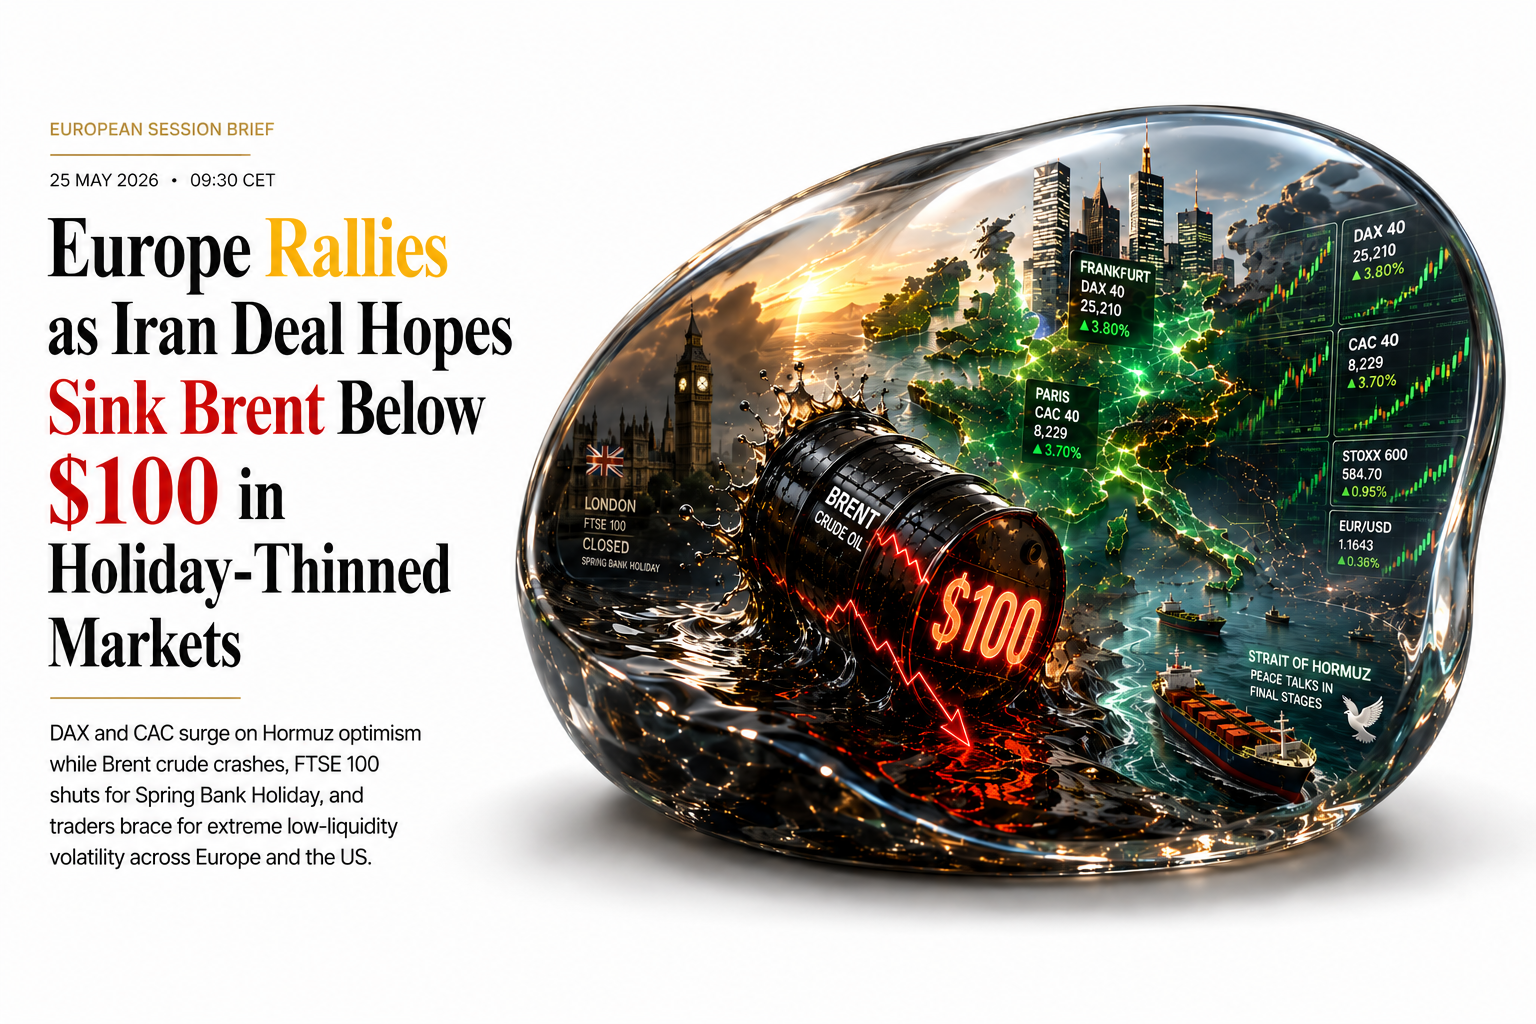
Oil Crash & UK Bank Holiday | Technical Analysis | Capital Street FX European Session Brief · 25 May 2026
Iran Deal Optimism,
Brent Crashes & London
Goes Dark for Bank Holiday
Iran-US peace talks reach “final stages” · Nikkei 225 breaks 65,000 record · UK Spring Bank Holiday · Thin liquidity warning
Monday’s European session operates in dramatically thinned conditions. The UK is observing the Spring Bank Holiday, silencing the London Stock Exchange, Gilt futures and much of the sterling-specific flow. Across the Atlantic, US markets are simultaneously shut for Memorial Day — meaning that for the duration of today’s session, European price discovery functions in an illiquidity vacuum not seen since August. Traders should treat all moves with extra caution: thin books amplify both breakouts and false signals.
The single dominant driver today is oil. Brent crude has pulled back 1.47% to $98.73, holding just below the $100 psychological level — after optimism grew that the United States and Iran have moved into “final stages” of a deal. US Secretary of State Marco Rubio confirmed on Sunday that Washington would “pursue all diplomatic avenues,” and Qatar dispatched a negotiating team to Tehran in coordination with Washington. If the Strait of Hormuz reopens, Brent’s near-60% premium above pre-war levels ($70 in late February) faces a structural unwind of historic proportions. ECB rate policy, Eurozone PMI trajectory, and the June 11 ECB meeting remain the secondary fundamental drivers.
European Session Market Snapshot
Indicative levels as of 09:30 CET · 25 May 2026 · All prices subject to spread
Headlines Driving the European Session
Fundamental catalysts, geopolitical developments and central bank signals · 25 May 2026
European Forex — Trade Setups for the Session
Entry · Stop Loss · Take Profit · Technical Analysis · Fundamental Context · 25 May 2026
Technical Analysis
EUR/USD has recovered from its mid-May lows around 1.1580, currently trading near 1.1643 with a mild bullish bias on today’s risk-on backdrop. The pair remains well below its January 2026 high of 1.2019 and the year’s trading range (1.1435–1.2019 per exchange rate data) suggests a 5.1% band. The ECB reference rate fix from 22 May placed USD/EUR at 1.1595 — today’s move above that constitutes a technical positive. Resistance at 1.1680–1.1700 is the first significant technical barrier; a break opens a path toward 1.18+. On thin Monday liquidity, a false break in either direction is highly probable — confirm any move with volume.
Fundamental Context
The EUR is caught in a structural tug-of-war. Bullish: the ECB June 11 meeting is live with a hike priced in, supporting EUR carry demand; oil prices are falling sharply today, reducing the Eurozone energy import burden and lifting growth expectations. Bearish: the EU Commission cut Eurozone GDP to 0.9% for 2026; ECB deposit rate remains at 2.00% vs BoE 3.75%, creating a 175bp rate disadvantage for EUR/GBP. Today’s thin session means any EUR/USD move above 1.1680 or below 1.1590 should be treated as a potential false break. The major event to watch is Eurozone Flash PMI on Tuesday — that print will set the EUR tone for the week.

Technical Analysis
GBP/USD is trading at 1.3494, down marginally on the session as thin Bank Holiday flows dominate. Historical data shows GBP was at 1.3555 on May 10, declined to 1.3325 by May 17, and recovered slightly to 1.3433 by May 19 — a pattern of lower highs since the 1.3634 peak. The 52-week high at 1.3634 remains significant resistance. The current structure is a pullback within a broader uptrend that began in late 2025. Support at 1.3450–1.3460 must hold for the bullish thesis to survive. The 20-day EMA, typically a reliable guide for Cable’s trend, sits near 1.3440 — the pair is trading comfortably above it.
Fundamental Context
Three key drivers for sterling: (1) UK economic performance — IMF cut the UK growth projection from 1.3% to just 0.8% for 2026 due to the oil shock; (2) The Iran War ceasefire narrative — GBP benefits from risk-on sentiment and lower energy costs, with the pound gaining when investors turn optimistic on Hormuz; (3) UK political risk — a growing Labour Party leadership crisis centred on PM Keir Starmer’s position adds political uncertainty. Today’s Bank Holiday means GBP liquidity is severely impaired — CSFX recommends deferring new sterling positions until tomorrow’s LSE reopen. Watch Tuesday’s UK PMI data and any fresh political headlines.

DAX 40 · CAC 40 · FTSE 100 — Session Analysis
Intraday setups, fundamentals and chart levels · 25 May 2026
Context & Tuesday Outlook
The FTSE 100 is fully closed for the UK Spring Bank Holiday and will resume trading on Tuesday 26 May. When London reopens, traders will face a dramatically changed landscape: Brent crude at $95, Iran-US talks in “final stages,” and a risk-on global backdrop. The FTSE 100’s energy-heavy composition (Shell, BP, Equinor exposure) means the index faces a structural headwind from lower oil — energy stocks could drag. However, financials (Barclays, HSBC, Lloyds), consumer discretionary names and internationally exposed companies benefit from the risk-on mood. The FTSE 100 hit 10,601 in mid-April 2026 during the initial ceasefire surge, and that remains the key near-term target. Support at 10,200–10,300 will be the first test on Tuesday’s open.
Key Risks at Tuesday Reopen
The FTSE 100 will “gap” to price in today’s entire session — a Brent-led selloff in energy names is likely offset by broad risk-on buying. Hargreaves Lansdown data shows the FTSE 100 near 9,923 in late March before the April truce surge; the recovery since has been dramatic. Tuesday will also see UK Flash PMI and potentially fresh headlines on PM Starmer’s political position. CBI retail sales at -68 (lowest since 1983) indicate severe consumer stress that ultimately caps FTSE upside.

Technical Analysis
The DAX 40 surges at today’s open, on track for a 1.1% gain per IG futures data. The index’s prior week performance was the strongest in 2026 — up 3.92% — driven by Middle East de-escalation hopes. The index has now surpassed its pre-war all-time high of ~24,700, set in February 2026, trading at fresh record territory above 25,200. The recovery since the war-era lows (the DAX traded near 22,250 in late March) represents a full retracement of the war-shock selloff. The 10-day EMA near 24,500 is rising sharply and provides dynamic support on any intraday pullback. RSI on the daily chart is approaching 72 — entering overbought territory; watch for short-term pullback risk.
Fundamental Context
Germany’s macro outlook has improved meaningfully on today’s oil price drop. The Iran war drove a Brent surge to $114+ at its peak, forcing Germany to slash its 2026 GDP forecast to 0.5% and revise inflation up to 2.7%. Every $10 fall in Brent reduces Germany’s energy import bill by roughly €6–8bn annually, translating directly into better margins for energy-intensive industrials (BASF, Siemens Energy, E.ON). The DAX’s top performers today are likely to be auto (Mercedes-Benz, BMW, Volkswagen — cheap energy relieves EV battery cost pressure) and industrials. Rheinmetall and defence names will face pressure as Hormuz optimism reduces the military premium.

Technical Analysis
The CAC 40 is surging strongly to 8,229, well clear of its March war-low of 7,544 and re-approaching its pre-war all-time high of 8,642. The index’s all-time high of 8,642 was set on 26 February 2026 — just days before the US-Iran conflict began — and remains the long-term bull target. The recovery from 7,544 to 8,229 represents an 8.9% move. The 8,229 level breaks above the 8,200 psychological resistance band where the CAC consolidated during April and early May — a technically significant breakout. LVMH (+2.2%), Schneider Electric (+2.5%), Airbus (+3%) and Safran (+2.2%) pattern is likely to repeat today as cheaper energy provides a direct margin catalyst for the luxury and aerospace complex.
Fundamental Context
The CAC 40 is particularly sensitive to two war-adjacent themes: (1) luxury demand — LVMH, Hermès, Kering are major CAC constituents; lower oil means cheaper travel, better consumer sentiment and stronger luxury spending in the Gulf and Asia; (2) energy costs — TotalEnergies, the CAC’s energy giant, will face earnings pressure if Brent falls below $90. Watch TotalEnergies as a potential CAC headwind. The broader Euronext data shows CAC market cap at €2.67 trillion — a substantial platform that makes even 1% moves material for European pension and fund flows. The ECB rate decision on June 11 is the next major CAC catalyst.

Brent Crude Oil — Session Analysis
Hormuz peace trade in full force · Structural repricing risk · 25 May 2026
Technical Analysis
Brent crude has broken decisively below the psychologically critical $100 level, trading at $98.73 with a session range of $97.80–$101.20. This is a two-week low and the largest single-day percentage decline since the initial ceasefire on April 8, when Brent plunged 14% to $93.96. The $100 level acts as the key psychological resistance — a reclaim above $101 would signal Hormuz deal optimism is fading. To the downside, $93–94 is the next major technical level, and a confirmed Hormuz reopening could see a swift move toward $80–85, closer to the pre-war fair value band. Brent fell more than 5% in the prior week (22 May close: $103.54) amid the same diplomatic signals — today’s move accelerates that trajectory.
Fundamental Context
The key fundamental issue is whether a deal is real or another false dawn. The war began in late February 2026, pushing Brent from ~$70 to a peak above $114 — a 60%+ premium driven entirely by Hormuz supply disruption risk. Each credible step toward reopening should structurally reprice crude lower. Today’s catalysts: Rubio confirming “final stages,” Qatar dispatching a team to Tehran, and growing media reports that Iran is reviewing Washington’s latest proposal. The critical unknown: Iran’s Supreme Leader has separately ordered that near-weapons-grade uranium must not be sent abroad — a key US demand. That sticking point could reignite the conflict and send Brent surging. Brent remains highly headline-sensitive with ±5% daily moves possible on single news items. The Strategic Petroleum Reserve saw its largest-ever single-week withdrawal (nearly 10mn barrels) the prior week — a structural bearish supply signal regardless of geopolitics.

“Markets are once again leaping on any signs of de-escalation between the United States and Iran, sending crude tumbling and equities surging — but the uranium sticking point means this rally could unwind as fast as it built.” — Reuters Market Commentary · 25 May 2026
This Week’s High-Impact Events
Key data releases, central bank speakers and risk events · Week of 25–30 May 2026
No significant European economic releases are scheduled for today (Monday 25 May). UK Bank Holiday silences all LSE-related data. US Memorial Day shuts all American reporting. This session is headline-driven, not data-driven — monitor geopolitical newswires continuously.
| Time (CET) | Country | Event | Impact | Forecast | Previous | Actual |
|---|---|---|---|---|---|---|
| All Day | 🇬🇧 UK | Spring Bank Holiday — LSE Closed | ● CRITICAL | — | — | CLOSED |
| All Day | 🇺🇸 US | Memorial Day — All US Markets Closed | ● CRITICAL | — | — | CLOSED |
| Ongoing | 🌍 Iran/US | US-Iran Nuclear / Hormuz Peace Talks (Qatar mediation) | ● CRITICAL | Final stages | Stalled | In progress |
| TUESDAY 26 MAY — KEY DATA RESUMES | ||||||
| 09:00 | 🇩🇪 Germany | Flash Manufacturing PMI (May) | ● HIGH | 47.8 | 46.9 | — |
| 09:00 | 🇩🇪 Germany | Flash Services PMI (May) | ● HIGH | 50.2 | 49.6 | — |
| 09:30 | 🇬🇧 UK | Flash Manufacturing PMI (May) | ● HIGH | 46.5 | 45.4 | — |
| 09:30 | 🇬🇧 UK | Flash Services PMI (May) | ● HIGH | 51.0 | 50.5 | — |
| 10:00 | 🇪🇺 Eurozone | Flash Composite PMI (May) | ● HIGH | 50.5 | 49.9 | — |
| LATER THIS WEEK | ||||||
| Wed 27 | 🇩🇪 Germany | Ifo Business Climate Index (May) | ● MED | 88.5 | 86.9 | — |
| Thu 28 | 🇪🇺 Eurozone | ECB Meeting Minutes (Apr 30 meeting) | ● HIGH | Hawkish | — | — |
| Fri 29 | 🇩🇪 Germany | Preliminary CPI (May) | ● HIGH | 2.4% | 2.7% | — |
| Fri 29 | 🇺🇸 US | Core PCE Price Index (Apr) | ● HIGH | 2.6% | 2.6% | — |
Key Questions for Today’s Session
CSFX Research Desk answers the questions traders are asking right now
This is a maximum-caution session. Double holiday closure (UK + US) creates thin liquidity where intraday moves of 0.5–1.0% in EUR/USD or 100+ points in DAX/CAC can occur on minimal volume. All analysis above is educational — not financial advice. Past performance is no guarantee of future results. CFDs involve significant risk of loss.