Company Overview
Tesla, Inc. – Fundamental Snapshot
Key financial metrics and valuation data for TSLA as of May 25, 2026. Tesla is valued as an AI and robotics platform, not a traditional automaker.
Technical Analysis
TSLA Technical Summary – May 25, 2026
Daily chart analysis of Tesla using Fibonacci retracement levels, RSI, EMA, and ascending channel structure. All signals focused on the next 24-hour price window.
RSI (14)
61.36
Bullish Momentum
RSI Signal Line
58.30
Positive Cross
Short-Term EMA
~05
Price Above
Channel Structure
Ascending
Higher Lows
24H Bias
Cautious
At Resistance
Fibonacci Retracement Levels (Low $273.21 → High $498.83)
| Fib Level |
Price (USD) |
Role |
Status |
| 0.000 (Top) | $498.83 | Major Resistance | 🔴 Target Above |
| 0.236 | $445.59 APPROACHING | Immediate Resistance | 🔶 Testing Now |
| 0.382 | $412.65 | Primary Support | ✅ Strong Floor |
| 0.500 | $386.02 | Mid Support | ✅ EMA Zone |
| 0.618 | $359.37 | Golden Ratio Support | ✅ EMA 50 Area |
| 0.786 | 61.75 | Deep Support | ✅ Structural |
| 1.000 (Base) | $273.21 | Full Retracement | 🛡 Prior Low |
🔴 Key Resistance Levels
0.236 Fib
$445.59
Swing High / 0.000 Fib
$498.83
52-Week High
$498.83
Short EMA Resistance
25.09
🟢 Key Support Levels
0.382 Fib
$412.65
0.500 Fib / EMA Zone
$386.02
Long-Term EMA
$370.00
0.618 Golden Ratio
$359.37
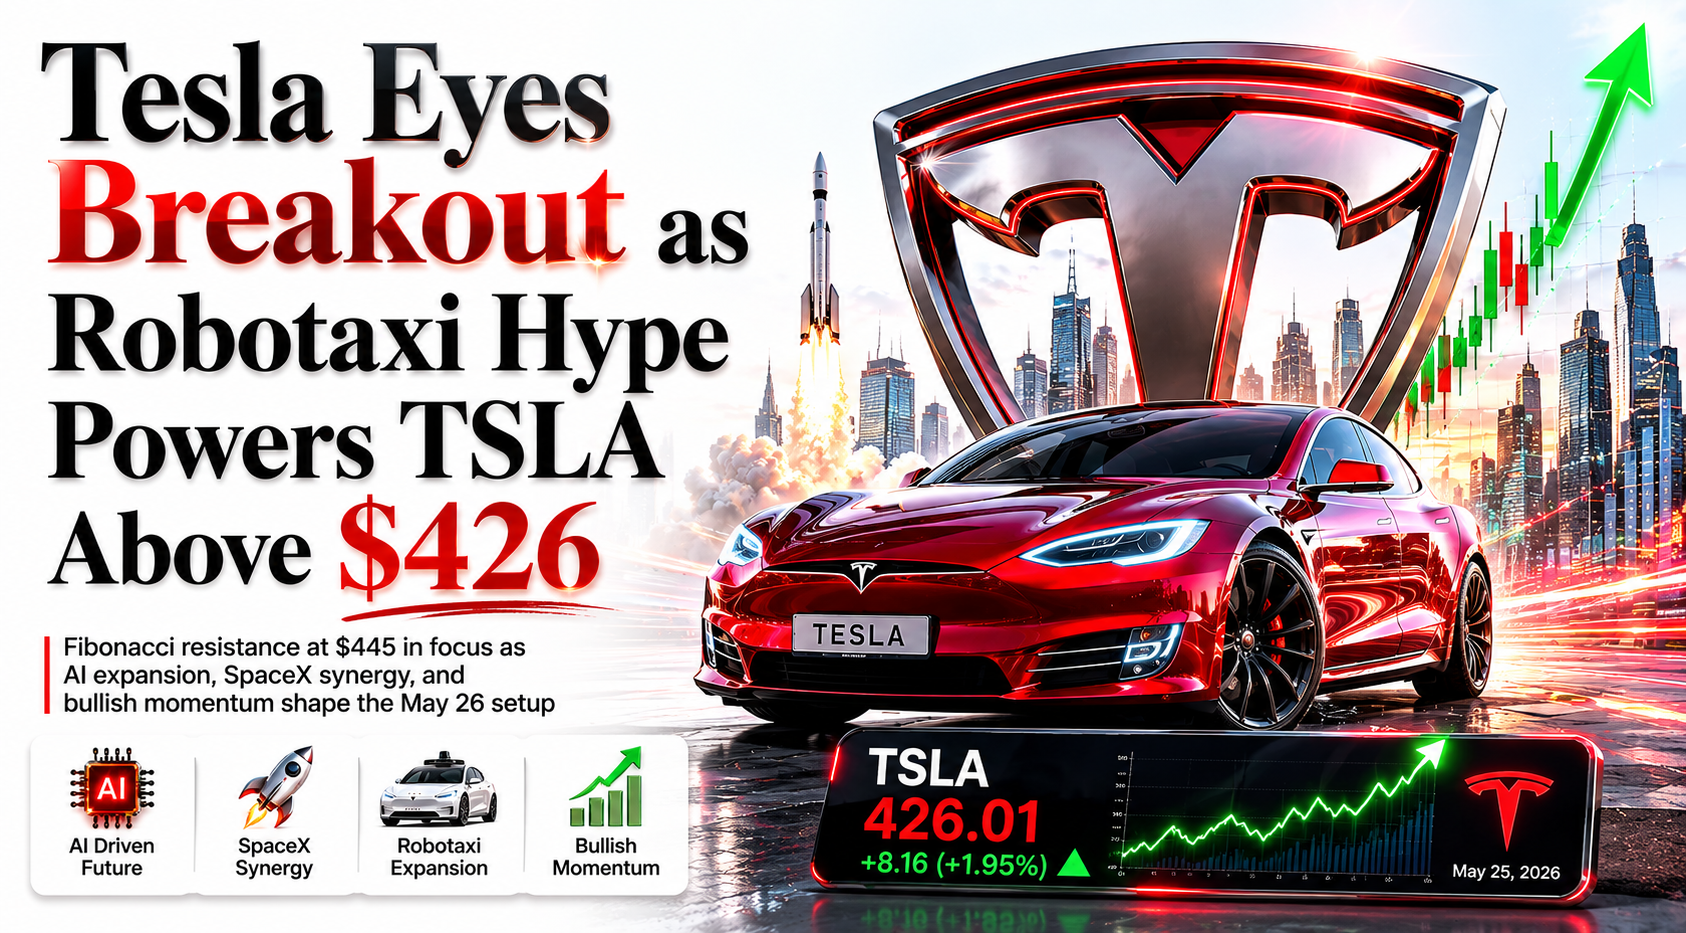
Tesla stock is currently approaching the 0.236 Fibonacci resistance at $445.59, trading at $426.01 which sits between the 0.382 ($412.65) and 0.236 ($445.59) Fib levels. The RSI at 61.36 signals bullish momentum with room to grow before reaching the overbought zone (70). The stock has recovered strongly from the 52-week low near $273.21. A confirmed daily close above $445.59 opens the path to $498.83 (Fib 0 / 52W High). Failure to hold above $412.65 (0.382 Fib) may trigger a pullback. Note: NASDAQ is closed May 25 for Memorial Day — next major price action at the May 26 open.
Fundamental Drivers
Key News Impacting Tesla in Next 24 Hours
These are the most significant developments expected to drive TSLA price action on and after May 26 market open, ranked by impact.
🟢 Bullish · High Impact
Robotaxi Nationwide Expansion – Musk Confirms 2026 Rollout
Elon Musk confirmed at the Smart Mobility Summit that unsupervised FSD robotaxis will expand from Texas (Austin, Dallas, Houston) to a nationwide service before end of 2026. This narrative-shifting development positions Tesla as an “AI Mobility Platform,” driving premium valuation multiples.
🟢 Bullish · High Impact
SpaceX S-1 IPO Filing – Terafab Joint Facility Announced
SpaceX’s S-1 IPO filing (Goldman Sachs lead-left) and the announcement of a joint Tesla-SpaceX Terafab facility in Austin (two advanced chip factories) strengthens the narrative of an eventual SpaceX-Tesla convergence. Wedbush maintained its $600 price target on TSLA with “Outperform” rating.
🟢 Bullish · Medium Impact
Tesla FSD Approved in Belgium/Europe – International Expansion
Reuters reported Tesla received approval to test Full Self-Driving software in the Flanders region of Belgium, marking a significant milestone in European FSD expansion. This opens a multi-billion dollar market opportunity for Tesla’s autonomous technology licensing and robotaxi services.
🟢 Bullish · Medium Impact
Q1 2026 Earnings Beat – EPS /bin/sh.41 vs. /bin/sh.35 Estimated
Tesla’s last reported quarter showed EPS of /bin/sh.41, beating the /bin/sh.35 consensus estimate by 15.87%. The next earnings report is due July 21, 2026. Q2 estimates stand at /bin/sh.44 EPS. A strong earnings trend supports the current technical recovery.
🔴 Bearish · Medium Impact
Robotaxi Crashes in Austin – Safety Scrutiny Intensifies
Two instances of Tesla’s supervised robotaxis were involved in low-speed crashes in Austin, placing the company under regulatory scrutiny. While no injuries occurred and no passengers were on board, the incidents invite NHTSA investigation and may delay unsupervised expansion timelines.
🔴 Bearish · Medium Impact
Waymo Competitive Threat Growing
Alphabet’s Waymo operates over 1,500 autonomous vehicles and plans to add ~2,000 more, maintaining a significant operational lead over Tesla’s limited robotaxi fleet. Waymo’s established presence in multiple cities provides a direct competitive benchmark that raises investor expectations for Tesla’s autonomous rollout speed.
⚪ Neutral · Watch
Musk Hints at xAI-Tesla Merger – Strategic Positioning
xAI (which merged with X in February 2026) and Tesla cross-integration hints continue. Musk’s Grok AI and Tesla’s FSD share training infrastructure. A formal xAI-Tesla merger would dramatically expand Tesla’s AI portfolio but introduces valuation and dilution risks.
⚪ Neutral · Market Open
U.S. Memorial Day – NASDAQ Closed May 25
U.S. markets including NASDAQ are closed on Memorial Day (May 25). All pre-market positioning will crystallize at the May 26 market open. Consumer Confidence data at 10 AM ET on May 26 will be the first major macro trigger affecting TSLA’s opening direction.
Event Calendar
Scheduled Events · Next 24 Hours (TSLA)
Economic and corporate events directly relevant to Tesla’s stock price over the next 24 hours.
May 25
All Day
🇺🇸 U.S. Memorial Day – NASDAQ Market Holiday
NASDAQ closed. No TSLA cash market trading. Pre-market futures may reflect weekend developments. Positions cannot be added or exited until May 26 open. Monitor any SpaceX or Tesla news that breaks over the long weekend.
HIGH
May 26
9:30 AM ET
🔔 NASDAQ Market Reopens – Post-Holiday Gap Risk
First chance to react to long-weekend news flow. Tesla at $426.01 approaches the 0.236 Fibonacci resistance at $445.59 — watch for a gap open. Pre-market futures (available from 4 AM ET) will provide early direction signals. High volume expected at open.
HIGH
May 26
10:00 AM ET
📊 Conference Board Consumer Confidence (May 2026)
A strong reading boosts risk-on sentiment and benefits TSLA. A weak reading (below 95) signals economic slowdown, hurting high-multiple AI stocks like Tesla most sharply. With TSLA at a critical Fibonacci resistance, this data could be the trigger for the next directional move.
HIGH
May 26
Ongoing
🚀 SpaceX IPO / Tesla Merger News Watch
Any update on SpaceX’s IPO timeline, Goldman’s role, or Elon Musk’s statements linking SpaceX and Tesla strategies could move TSLA significantly. The $600 Wedbush price target is partly premised on strategic consolidation narratives.
MEDIUM
Jul 21, 2026
After Close
📋 Tesla Q2 2026 Earnings Report (Upcoming – Key Watch)
Q2 earnings are the next major corporate catalyst for TSLA. Consensus EPS estimate: /bin/sh.44. Any robotaxi revenue numbers, FSD adoption metrics, or Optimus/robot production updates will be the focus. Pre-positioning will begin in the weeks ahead.
HIGH
Trade Setup
Tesla (TSLA) 24-Hour Trade Setup
Based on Fibonacci structure, RSI momentum, ascending channel, and fundamental backdrop. TSLA at $426.01 is trading between the 0.382 ($412.65) and 0.236 ($445.59) Fib levels — a bullish consolidation zone.
📍 Entry Strategy
$420 – $435
Two-tier approach: (1) Buy pullback to $420 on May 26 open weakness. (2) Buy confirmed breakout above $445.59 (0.236 Fib) on volume above 50M shares. Do not chase opens. Wait for first 15-minute candle confirmation.
🛑 Stop Loss
$400.00
Below the 0.382 Fibonacci support at $412.65 and the recent consolidation base. A daily close below $400 invalidates the ascending channel structure. Tight stop for aggressive traders: $410.00.
🎯 Take Profit 1
$445.59
Psychological round number and prior consolidation zone. Take 40% of position here. Strong resistance area with likely institutional selling.
🎯 Take Profit 2
$498.83
0.000 Fibonacci level / 52-Week High ($498.83). Full exit target. Close remaining 60% here or trail stop above $460 if momentum is strong.
Risk/Reward (TP1)
1 : 1.5
Risk/Reward (TP2)
1 : 3.0
Position Size
1–3% Capital
Setup Validity
24–48 Hours
Pre-Market Check
4 AM ET May 26
Confidence Level
Medium-High
⚠️ Key Condition: The TSLA setup is bullish with confirmation needed. Tesla at $426.01 is consolidating between Fibonacci levels — approaching the 0.236 resistance at $445.59. A confirmed close or breakout above $445.59 with strong volume would be the aggressive long trigger. If Consumer Confidence data at 10 AM ET on May 26 disappoints, expect TSLA to pull back toward $412–$420 — which would be a better, lower-risk entry for the TP2 target.
Alternative Bearish Scenario: If TSLA opens weak on May 26 and drops below $410 on volume, the bullish channel structure is at risk. In this scenario, the 0.382 Fib at $412.65 and the 0.500 Fib at $386 become the downside targets. A daily close below $400 should prompt a full exit of any long position.
FAQ
Frequently Asked Questions – Tesla TSLA May 2026
Answers to key questions about Tesla’s current technical setup, fundamental drivers, and near-term price outlook.
What is Tesla’s stock price target for the next 24 hours on May 26, 2026?
Tesla’s primary 24-hour target is $445.59 (TP1, 0.236 Fib resistance) and $498.83 (TP2, the 0.000 Fibonacci / 52-Week High). These targets assume a confirmed breakout above $445.59. Analyst firm Wedbush has a 12-month price target of $600 for TSLA, underpinned by the robotaxi and AI platform thesis.
Why is Tesla trading at such a high P/E ratio of 389x?
Tesla’s P/E of 389x reflects the market’s pricing of Tesla as an AI and robotics company, not a conventional automaker. The valuation embeds significant optionality value for the robotaxi service (targeting paid service launch in June 2026), Optimus humanoid robots, FSD software licensing, and potential SpaceX-Tesla strategic consolidation. Investors are paying a premium for the AI/autonomous mobility platform narrative.
How does the SpaceX IPO affect Tesla stock in the next 24–48 hours?
SpaceX’s S-1 filing created both positive and complex effects on Tesla. Positively, it validates Elon Musk’s technology ecosystem and opens the possibility of a future SpaceX-Tesla merger (Wedbush’s “holy grail” scenario). However, it also means investor capital may temporarily rotate from TSLA to SpaceX IPO positioning. Net effect is mildly positive to neutral in the immediate 24-hour window, with strong potential for longer-term upside if merger talks progress.
What is the recommended stop loss for Tesla and why?
The recommended stop loss is $400.00, approximately 3.2% below the entry mid-point of $427.50. This is below the 0.382 Fibonacci support at $412.65 and provides a clear technical invalidation level. A daily close below $400 would represent a technical breakdown, signaling a deeper correction toward $386 (0.500 Fib) is underway.
Is Tesla’s robotaxi rollout on track to impact stock in 2026?
Tesla operates unsupervised FSD robotaxis in Austin, Dallas, and Houston, Texas. Musk confirmed expansion to more U.S. cities before end of 2026. However, the rollout has faced delays — originally targeting half the U.S. population by end-2025, now limited to three Texas cities with small operational areas. Despite the slower-than-promised pace, the market is pricing forward progress. Any acceleration update or new city launch will act as a positive catalyst for TSLA.
What Fibonacci level should Tesla bulls watch most closely?
The 0.236 Fibonacci level at $445.59 is the most critical resistance to watch. Tesla’s current price of $426.01 is approaching this zone from below. A daily close above $445.59 would confirm breakout and target $498.83 (52W high). A rejection and close below $412.65 (0.382 Fib) would bring $386.02 (0.500 Fib) into play as the next support.
Conclusion
TSLA Trade Setup Summary
Tesla (TSLA) – 24-Hour Setup · May 25–26, 2026
Tesla’s daily chart presents a constructive setup at $426.01. The stock is consolidating between the 0.382 Fibonacci support ($412.65) and approaching the 0.236 resistance ($445.59), recovering from the 52-week low of $273.21. The RSI at 61.36 confirms genuine bullish momentum, and the ongoing recovery — with consistent higher lows — reinforces the bull case.
The fundamental picture provides strong longer-term support: confirmed nationwide robotaxi expansion by end-2026, the joint Terafab facility with SpaceX, a Q1 EPS beat of 15.87%, and European FSD approval. Short-term risks include robotaxi safety incidents, Waymo’s competitive lead, and the macro pressure from PCE inflation at 4.5%.
The 24-hour trade targets breakout above $445.59 with volume confirmation. Consumer Confidence data at 10 AM ET on May 26 is the primary macro trigger. A confirmed breakout targets $498.83 (52W high). Failure to hold $412.65 keeps $386–$412 as the consolidation zone.
Entry: 24–28
Stop: $400.00
TP1: $445.59
TP2: $498.83
R/R: 1:1.5 – 1:3.0
Bias: Conditional Long
Next Trigger: May 26 Open
Risk Disclaimer: This report is produced by CSFX Research for informational and educational purposes only. It does not constitute financial advice, investment recommendations, or a solicitation to buy or sell any financial instrument. Tesla (TSLA) is a highly volatile stock with a beta of 1.79. All trading involves substantial risk. Past performance is not indicative of future results. Cryptocurrency and equity markets can move rapidly and unpredictably. Always conduct your own research and consult a licensed financial advisor before trading. CSFX Research is not responsible for losses incurred based on this report. Data sourced from TradingView, CNBC, Reuters, Bloomberg, Benzinga, Morningstar, and public market data as of May 25, 2026.