Mining Stocks Surge & Stoxx 600 Eyes 10-Month High | Capital Street FX European Brief · 26 May 2026
FTSE Leads European Recovery
as Mining Stocks Surge & Stoxx 600 Eyes 10-Month High
Brent Crude $99.12 ▲ · ECB Rate 2.00% · BoE Rate 3.75% · 10Y Bund 3.12%
Full Trade Ideas · Technical Charts · Economic Calendar · ECB Watch · Key Levels
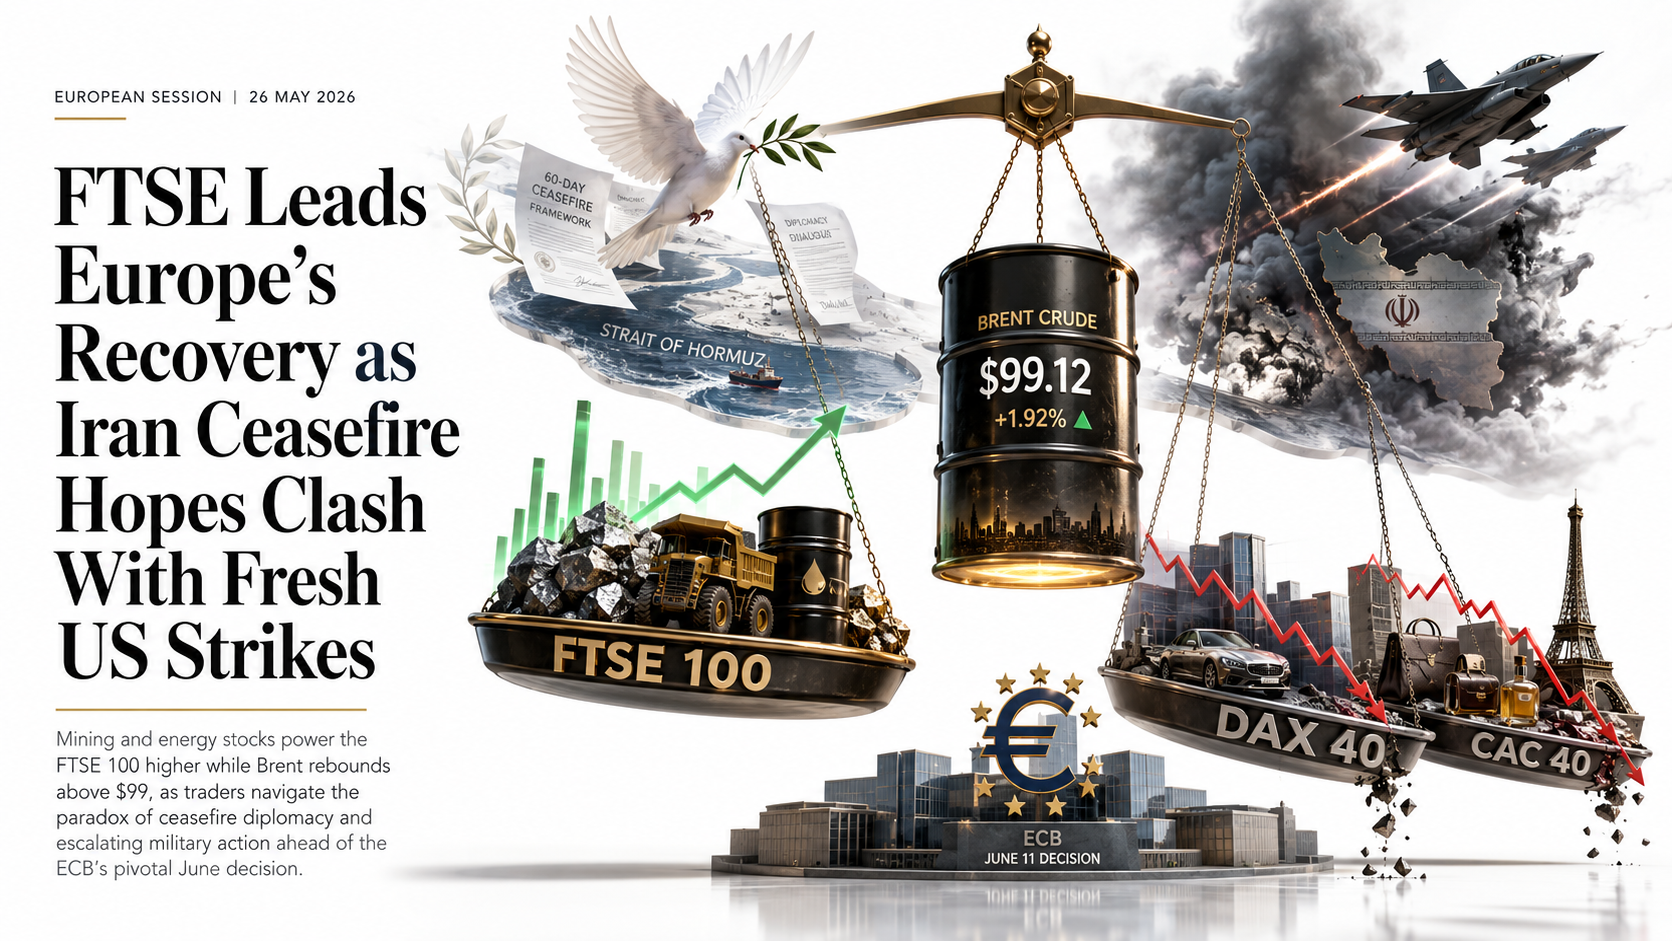
Three forces are pulling European markets in different directions this Tuesday: a historic 60-day US-Iran ceasefire extension announced overnight that lifted risk appetite on Monday, fresh US military strikes in southern Iran today that are sowing renewed uncertainty, and the FTSE 100’s long-awaited return from the UK Spring Bank Holiday — the first London session in three days.
The ceasefire extension framework, confirmed by a senior US administration official on May 25, extends the truce 60 days and outlines a phased de-mining and reopening of the Strait of Hormuz. Markets were elated on Monday — the DAX surged 2.01% and the CAC 40 rose 1.76% as oil risk premium deflated. Today, however, US Central Command announced “self-defence” strikes on Iranian missile launch sites and vessels attempting to lay mines — tempering the euphoria and sending Brent back above $99.12, up 1.92% from Monday’s thin-liquidity close.
The FTSE 100 is outperforming its continental peers, opening at 10,524 (+0.55%), driven by mining stocks catching up after the three-day absence and energy-sector resilience. GBP/USD holds above 1.3510 as UK markets return. Meanwhile, the DAX and CAC are retreating — a classic “sell the news” reaction to Monday’s outsized gains, with the pan-European Stoxx 600 edging 0.18% lower at the open.
The ECB’s June 11 meeting is the next big macro landmark. Markets are currently split between a 25bps cut to 1.75% (if energy deflation from Hormuz reopening proceeds) or a hold at 2.00% if oil stays elevated and inflation remains sticky. Today’s GfK German Consumer Confidence and French consumer data will shape expectations. Position sizes should respect the Iran headline risk — the US military is striking even while Trump calls the talks “progressing well,” so volatility remains a constant companion.
European Session — 26 May 2026 · 09:30 CET
Source: Investing.com / TradingView / Capital Street FX Research · Prices as of session open
Six Stories That Define the European Session
Colour-coded by market impact · RED = immediate mover · AMBER = watch · GREEN = positive catalyst
EUR/USD & GBP/USD — European Session Trade Setups
Entry · Stop Loss · Take Profit · Technical Analysis · Fundamental Context
Technical Analysis
EUR/USD has been in a corrective pullback from the 1.1840 multi-year high reached in early May. The pair found support at 1.1580 on May 22 (38.2% Fibonacci retracement of the full 2025 rally from 1.0440 to 1.1840). The rebound since then has been tepid — today’s price of 1.1644 sits below both the 20-day EMA (1.1685) and the descending 4H trendline. RSI on the daily chart is at 46 — below the neutral line and drifting lower. The MACD on the 4H is in negative territory with no crossover signal. The path of least resistance is lower, targeting the 50-day SMA at 1.1550, which coincides with the May 15 low. A break above 1.1720 (weekly resistance zone) would negate the short setup and reopen the 1.1840 target.
Fundamental Context
The euro faces a peculiar double headwind today. The ceasefire extension, announced yesterday, was initially EUR-positive (risk-on, oil deflation = less European energy burden). But today’s US military strikes immediately reintroduced supply-risk uncertainty, supporting the US dollar’s safe-haven bid. Simultaneously, the EU Commission’s GDP downgrade to 0.9% for 2026 — citing the Iran war energy shock — weakens the fundamental growth differential that had supported the EUR’s rally. The ECB’s June 11 meeting is now a genuine coin-flip between a cut to 1.75% and a hold at 2.00%, creating policy ambiguity that typically pressures the currency. On the positive side: Pakistan and Qatar mediators indicate the final Hormuz deal is “days away,” which could quickly reverse EUR/USD lower toward 1.1700+ on a confirmed peace deal. Manage leverage tightly given geopolitical binary risk.

Technical Analysis
GBP/USD is holding above the key 1.3490 support level — the 20-day EMA — after three days of relatively thin holiday trading. The structure remains constructive: the pair has maintained higher highs and higher lows since the March 2026 low at 1.2790. The 4H chart shows a bullish flag consolidation pattern between 1.3480 and 1.3550 — a textbook continuation structure. A clean break above 1.3555 would trigger an acceleration toward the 1.3634 May high and ultimately the 1.3760 resistance cluster (52-week high zone). RSI on the daily is at 52 — neutral with room to extend. The bear case requires a daily close below 1.3440.
Fundamental Context
Cable is being supported today by the FTSE 100’s post-holiday reopening dynamic — dollar selling against the pound as UK asset managers rebalance after the bank holiday absence. The BoE remains on hold at 3.75% with UK CPI at 3.3% — the highest rate in the G7 after the Iran war energy shock pushed UK energy costs sharply higher. This rate differential with the ECB (3.75% vs 2.00%) continues to favour GBP over EUR. UK borrowing fell by nearly £20 billion to £132 billion for the financial year ending March 2026, a fiscal positive. The main risk to GBP today is any escalation in US-Iran military activity that triggers broad risk-off — in that scenario, GBP would sell off against the dollar regardless of fundamentals. Access GBP/USD with tight spreads via Capital Street FX.

FTSE 100 · DAX 40 · CAC 40 — Session Trade Ideas
FTSE catching up · DAX selling off · CAC consolidating · All driven by Iran ceasefire volatility
Technical Analysis
The FTSE 100 is gapping up today as London reopens after the Spring Bank Holiday. The index had closed at approximately 10,466 on Friday May 23, missing Monday’s European rally driven by the Iran ceasefire extension news. Today’s open at 10,524 represents both the catch-up buying and the Brent Crude rebound from today’s US strikes in Iran. Technically, 10,490 is the key intraday support level — the midpoint of the current consolidation range. Above 10,550, the next technical target is 10,680 (the May 12 reaction high). The 50-day SMA is rising and sits at approximately 10,310 — a significant distance below current levels, confirming the medium-term uptrend is intact. RSI at 59 — bullish but not overbought.
Fundamental Context
The FTSE 100’s sector composition makes it uniquely well-positioned on a day when Brent Crude bounces and mining stocks play catch-up. Shell and BP together represent approximately 18% of the index — a direct beneficiary of oil’s recovery above $99.12 after last week’s peace-deal-driven selloff. Rio Tinto, Glencore, and Anglo American (combined ~12%) are recovering from a relatively quiet Monday. HSBC — the index’s largest constituent at roughly 8% — is sensitive to any improvement in Asia risk appetite from the ceasefire news. The tailwind from elevated interest rates (BoE at 3.75%) continues to support UK bank earnings. The main near-term headwind: a strong GBP is a mild drag on FTSE 100 multinational earnings translated back into sterling. Access FTSE 100 CFDs at Capital Street FX.

Technical Analysis
The DAX 40 surged 2.01% on Monday (May 25) as the ceasefire extension news lifted risk appetite across continental European markets. Today’s modest pullback of −0.87% to 25,214 is the classic “sell-the-news” correction after an outsized one-day move. From a pure technical standpoint, the DAX is approaching the upper boundary of its recent 24,800–25,450 range. RSI on the daily chart has moved into overbought territory above 70 following Monday’s surge — a warning signal for short-term traders. The 25,050 level is the first meaningful support, coinciding with the May 21 reaction low and the lower bound of the near-term range. A sustained break above 25,450 would target the all-time high zone near 25,800. The short setup works while price fails to break and hold above 25,400.
Fundamental Context
Germany continues to face the sharpest stagflation dilemma in Western Europe. The Economics Ministry has cut the 2026 GDP growth forecast to just 0.5% — the worst among major EU economies. The combination of elevated energy costs (Brent at $99.12 remains far above pre-war February levels of ~$70), the Iran-war disruption to Mittelstand export supply chains, and Trump tariff exposure on German auto exports creates a structurally difficult backdrop for German equities. Today’s US military strikes in Iran — occurring despite ceasefire negotiations — add fresh uncertainty. Rheinmetall (defense) had rallied sharply on ceasefire optimism; today’s strikes may see partial defense-sector reversal. Volkswagen, BMW, and Mercedes continue to trade under EV transition cost pressure. ECB ambiguity around June 11 limits the “rate catalyst” upside for German stocks.

Technical Analysis
The CAC 40 rose 1.76% on Monday before today’s profit-taking dragged the index to 8,262 (−0.44%). The 8,220 level is now the critical near-term support — it represents the 20-day EMA and the neckline of the breakout from late April’s consolidation. A hold above 8,220 keeps the medium-term bullish structure intact, with a fresh push toward 8,380–8,400 (the May 2026 high and resistance zone) as the next target. RSI at 62 is constructive — pulled back from Monday’s near-overbought reading of 71. The bear case requires a daily close below 8,140 (the 50-day SMA), which would trigger stops and open a retest of the 8,000 psychological level.
Fundamental Context
The CAC 40 has more defensive diversification than the DAX, with luxury (LVMH, Hermès, Kering ~20%), pharma (Sanofi ~5%), energy (TotalEnergies ~7%), and infrastructure (Vinci ~4%) providing sector cushioning. The luxury sector was a big winner on ceasefire optimism — any ceasefire deal improving China consumer sentiment is a direct positive for LVMH and Hermès. TotalEnergies benefits directly from Brent’s rebound to $99.12. The risk factor today: Kering has faced revenue pressure from the China slowdown, and any fresh geopolitical headlines that worsen global risk appetite hit luxury hard. French consumer confidence data (released today) will provide the domestic demand picture. Politically, the French government remains stable following last year’s electoral reshuffle, removing a key tail risk that had plagued the CAC in 2025. Trade CAC 40 CFDs at Capital Street FX.

Brent Crude Oil — The Iran War Premium Returns
US military strikes today re-ignite supply disruption risk despite 60-day ceasefire extension framework
Technical Analysis
Brent Crude has been in a sharp corrective phase, falling from near $110 in mid-May to a low around $93–94 last week as peace deal optimism deflated the Iran war premium. The bounce today to $99.12 (+1.92%) comes after US military strikes in southern Iran reignited supply-disruption fears. From a technical standpoint, $95.30 is the key support level — the 23.6% Fibonacci retracement of the February-May rally from $68 to $110. A confirmed hold above $97.00 on the daily close would suggest the correction is over and open a retest of the $100 psychological level and $103 resistance. The 14-day RSI is at 38 — approaching oversold territory on the recent correction, providing a technical justification for the bounce. The short-term momentum indicator (MACD) is still in bearish territory but beginning to flatten, a precursor to a potential crossover.
Fundamental Context
The binary trade in Brent Crude has never been starker: today you have simultaneously a 60-day ceasefire extension framework (bearish — Hormuz de-mining means more supply) and fresh US military strikes in Iran (bullish — supply disruption risk). The market is caught between two live forces. The TradingEconomics consensus price for today is $98.11 — Brent has recovered from a thin-liquidity Monday selloff to $94.46 open. Saudi Aramco has previously warned that global oil markets will not normalise until 2027 if Hormuz stays blocked beyond mid-June. The 60-day ceasefire extension reduces this risk, but today’s military strikes suggest the “ceasefire” is not a ceasefire in the traditional sense. Global oil inventories are at 101 days of demand per Goldman Sachs — not at crisis levels, providing some downside buffer. Use wide stops (minimum $1.80/bbl) given extreme headline volatility. Access Brent CFDs at Capital Street FX.

Key Data Releases — Tuesday, 26 May 2026
All times CET · Impact colour-coded · Actual vs Forecast vs Previous
| Time (CET) | Country | Event | Impact | Forecast | Previous | Actual |
|---|---|---|---|---|---|---|
| 08:00 | 🇩🇪 Germany | GfK Consumer Climate (Jun) | HIGH | −27.4 | −29.3 | −26.9 |
| 08:45 | 🇫🇷 France | Consumer Confidence (May) | MEDIUM | 89 | 87 | 91 |
| 10:00 | 🇪🇺 Eurozone | M3 Money Supply YoY (Apr) | LOW | 4.2% | 4.0% | Pending |
| 11:00 | 🇪🇺 Eurozone | ECB Wage Growth Q1 (Negotiated) | HIGH | 3.8% | 4.1% | Pending |
| 13:00 | 🇩🇪 Germany | ECB’s Schnabel Speech (Inflation) | HIGH | — | — | Pending |
| 16:00 | 🇺🇸 United States | Conference Board Consumer Confidence (May) | MEDIUM | 98.5 | 97.2 | Pending |
| 16:00 | 🇺🇸 United States | Richmond Fed Manufacturing Index (May) | LOW | −4 | −7 | Pending |
| All Day | 🌍 Global | US-Iran Peace Talks: Hormuz Framework Finalisation | HIGH | — | — | Live / Watch headlines |
The ECB explicitly monitors negotiated wage growth as a key inflation indicator before adjusting rates. A reading above 3.8% today at 11:00 CET (previous: 4.1%) would reduce June 11 cut expectations and support the EUR. A significant downside miss (below 3.5%) would increase the probability of a June cut to 1.75% and could weigh on EUR/USD below the 1.1580 support.
Trader Questions — European Session, 26 May 2026
The Iran-US War — Where We Are on 26 May 2026
The US-Iran war began on 28 February 2026 when the US and Israel launched coordinated strikes on Iranian nuclear facilities. The immediate market consequences were seismic: Brent Crude surged from $68 to over $110 (+62%), the Strait of Hormuz was closed to commercial shipping, and European energy costs spiked. European indices fell 15–20% at the March 2026 lows before recovering on ceasefire hopes.
A two-week ceasefire was announced on 7–8 April 2026, brokered by Pakistan. The Strait was partially reopened, and Brent fell sharply. But the ceasefire was repeatedly described as “on life support” — the US and Iran continued trading fire in the Strait, and Trump said the truce was “unbelievably weak.” Between April and late May, Brent traded between $88 and $110 depending on the day’s headlines.
On 25 May 2026, a senior US administration official confirmed a 60-day ceasefire extension framework — the most significant diplomatic development since April. The framework includes a phased de-mining and reopening of the Strait of Hormuz and lays the groundwork for a “final deal.” Pakistan and Qatar are acting as mediators. Iranian officials confirmed that Ayatollah Khamenei has “in principle” agreed to limits on uranium enrichment. However, as of today (26 May), US Central Command has simultaneously announced self-defence strikes on Iranian missile launch sites — demonstrating that the “ceasefire” is a diplomatic concept rather than a military reality on the ground. Iran has not publicly condemned today’s strikes, possibly to preserve the negotiating framework.
The financial market implication: Brent Crude will remain volatile between $90 and $105 until a formal Hormuz reopening with verified physical ship transit occurs. Until that moment, the war premium is not fully priced out. European equities will oscillate around the ceasefire-escalation news cycle. EUR/USD remains in a structurally supportive environment medium-term (rate differentials, European recovery story) but faces tactical selling pressure on risk-off days.
Session Summary & Positioning Outlook
The dominant theme of today’s European session is the paradox of simultaneous ceasefire and conflict. The 60-day ceasefire extension framework — a genuine diplomatic breakthrough — was overshadowed by US military strikes in southern Iran this morning. Markets are rationally confused: risk-on (ceasefire deal) and risk-off (military strikes) signals are arriving simultaneously.
The FTSE 100 is the session’s clear outperformer at +0.55%, catching up after Monday’s bank holiday closure while benefiting from Brent’s rebound and mining-sector strength. DAX and CAC are selling off modestly from Monday’s outsized gains — a healthy and expected consolidation rather than a trend reversal. EUR/USD at 1.1644 faces dual headwinds: a firm USD on safe-haven demand from Iran strikes, and ECB policy ambiguity ahead of June 11. GBP/USD at 1.3483 is under modest pressure among the two major pairs, supported by post-holiday positioning and the UK’s elevated BoE rate.
Brent Crude at $99.12 is the key instrument to watch for the remainder of the session. If US strikes are described by Iran as a ceasefire violation and talks break down, expect Brent to spike toward $102–105 and European indices to sell off sharply. If Iran absorbs the strikes diplomatically (as appears to be happening this morning), Brent holds below $100 and equities stabilise. This is the binary that governs every other asset class today.
Trade carefully. Use leverage conservatively given geopolitical binary risk. All trade ideas in this brief carry a higher-than-normal scenario tail risk.
Open a Live AccountFTSE Leads European Recovery
as Mining Stocks Surge & Stoxx 600 Eyes 10-Month High
Brent Crude $99.12 ▲ · ECB Rate 2.00% · BoE Rate 3.75% · 10Y Bund 3.12%
Full Trade Ideas · Technical Charts · Economic Calendar · ECB Watch · Key Levels
Three forces are pulling European markets in different directions this Tuesday: a historic 60-day US-Iran ceasefire extension announced overnight that lifted risk appetite on Monday, fresh US military strikes in southern Iran today that are sowing renewed uncertainty, and the FTSE 100’s long-awaited return from the UK Spring Bank Holiday — the first London session in three days.
The ceasefire extension framework, confirmed by a senior US administration official on May 25, extends the truce 60 days and outlines a phased de-mining and reopening of the Strait of Hormuz. Markets were elated on Monday — the DAX surged 2.01% and the CAC 40 rose 1.76% as oil risk premium deflated. Today, however, US Central Command announced “self-defence” strikes on Iranian missile launch sites and vessels attempting to lay mines — tempering the euphoria and sending Brent back above $99.12, up 1.92% from Monday’s thin-liquidity close.
The FTSE 100 is outperforming its continental peers, opening at 10,524 (+0.55%), driven by mining stocks catching up after the three-day absence and energy-sector resilience. GBP/USD holds above 1.3510 as UK markets return. Meanwhile, the DAX and CAC are retreating — a classic “sell the news” reaction to Monday’s outsized gains, with the pan-European Stoxx 600 edging 0.18% lower at the open.
The ECB’s June 11 meeting is the next big macro landmark. Markets are currently split between a 25bps cut to 1.75% (if energy deflation from Hormuz reopening proceeds) or a hold at 2.00% if oil stays elevated and inflation remains sticky. Today’s GfK German Consumer Confidence and French consumer data will shape expectations. Position sizes should respect the Iran headline risk — the US military is striking even while Trump calls the talks “progressing well,” so volatility remains a constant companion.
European Session — 26 May 2026 · 09:30 CET
Source: Investing.com / TradingView / Capital Street FX Research · Prices as of session open
Six Stories That Define the European Session
Colour-coded by market impact · RED = immediate mover · AMBER = watch · GREEN = positive catalyst
EUR/USD & GBP/USD — European Session Trade Setups
Entry · Stop Loss · Take Profit · Technical Analysis · Fundamental Context
Technical Analysis
EUR/USD has been in a corrective pullback from the 1.1840 multi-year high reached in early May. The pair found support at 1.1580 on May 22 (38.2% Fibonacci retracement of the full 2025 rally from 1.0440 to 1.1840). The rebound since then has been tepid — today’s price of 1.1644 sits below both the 20-day EMA (1.1685) and the descending 4H trendline. RSI on the daily chart is at 46 — below the neutral line and drifting lower. The MACD on the 4H is in negative territory with no crossover signal. The path of least resistance is lower, targeting the 50-day SMA at 1.1550, which coincides with the May 15 low. A break above 1.1720 (weekly resistance zone) would negate the short setup and reopen the 1.1840 target.
Fundamental Context
The euro faces a peculiar double headwind today. The ceasefire extension, announced yesterday, was initially EUR-positive (risk-on, oil deflation = less European energy burden). But today’s US military strikes immediately reintroduced supply-risk uncertainty, supporting the US dollar’s safe-haven bid. Simultaneously, the EU Commission’s GDP downgrade to 0.9% for 2026 — citing the Iran war energy shock — weakens the fundamental growth differential that had supported the EUR’s rally. The ECB’s June 11 meeting is now a genuine coin-flip between a cut to 1.75% and a hold at 2.00%, creating policy ambiguity that typically pressures the currency. On the positive side: Pakistan and Qatar mediators indicate the final Hormuz deal is “days away,” which could quickly reverse EUR/USD lower toward 1.1700+ on a confirmed peace deal. Manage leverage tightly given geopolitical binary risk.
Technical Analysis
GBP/USD is holding above the key 1.3490 support level — the 20-day EMA — after three days of relatively thin holiday trading. The structure remains constructive: the pair has maintained higher highs and higher lows since the March 2026 low at 1.2790. The 4H chart shows a bullish flag consolidation pattern between 1.3480 and 1.3550 — a textbook continuation structure. A clean break above 1.3555 would trigger an acceleration toward the 1.3634 May high and ultimately the 1.3760 resistance cluster (52-week high zone). RSI on the daily is at 52 — neutral with room to extend. The bear case requires a daily close below 1.3440.
Fundamental Context
Cable is being supported today by the FTSE 100’s post-holiday reopening dynamic — dollar selling against the pound as UK asset managers rebalance after the bank holiday absence. The BoE remains on hold at 3.75% with UK CPI at 3.3% — the highest rate in the G7 after the Iran war energy shock pushed UK energy costs sharply higher. This rate differential with the ECB (3.75% vs 2.00%) continues to favour GBP over EUR. UK borrowing fell by nearly £20 billion to £132 billion for the financial year ending March 2026, a fiscal positive. The main risk to GBP today is any escalation in US-Iran military activity that triggers broad risk-off — in that scenario, GBP would sell off against the dollar regardless of fundamentals. Access GBP/USD with tight spreads via Capital Street FX.
FTSE 100 · DAX 40 · CAC 40 — Session Trade Ideas
FTSE catching up · DAX selling off · CAC consolidating · All driven by Iran ceasefire volatility
Technical Analysis
The FTSE 100 is gapping up today as London reopens after the Spring Bank Holiday. The index had closed at approximately 10,466 on Friday May 23, missing Monday’s European rally driven by the Iran ceasefire extension news. Today’s open at 10,524 represents both the catch-up buying and the Brent Crude rebound from today’s US strikes in Iran. Technically, 10,490 is the key intraday support level — the midpoint of the current consolidation range. Above 10,550, the next technical target is 10,680 (the May 12 reaction high). The 50-day SMA is rising and sits at approximately 10,310 — a significant distance below current levels, confirming the medium-term uptrend is intact. RSI at 59 — bullish but not overbought.
Fundamental Context
The FTSE 100’s sector composition makes it uniquely well-positioned on a day when Brent Crude bounces and mining stocks play catch-up. Shell and BP together represent approximately 18% of the index — a direct beneficiary of oil’s recovery above $99.12 after last week’s peace-deal-driven selloff. Rio Tinto, Glencore, and Anglo American (combined ~12%) are recovering from a relatively quiet Monday. HSBC — the index’s largest constituent at roughly 8% — is sensitive to any improvement in Asia risk appetite from the ceasefire news. The tailwind from elevated interest rates (BoE at 3.75%) continues to support UK bank earnings. The main near-term headwind: a strong GBP is a mild drag on FTSE 100 multinational earnings translated back into sterling. Access FTSE 100 CFDs at Capital Street FX.
Technical Analysis
The DAX 40 surged 2.01% on Monday (May 25) as the ceasefire extension news lifted risk appetite across continental European markets. Today’s modest pullback of −0.87% to 25,214 is the classic “sell-the-news” correction after an outsized one-day move. From a pure technical standpoint, the DAX is approaching the upper boundary of its recent 24,800–25,450 range. RSI on the daily chart has moved into overbought territory above 70 following Monday’s surge — a warning signal for short-term traders. The 25,050 level is the first meaningful support, coinciding with the May 21 reaction low and the lower bound of the near-term range. A sustained break above 25,450 would target the all-time high zone near 25,800. The short setup works while price fails to break and hold above 25,400.
Fundamental Context
Germany continues to face the sharpest stagflation dilemma in Western Europe. The Economics Ministry has cut the 2026 GDP growth forecast to just 0.5% — the worst among major EU economies. The combination of elevated energy costs (Brent at $99.12 remains far above pre-war February levels of ~$70), the Iran-war disruption to Mittelstand export supply chains, and Trump tariff exposure on German auto exports creates a structurally difficult backdrop for German equities. Today’s US military strikes in Iran — occurring despite ceasefire negotiations — add fresh uncertainty. Rheinmetall (defense) had rallied sharply on ceasefire optimism; today’s strikes may see partial defense-sector reversal. Volkswagen, BMW, and Mercedes continue to trade under EV transition cost pressure. ECB ambiguity around June 11 limits the “rate catalyst” upside for German stocks.
Technical Analysis
The CAC 40 rose 1.76% on Monday before today’s profit-taking dragged the index to 8,262 (−0.44%). The 8,220 level is now the critical near-term support — it represents the 20-day EMA and the neckline of the breakout from late April’s consolidation. A hold above 8,220 keeps the medium-term bullish structure intact, with a fresh push toward 8,380–8,400 (the May 2026 high and resistance zone) as the next target. RSI at 62 is constructive — pulled back from Monday’s near-overbought reading of 71. The bear case requires a daily close below 8,140 (the 50-day SMA), which would trigger stops and open a retest of the 8,000 psychological level.
Fundamental Context
The CAC 40 has more defensive diversification than the DAX, with luxury (LVMH, Hermès, Kering ~20%), pharma (Sanofi ~5%), energy (TotalEnergies ~7%), and infrastructure (Vinci ~4%) providing sector cushioning. The luxury sector was a big winner on ceasefire optimism — any ceasefire deal improving China consumer sentiment is a direct positive for LVMH and Hermès. TotalEnergies benefits directly from Brent’s rebound to $99.12. The risk factor today: Kering has faced revenue pressure from the China slowdown, and any fresh geopolitical headlines that worsen global risk appetite hit luxury hard. French consumer confidence data (released today) will provide the domestic demand picture. Politically, the French government remains stable following last year’s electoral reshuffle, removing a key tail risk that had plagued the CAC in 2025. Trade CAC 40 CFDs at Capital Street FX.
Brent Crude Oil — The Iran War Premium Returns
US military strikes today re-ignite supply disruption risk despite 60-day ceasefire extension framework
Technical Analysis
Brent Crude has been in a sharp corrective phase, falling from near $110 in mid-May to a low around $93–94 last week as peace deal optimism deflated the Iran war premium. The bounce today to $99.12 (+1.92%) comes after US military strikes in southern Iran reignited supply-disruption fears. From a technical standpoint, $95.30 is the key support level — the 23.6% Fibonacci retracement of the February-May rally from $68 to $110. A confirmed hold above $97.00 on the daily close would suggest the correction is over and open a retest of the $100 psychological level and $103 resistance. The 14-day RSI is at 38 — approaching oversold territory on the recent correction, providing a technical justification for the bounce. The short-term momentum indicator (MACD) is still in bearish territory but beginning to flatten, a precursor to a potential crossover.
Fundamental Context
The binary trade in Brent Crude has never been starker: today you have simultaneously a 60-day ceasefire extension framework (bearish — Hormuz de-mining means more supply) and fresh US military strikes in Iran (bullish — supply disruption risk). The market is caught between two live forces. The TradingEconomics consensus price for today is $98.11 — Brent has recovered from a thin-liquidity Monday selloff to $94.46 open. Saudi Aramco has previously warned that global oil markets will not normalise until 2027 if Hormuz stays blocked beyond mid-June. The 60-day ceasefire extension reduces this risk, but today’s military strikes suggest the “ceasefire” is not a ceasefire in the traditional sense. Global oil inventories are at 101 days of demand per Goldman Sachs — not at crisis levels, providing some downside buffer. Use wide stops (minimum $1.80/bbl) given extreme headline volatility. Access Brent CFDs at Capital Street FX.
Key Data Releases — Tuesday, 26 May 2026
All times CET · Impact colour-coded · Actual vs Forecast vs Previous
| Time (CET) | Country | Event | Impact | Forecast | Previous | Actual |
|---|---|---|---|---|---|---|
| 08:00 | 🇩🇪 Germany | GfK Consumer Climate (Jun) | HIGH | −27.4 | −29.3 | −26.9 |
| 08:45 | 🇫🇷 France | Consumer Confidence (May) | MEDIUM | 89 | 87 | 91 |
| 10:00 | 🇪🇺 Eurozone | M3 Money Supply YoY (Apr) | LOW | 4.2% | 4.0% | Pending |
| 11:00 | 🇪🇺 Eurozone | ECB Wage Growth Q1 (Negotiated) | HIGH | 3.8% | 4.1% | Pending |
| 13:00 | 🇩🇪 Germany | ECB’s Schnabel Speech (Inflation) | HIGH | — | — | Pending |
| 16:00 | 🇺🇸 United States | Conference Board Consumer Confidence (May) | MEDIUM | 98.5 | 97.2 | Pending |
| 16:00 | 🇺🇸 United States | Richmond Fed Manufacturing Index (May) | LOW | −4 | −7 | Pending |
| All Day | 🌍 Global | US-Iran Peace Talks: Hormuz Framework Finalisation | HIGH | — | — | Live / Watch headlines |
The ECB explicitly monitors negotiated wage growth as a key inflation indicator before adjusting rates. A reading above 3.8% today at 11:00 CET (previous: 4.1%) would reduce June 11 cut expectations and support the EUR. A significant downside miss (below 3.5%) would increase the probability of a June cut to 1.75% and could weigh on EUR/USD below the 1.1580 support.
Trader Questions — European Session, 26 May 2026
The Iran-US War — Where We Are on 26 May 2026
The US-Iran war began on 28 February 2026 when the US and Israel launched coordinated strikes on Iranian nuclear facilities. The immediate market consequences were seismic: Brent Crude surged from $68 to over $110 (+62%), the Strait of Hormuz was closed to commercial shipping, and European energy costs spiked. European indices fell 15–20% at the March 2026 lows before recovering on ceasefire hopes.
A two-week ceasefire was announced on 7–8 April 2026, brokered by Pakistan. The Strait was partially reopened, and Brent fell sharply. But the ceasefire was repeatedly described as “on life support” — the US and Iran continued trading fire in the Strait, and Trump said the truce was “unbelievably weak.” Between April and late May, Brent traded between $88 and $110 depending on the day’s headlines.
On 25 May 2026, a senior US administration official confirmed a 60-day ceasefire extension framework — the most significant diplomatic development since April. The framework includes a phased de-mining and reopening of the Strait of Hormuz and lays the groundwork for a “final deal.” Pakistan and Qatar are acting as mediators. Iranian officials confirmed that Ayatollah Khamenei has “in principle” agreed to limits on uranium enrichment. However, as of today (26 May), US Central Command has simultaneously announced self-defence strikes on Iranian missile launch sites — demonstrating that the “ceasefire” is a diplomatic concept rather than a military reality on the ground. Iran has not publicly condemned today’s strikes, possibly to preserve the negotiating framework.
The financial market implication: Brent Crude will remain volatile between $90 and $105 until a formal Hormuz reopening with verified physical ship transit occurs. Until that moment, the war premium is not fully priced out. European equities will oscillate around the ceasefire-escalation news cycle. EUR/USD remains in a structurally supportive environment medium-term (rate differentials, European recovery story) but faces tactical selling pressure on risk-off days.
Session Summary & Positioning Outlook
The dominant theme of today’s European session is the paradox of simultaneous ceasefire and conflict. The 60-day ceasefire extension framework — a genuine diplomatic breakthrough — was overshadowed by US military strikes in southern Iran this morning. Markets are rationally confused: risk-on (ceasefire deal) and risk-off (military strikes) signals are arriving simultaneously.
The FTSE 100 is the session’s clear outperformer at +0.55%, catching up after Monday’s bank holiday closure while benefiting from Brent’s rebound and mining-sector strength. DAX and CAC are selling off modestly from Monday’s outsized gains — a healthy and expected consolidation rather than a trend reversal. EUR/USD at 1.1644 faces dual headwinds: a firm USD on safe-haven demand from Iran strikes, and ECB policy ambiguity ahead of June 11. GBP/USD at 1.3483 is under modest pressure among the two major pairs, supported by post-holiday positioning and the UK’s elevated BoE rate.
Brent Crude at $99.12 is the key instrument to watch for the remainder of the session. If US strikes are described by Iran as a ceasefire violation and talks break down, expect Brent to spike toward $102–105 and European indices to sell off sharply. If Iran absorbs the strikes diplomatically (as appears to be happening this morning), Brent holds below $100 and equities stabilise. This is the binary that governs every other asset class today.
Trade carefully. Use leverage conservatively given geopolitical binary risk. All trade ideas in this brief carry a higher-than-normal scenario tail risk.
Open a Live Account