Iran Ceasefire Fractures, ECB Hike Locked In & Sterling Bleeds | Technical Analysis European Session | 27 May 2026
Iran Ceasefire Fractures,
ECB Hike Locked In & Sterling Bleeds
Brent $96.35 · Gold $4,480.90 · WTI $93.12 · BTC $76,200
Full Trade Ideas · Technical Charts · Economic Calendar · ECB June Decision · FAQ
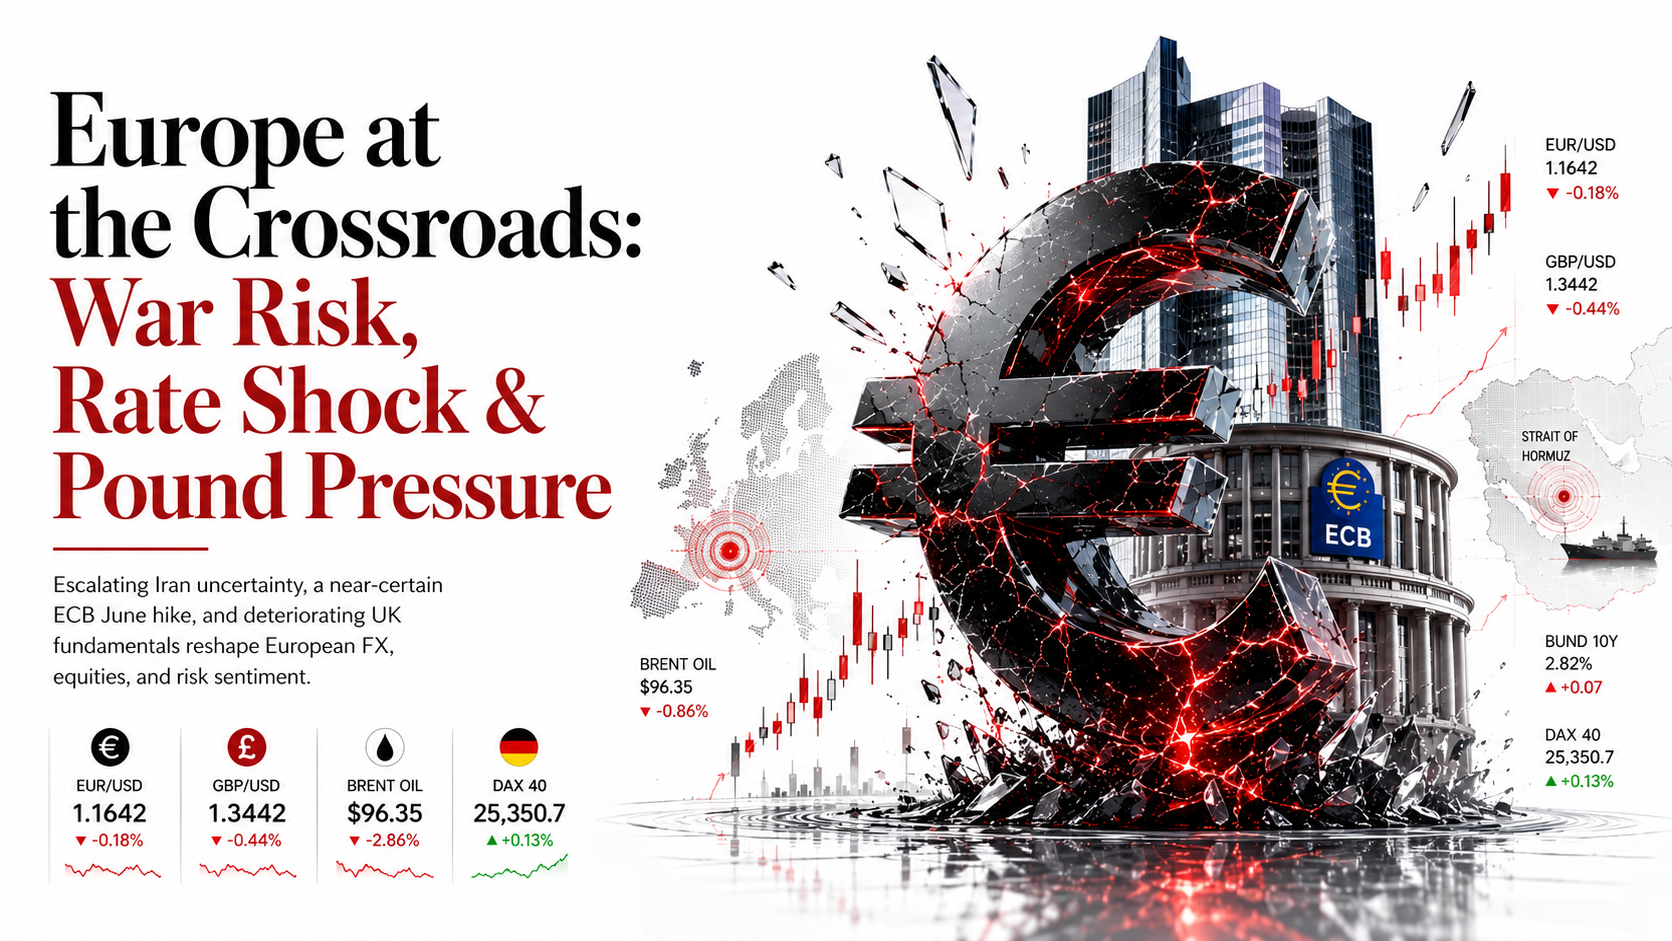
Three forces are colliding in the European session today: a US Dollar safe-haven surge driven by fresh American military strikes in southern Iran, a fully locked-in ECB June rate hike that should support EUR but is overwhelmed by energy-shock stagflation fears, and a sterling structural deterioration after catastrophic UK retail sales, weak PMI data, and Labour’s regional election losses have stripped GBP of all its earlier-month gains.
Overnight, the US military carried out what Central Command described as “self-defense” strikes in southern Iran, targeting missile launch sites and vessels allegedly attempting to deploy naval mines in the Strait of Hormuz. Iran’s Revolutionary Guard claimed it fired on an F-35 and several drones that entered Iranian airspace — a dramatic escalation that wiped out optimism from Monday’s session when Trump had described a peace deal as “largely negotiated.” Brent crude initially spiked $3 before pulling back to $96.35, as traders weigh a possible two-month ceasefire extension framework against the risk of full-scale resumption of hostilities. Secretary of State Rubio says talks continue but key issues remain unresolved: Tehran’s frozen assets and Iran’s reluctance to guarantee unrestricted Hormuz passage.
For EUR/USD, the signal from Frankfurt could not be clearer. Yesterday, ECB Executive Board member Isabel Schnabel told Reuters a June rate hike “will be needed” even if the Iran war ends quickly, citing the “size and persistence” of the energy shock. Chief Economist Philip Lane echoed this, warning inflation pressures beyond energy were rising and could create “a broader inflation problem.” Schnabel predicted Eurozone inflation will rise further toward 4% by year-end. Markets now price a 76.5% probability of a June 11 hike to 2.25%, with 60bps of total tightening (two hikes) priced by year-end. This is EUR-supportive in the medium term — but today the USD safe-haven bid is in the driver’s seat.
In London, GBP/USD is trading at 1.3442 against a backdrop of structural domestic weakness. April retail sales fell 1.3% — nearly double the 0.6% forecast. May PMI showed the first private sector contraction in a year. The UK budget deficit hit £24.3bn in April, the highest since 2020. Labour’s regional election defeats add political uncertainty. Vanguard has revised its BoE forecast: no cuts in 2026, rates held at 3.75% indefinitely as the energy shock complicates the policy trade-off. GBP/USD has fallen from the 1.3634 52-week high to 1.3442 — a move of 192 pips — and lacks a domestic catalyst to recover.
Six Stories That Define the European Session
Colour-coded by market impact · RED = immediate mover · AMBER = watch · GREEN = positive catalyst
EUR/USD & GBP/USD — European Session Trade Setups
Entry · Stop Loss · Take Profit · Technical Analysis · Fundamental Context — Live Data as of 27 May 2026
Technical Analysis
EUR/USD has broken below the 1.1640 support and is now trading at its weakest level in six weeks. The pair failed comprehensively at the January 2026 high of 1.2019 and has since traced a clean sequence of lower highs. Current price at 1.1642 sits in the lower third of the 2026 annual range (1.1435–1.2019). The 50-day moving average at ~1.1620 may offer temporary support but momentum is bearish. RSI on the daily is at 42 — below neutral with room to extend lower. The 5-day moving average has crossed below the 20-day, providing a bearish short-term signal. A sustained break below the 50-day SMA exposes 1.1560–1.1500.
Fundamental Context
The EUR is caught between two powerful opposing forces. Schnabel and Lane delivered the clearest ECB pre-hike guidance in years yesterday — Schnabel explicitly stated June hike “will be needed”; Lane warned of a “broader inflation problem.” This is fundamentally EUR-supportive. However, the competing force is the USD safe-haven bid: reinforced by overnight Iran strikes and fears the ceasefire framework is collapsing. When USD safe-haven flows dominate, they override ECB hawkishness. Today’s strategy: sell rallies toward 1.1680 (prior support, now resistance) with a stop above 1.1740. Target 1.1560. Any confirmed Iran ceasefire extension or diplomatic progress would change the bias to neutral immediately. The June 11 ECB decision remains the medium-term bull case for EUR — get long EUR/USD in anticipation of that event rather than today.

Technical Analysis
GBP/USD is in a confirmed downtrend from the 1.3634 52-week high. The broader downward resistance trend line caps the pair near 1.3612. The 20-day EMA at 1.3472 has been recently tested and rejected — a sign that rally attempts are failing at moving average resistance. RSI is at approximately 50 but is rolling lower. The May 22 low at 1.3413 is the next key support; a daily close below it exposes 1.3375 (May 20 low), then 1.3327 (post-Iran war trough). The structure is bearish: lower highs and lower lows since the 1.3634 peak.
Fundamental Context
Sterling’s domestic fundamental story has deteriorated sharply since mid-May. April retail sales fell 1.3% — almost double the forecast decline — as rising fuel prices squeezed consumers. May PMI signalled the first private-sector contraction in a year. The April budget deficit was £24.3bn, the highest since 2020. Labour lost regional elections. The BoE is on hold at 3.75% with no credible hike signal; Vanguard has removed all 2026 rate cut forecasts entirely. GBP has no near-term catalyst to recover. Selling rallies is the appropriate strategy, with Iran war USD safe-haven flows providing additional tailwind. The June 18 BoE meeting is the next potential GBP catalyst — any hawkish signal there would change the bias.

FTSE 100 · DAX 40 · CAC 40 — Trade Ideas
Live data as of 27 May 2026 · All three major European benchmarks showing divergent reaction to Iran escalation
Technical Analysis
The FTSE 100 opened at 10,507.3 today following the UK bank holiday Monday, recovering from Friday’s close of 10,466. The push above 10,500 tests near-term resistance. MACD is rolling over on the daily timeframe. The 50-day SMA at approximately 10,350 remains key support to watch. Well above the 200-day SMA at ~9,665, the long-term structure is still bullish, but the near-term momentum is at risk of a reversal from current levels. A confirmed close below 10,460 opens the way toward 10,280.
Fundamental Context
The FTSE 100 faces unique pressure today among European indices. BP and Shell (~18% of the index) actually face headwinds as Brent falls below $100 — their margins are more sensitive to the price level than the direction. HSBC — London’s heaviest-weighted financial stock — has significant Asia and China exposure which weakens on risk-off flows. The FTSE missed yesterday’s broader Stoxx 600 rally (which rose 2.01% for DAX and 1.76% for CAC on the auto data positive) due to the UK bank holiday — so today’s opening gap lower reflects two days of unprocessed news. The UK domestic macro picture (retail sales collapse, PMI contraction, fiscal deterioration) further weighs on domestically-oriented mid-cap names. Sell rallies to 10,560 with a stop at 10,650.

Technical Analysis
The DAX 40 has recovered impressively from its Iran war shock lows (near 18,900 in early March) and is now trading near the year’s highs at 25,350.7. The April 30 reading — which showed a 7.98% single-session gain — reflected the market’s extreme sensitivity to geopolitical de-escalation. Current levels are above key support at 23,500 and the 50-day moving average. The index has room to push toward 25,700–25,800 if auto sector momentum continues and ECB hike fears remain contained. RSI momentum is not yet overbought. The risk is the June 11 ECB hike — rate-sensitive valuations may re-price lower post-decision. Buy dips to 25,100 on any Iran-driven pullback.
Fundamental Context
The DAX gets a direct positive from yesterday’s EU car registration data (+5.1% YoY): Volkswagen, BMW and Mercedes-Benz are core index components that surged 2–2.5% yesterday. This offsets some stagflation pressure from Germany’s deteriorating macro outlook (Eurozone growth cut to 0.9% for 2026; German industrial output still recovering). The ECB’s confirmed hawkish pivot for June is double-edged: it validates economic normalisation but will raise borrowing costs for German corporates. Medium-term, the DAX is a buy on any confirmed Iran ceasefire extension — the travel, leisure and auto sectors have demonstrated they can rally 4–7% in a single session on de-escalation headlines. Use leverage carefully on this index given binary Iran risk.

Technical & Fundamental
The CAC 40 fell 1.09% in the prior session (closing 8,242.2) but is opening with gains of +0.34% this morning on Stoxx 600 optimism and EU auto data tailwinds. The 52-week range of 7,505–8,642 gives important context: at 8,242.2, the CAC sits in the upper half of its annual range, reflecting underlying market confidence. Key support is at 8,060 (near the 50-day SMA) while the 52-week high of 8,642 remains achievable only on a comprehensive Iran resolution. The CAC benefits specifically from LVMH, Hermès and Kering — these luxury names are sensitive to China consumer sentiment, and any improvement there is directly CAC-positive. French markets also benefit from Renault’s +4.4% surge yesterday on EU auto data and from ECB rate hike expectations that lift French bank valuations (BNP Paribas, Société Générale). Buy dips to 8,160 for a target of 8,450.

Brent Crude Oil — Below $100 but Ceasefire Still Fragile
Technical Analysis
Brent crude has broken below the psychologically critical $100/barrel level for the first time since early April — a technically meaningful development. The daily RSI is declining from overbought territory at approximately 45, confirming momentum is shifting bearish. The 50-day moving average at approximately $103 now represents overhead resistance. The initial support zone at $96–98 aligns with the late-April consolidation range. Below that, $90–92 is the major medium-term target if the Iran peace framework is extended for two months. Any attempted bounce toward $98–100 should be sold. The overnight US strikes initially spiked Brent $3 before the market faded — showing the market increasingly discounts individual strike events as noise rather than strategic escalation.
Fundamental Context
The Iran-war premium in Brent is approximately $30–35/barrel above pre-conflict prices. The US and Iran are negotiating a framework to extend the ceasefire by approximately two months, during which Washington would ease its naval blockade while Tehran would reopen the Strait of Hormuz. Key unresolved issues: Tehran’s frozen assets and Iran’s reluctance to guarantee unrestricted Hormuz passage. Secretary Rubio says any deal could take “several more days.” Saudi Arabia, Qatar and UAE are actively pressing Trump toward diplomacy. Goldman Sachs notes inventories at 101 days of demand — not crisis levels. Any confirmed 2-month extension would deliver a $5–8 immediate drop in Brent. The EIA crude inventory data at 15:30 BST tonight is a near-term directional catalyst. Use wide stops given binary headline risk throughout the session.

Today’s Key Events — Wednesday, 27 May 2026
All times in BST (UK) and CET (Continental Europe) · Impact colour-coded · Live data sourced 27 May 2026
| Time BST / CET | Country | Event | Forecast | Previous | Actual | Impact |
|---|---|---|---|---|---|---|
| Overnight | 🇮🇷🇺🇸 Iran/US | US “Self-Defense” Strikes — Hormuz Tension Escalates | Ceasefire extension framework | Trump: deal “largely negotiated” | 🔴 STRIKES CONFIRMED | CRITICAL |
| 07:00 / 08:00 | 🇩🇪 Germany | GfK Consumer Confidence June | −20.0 | −22.1 | Pending | MEDIUM |
| 09:00 / 10:00 | 🇪🇺 Eurozone | M3 Money Supply April YoY | 4.8% | 4.6% | Pending | MEDIUM |
| 09:00 / 10:00 | 🇪🇺 Eurozone | Private Sector Loans April YoY | 2.2% | 2.0% | Pending | LOW |
| All day | 🇪🇺 ECB | ECB Speakers — Post Schnabel/Lane Follow-Up | Hawkish confirmation expected | Schnabel: “June hike needed” | 🔴 WATCH | HIGH |
| 13:30 / 14:30 | 🇺🇸 US | Durable Goods Orders April MoM | −0.8% | +9.2% | Pending | HIGH |
| 13:30 / 14:30 | 🇺🇸 US | Durable Goods ex-Transport April | +0.3% | +0.5% | Pending | MEDIUM |
| 15:00 / 16:00 | 🇺🇸 US | Pending Home Sales April MoM | 0.0% | −6.3% | Pending | MEDIUM |
| 15:30 / 16:30 | 🇺🇸 US | EIA Crude Oil Inventories (Weekly) | −1.2M bbl | −2.3M bbl | Tonight | HIGH (Oil & Energy) |
| 19:00 / 20:00 | 🇺🇸 US | Federal Reserve Beige Book (Regional Economic Conditions) | — | Slight-to-moderate growth | This evening | MEDIUM |
Calendar key: Yellow rows = still pending European data. Blue rows = US events with direct European market impact. The two highest-impact events for today’s European session are (1) any Iran diplomatic headline from Doha/Tehran at any point and (2) US Durable Goods at 13:30 BST. Brent crude reacts instantly to any Hormuz update. Keep stop-losses wide on all commodity and energy-sector positions throughout the session.
European Session — Full Price Reference · 27 May 2026
Five Questions Every Trader Is Asking Today
Conclusion: Three Distinct Narratives, One Macro Backdrop
Today’s European session is defined by controlled risk-off. Overnight US military strikes in southern Iran disrupted Monday’s optimism about an imminent ceasefire deal, but markets have not broken into full panic — Brent is below $100, the Stoxx 600 is broadly steady, and Asian markets actually rose overnight (Japan’s Nikkei hit a fresh record high). This is a market repricing probability, not capitulating.
For EUR/USD, the ECB signal from Schnabel and Lane yesterday is the most important development since Lagarde’s April 30 press conference. Two of the ECB’s most influential voices have explicitly called for a June hike, and Schnabel went further by warning inflation will rise “further toward 4%.” This is EUR-positive over the medium term, but today the USD safe-haven bid dominates. Sell EUR/USD rallies toward 1.1680 while Iran uncertainty persists; the June 11 ECB meeting is the event to position long EUR/USD again.
GBP/USD is the most structurally bearish major pair in Europe today. The combination of catastrophic domestic data (retail sales, PMI, deficit), a politically weakened Labour government, and a BoE in “wait and see” mode creates a triple-negative overlay on sterling. Sell rallies to 1.3500. For European indices: DAX and CAC are nuanced buys on dips driven by auto recovery and ECB rate expectations supporting bank valuations; the FTSE 100 is the laggard given its sector mix, UK bank holiday gap-down, and domestic UK weakness. For Brent crude at $96.35, the directional call hinges entirely on today’s Doha diplomatic outcome — use wide stops and avoid over-leveraging on this most headline-sensitive instrument of the session.
Trade across all these asset classes — forex, indices, commodities, stocks and crypto — under one account, with leverage up to 1:10,000 and bonus programmes available to all qualifying accounts.
Start Trading Today →