Iran Strikes & Hang Seng Slide | Technical Analysis | Capital Street FX Asian Session Brief · 29 May 2026
RBNZ Hawkish Hold,
Iran Strikes & Hang Seng Slide
Ethereum $2,006.12 · Cardano $0.2352 · USD/JPY 159.30
Full Trade Ideas · Technical Charts · Economic Calendar · Asian Session · FAQ
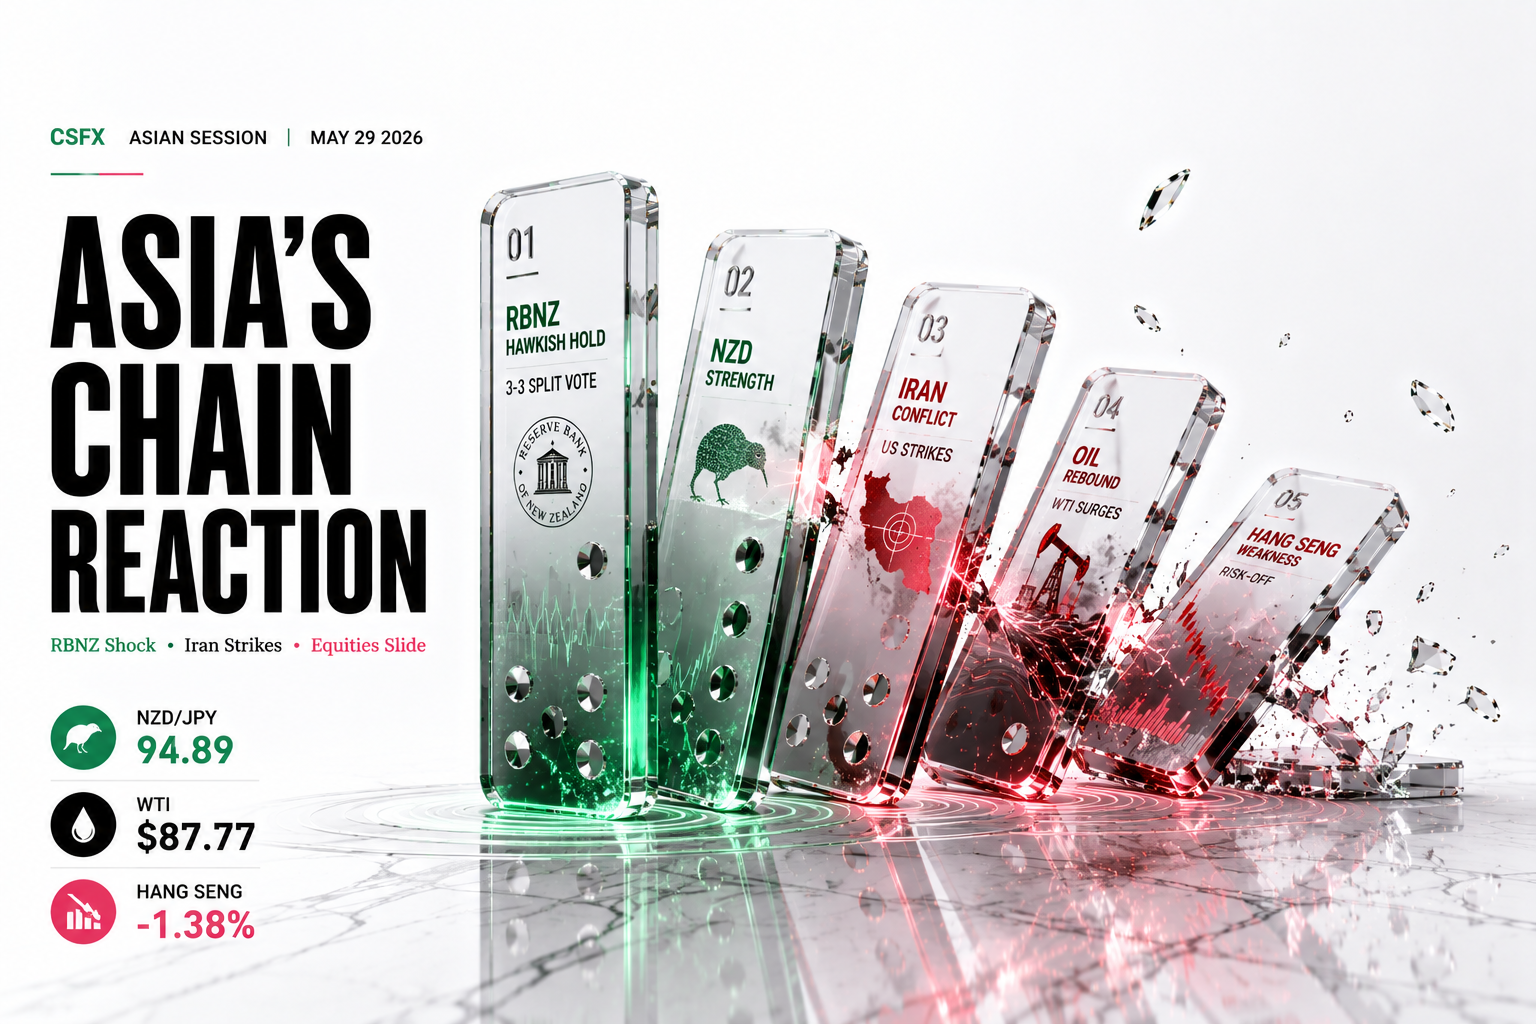
Three themes are driving volatility across the Asian session: the RBNZ’s historic 3-3 split vote that kept the OCR at 2.25% while projecting an aggressive hike path toward 3.28%, escalating US-Iran strikes that rebounded oil above $91, and a broad Hang Seng decline of 1.38% as risk appetite sours on geopolitical uncertainty.
The Reserve Bank of New Zealand delivered the session’s centrepiece — a technically dovish hold resolved by Governor Anna Breman’s casting vote in a 3-3 split, paired with a sharply hawkish OCR track now targeting 3.28% by June 2029. NZD surged 0.7% against the USD and is carrying those gains into NZD/JPY and NZD/CAD crosses as markets price in multiple hikes in 2026. The updated projections forecast inflation peaking at 4.3% in Q3 2026, driven heavily by energy costs from the Strait of Hormuz conflict.
In the energy complex, WTI crude is trading at $87.77 after renewed US strikes on Iranian military positions shattered hopes for a near-term peace deal. The overnight Axios report of a preliminary 60-day ceasefire MOU briefly dragged oil toward $86, but fresh hostile action — US forces targeting sites threatening commercial shipping in Hormuz, Iran’s Revolutionary Guard striking a US airbase — has kept the market on edge. Corn futures at 454.79¢/bu remain firm as the Iran war disrupts Middle Eastern fertiliser supply chains, with freight costs elevated across Pacific routes.
Cryptocurrencies are under modest pressure: Ethereum has slid toward $2,006.12 as the month of May closes with $401 million in ETF outflows, while Cardano’s $0.2352 print reflects a 3% 24-hour decline amid declining TVL. Whale accumulation at these levels — ADA whales now controlling 67% of supply — may signal a structural reversal opportunity. The session’s risk-off undertone makes entry discipline critical across all ideas below.
Five Stories That Define the Asian Session
Colour-coded by market impact · RED = immediate mover · AMBER = watch · GREEN = positive catalyst
Key Prices at a Glance — 29 May 2026
Live data as of Asian session close · All prices approximate
Asian Session Forex — Trade Setups
Entry · Stop Loss · Take Profit · Technical Analysis · Fundamental Context
Technical Analysis
NZD/JPY is testing the top of a consolidation range following the RBNZ decision catalyst. The pair has broken above the 94.00 psychological level — now acting as near-term support — and the daily structure favours higher prices as long as this level holds. The H4 RSI sits around 58, signalling room for continuation without overbought conditions. The 94.36 session low is the critical intraday support; a rejection candle from 94.20–94.40 offers the cleanest long entry for the London open handover. The 95.80 target aligns with the April swing high and the 50% retracement of the 2026 pullback.
Fundamental Context
The rate differential play is widening decisively. The RBNZ’s hawkish OCR track now projects the policy rate reaching 3.28% by 2029, while the Bank of Japan remains pinned below 0.75% in ultra-loose territory. Governor Kazuo Ueda opened the two-day IMES Conference in Tokyo, laying groundwork for a future rate hike but signalling loose conditions persist — a bearish backdrop for the JPY. USD/JPY touching 159.30, a nearly four-week high, confirms the yen is under broad pressure as Middle East conflict undercuts Japan’s trade-dependent economy. NZD/JPY benefits from both legs of this divergence trade.

Technical Analysis
NZD/CAD is pushing through the 0.8100 pivot following the RBNZ decision. The pair has formed a series of higher lows since the April trough at 0.7820, and the RBNZ catalyst provides the fundamental anchor for the next leg higher. Key support is at 0.8080 — the 20-period moving average on the H4 chart — and a pullback to this zone offers the optimal risk-reward entry. Resistance clusters at 0.8220 (March swing high) and 0.8290 (52-week high). The daily MACD is crossing bullish, adding conviction to the long case.
Fundamental Context
This is a rate divergence trade. While both the RBNZ and Bank of Canada sit at 2.25%, the divergence lies in the forward guidance: the RBNZ has now signalled aggressive hikes toward a 3.28% terminal rate, while the BoC remains cautious with no equivalent hawkish projection. Canada faces its own headwinds — oil revenues and terms of trade are under pressure from the WTI supply uncertainty created by the Hormuz closure. CAD’s commodity-currency status gives it only partial benefit from elevated oil prices, as the uncertainty premium outweighs the revenue boost for Canadian producers who cannot easily export to Asia-Pacific markets. NZD’s hawkish central bank story is cleaner.

WTI Crude Oil & Corn — Asian Session Setups
Supply disruption, Iran war premium and agri inflation
Technical Analysis
WTI is in a volatile, headline-driven range between $87 and $96, with the ceasefire rumour/reality cycle creating sharp intraday swings. The broader Elliott Wave structure, per TradingView analysts, shows an impulsive wave (A) low formed at $76.73 in March 2026 after the initial Iran war spike to $119.48 highs. The current structure suggests Wave (B) consolidation, with risk of a resumption higher if Hormuz remains blocked. The 52-week volume weighted average sits near $90 and acts as the session’s magnetic pivot. A confirmed ceasefire would target $80 and below rapidly; continued conflict keeps the upside bias toward $95-$100.
Fundamental Context
The supply picture remains unambiguously tight. Middle East production shut-ins exceed 10 million barrels per day, supporting benchmarks in the $90–$106 range with elevated risk premiums. The EIA projected an 8.5 million barrel inventory draw in Q2. The overnight API data showed US crude inventories fell 2.8 million barrels last week. The proposed 60-day MOU with Iran would guarantee unrestricted Hormuz shipping and still requires Trump’s approval — and the president’s threat that Iran must “get moving FAST or there won’t be anything left of them” signals the diplomatic path is fragile at best. Bias: long on dips while geopolitical premium persists.

Technical Analysis
Corn futures have pulled back to 454.79¢ from recent highs, with today’s session range of 451.00–458.50¢ reflecting softness after the prior week’s consolidation at 460–464¢. The July contract has rallied from sub-440¢ lows in April as the Iran war’s impact on global fertiliser trade became apparent. The key technical level to watch is 451.00¢ — the session low and also the lower boundary of the current pullback. A break below 448¢ on a 4H close would signal near-term weakness; a hold and bounce provides the long entry with a target toward 468¢, the resistance level from late April.
Fundamental Context
The Iran war has created a compounding fertiliser supply shock. Iranian and Gulf chemical plants — which produce significant volumes of urea and ammonia — have reduced output, tightening global agri input markets. Brazil farmers are simultaneously facing a diesel cost jump from elevated Middle Eastern crude, squeezing input margins on the world’s largest corn exporter. US planting conditions remain broadly favourable in the Midwest, which tempers the upside, but freight costs on Pacific trade routes are elevated — relevant for Asian importers including China, Japan, and South Korea. Longer-term, analysts at Barchart and Bloomberg have flagged corn as potentially the “next silver” for commodities traders navigating the war-driven supply reconfiguration.

Hang Seng & Alibaba Group — Asian Session Setups
Risk-off conditions, geopolitics, AI pivot and technical structure
Technical Analysis
The Hang Seng is at a technically and geopolitically sensitive juncture. Price is approaching the long-term horizontal support zone of 24,800–25,200, which has historically attracted buyers. However, the monthly decline of 2.38% and YTD performance of −1.44% confirm persistent selling pressure. TradingView analysts have flagged a potential Head and Shoulders pattern on the HSI; a 1H close below the neckline near 25,000 — confirmed with a bearish retest — would signal a continuation lower toward 24,500 and potentially 23,800. The bull case requires a break above 25,800 to suggest a meaningful recovery. Short the bounces until 25,800 recaptures.
Fundamental Context
The Hang Seng’s weakness reflects multiple geopolitical headwinds. Xi Jinping’s overtures to Taiwan’s opposition — described as a decades-long pattern of calibrated diplomatic gestures — are creating uncertainty for HK-listed names with cross-strait exposure. The broader Asia risk-off is compounded by renewed Iran strikes sapping appetite for emerging market and Pacific equities. Samsung affiliates’ 4% stake acquisition in South Korean exchange Dunamu signals some institutional interest in Asian tech names, but the macro backdrop — rising Middle Eastern risk, weakening JPY and AUD — is suppressing broad index upside. Hang Seng futures’ bottoming structure near 24,800–25,200 may attract value buyers, but the entry discipline for shorts offers the cleaner setup in the current environment.

Technical Analysis
BABA is in a confirmed intermediate downtrend, down 13.70% over 90 days and 17.97% YTD, trading well below its 50-day SMA ($155.10) and 200-day SMA ($145.79). The stock is approaching a critical test of the $120–$124 structural demand zone — the last meaningful support before the 52-week low at $103.71. Pre-market weakness of 2.52% to $124.53 suggests this zone may be tested in the coming sessions. The 14-day RSI sits at a neutral 51.00 on daily but price momentum is clearly bearish. A bounce to the $128–$130 resistance band — defined by the broken prior support — offers the cleanest short entry with a tight stop above $133.00. A confirmed daily close below $123.00 would open the path toward $118 and $110.
Fundamental Context
Alibaba faces a complex macro and structural backdrop. The stock drew bullish analyst targets despite a weak Q4 earnings print, with Wall Street consensus pointing to 43% upside and 38 analysts rating it a Strong Buy with a 12-month average target of $191.56. Alibaba has aggressively integrated all business segments into an AI-driven strategy over the past year, positioning for AI application implementation across its cloud, e-commerce, and logistics arms. However, the near-term headwinds are significant: the broader Hang Seng risk-off, the failed Trump-Xi summit that produced no major chip trade deal, and China’s new restrictions on overseas travel for top AI professionals all weigh on sentiment. The 618 Shopping Festival (China’s second-biggest online sales event) beginning in early June represents a potential near-term catalyst — Apple’s iPhone 17 price cuts in China for 618 signal the consumer environment is competitive but active. Until the broader Asia risk-off resolves, BABA remains a short-the-bounce setup.

Ethereum & Cardano — Asian Session Trade Ideas
ETF outflows, whale accumulation and technical structure
Technical Analysis
Ethereum is closing May with significant bearish pressure — down 12.6% for the month, the worst monthly performance since early 2026. Price is hovering near $2,006.12 at the time of the Asian session with the RSI at 31.73 — approaching oversold territory on the daily, but not yet a confirmed reversal signal. The classical pivot point for today sits near $2,100, and failure to hold this level risks a flush toward the $1,920–$1,950 demand zone. Any bounce toward $2,180–$2,240 (100-day EMA resistance) provides the short entry for traders following the bearish monthly trend. Whales and hodlers are reportedly buying the dip into June, which may limit downside below $1,900.
Fundamental Context
The $401 million in ETF outflows recorded during May is the clearest fundamental bearish signal. Institutional money has been rotating out of Ethereum exposure as month-end rebalancing hits. CoinCodex’s prediction model targets $2,237 by June 2, representing a 11.74% bounce from current levels — but this is a model forecast, not a catalyst. The real-world use case narrative remains strong: the tokenised real-world asset market is gaining traction, and Ethereum’s smart contract infrastructure underpins this growth. However, the near-term setup leans bearish given monthly close pressure, ETF outflows, and the broadly risk-off Asian session tone.

Technical Analysis
Cardano is in a confirmed bearish trend on both daily and weekly timeframes: the 50-day moving average is above price and falling, the 200-day moving average has been falling since April 29, 2026, and price is pressing the $0.228 24-hour low. The key level to watch is $0.236 — a break below this on sustained volume risks a flush toward $0.210–$0.215, the next structural demand zone. The RSI is approaching oversold but hasn’t confirmed a reversal. A long entry at the $0.228 session low offers a defined risk setup with a target toward $0.270 (the 50-day SMA and recent resistance cluster). This is a contrarian, accumulation-style trade against the primary trend.
Fundamental Context
The Cardano bear case stems from declining ecosystem TVL — now at $137 million, down sharply from the December 2024 peak of $686 million — even as whale accumulation reaches its highest share since 2020 at 67% of supply. This divergence between institutional/whale accumulation and retail TVL decline is a classic accumulation pattern. Fireblocks has recently integrated RAW signing with Iagon’s Cardano nodes for institutional ADA access, signalling growing institutional infrastructure. Cardano CEO Charles Hoskinson has been vocal on AI agents as the next adoption wave. The long-term governance upgrade narrative and institutional access improvements support the recovery thesis; the short-term weak structure demands a disciplined entry at the $0.228 demand zone.

“The RBNZ’s 3-3 split is the most consequential policy event of the Asian session — not because rates moved, but because the projection path has shifted decisively. NZD trades on what the RBNZ will do, not what it just did.” Capital Street FX Research · Asian Session Brief · 29 May 2026
Asian Session — Key Events 29 May 2026
Times in SGT (UTC+8) · Impact rating by expected market volatility
| Time (SGT) | Country | Event | Impact | Previous | Forecast | Actual |
|---|---|---|---|---|---|---|
| 00:00 | 🇳🇿NZD | RBNZ OCR Decision + MPS | HIGH | 2.25% | Hold | Hold 2.25% (hawkish) |
| 00:30 | 🇳🇿NZD | RBNZ Governor Breman Press Conference | HIGH | — | — | Hawkish — hikes data-dependent |
| 07:30 | 🇦🇺AUD | Australia CPI YoY (April) | HIGH | 3.8% | 4.6% | 4.2% (fuel excise distortion) |
| 09:00 | 🇯🇵JPY | BoJ IMES Conference — Gov. Ueda Opening | HIGH | — | — | Loose conditions persist |
| 10:00 | 🇯🇵JPY | BoJ Parliamentary Testimony — Okuno | MED | — | — | Rate hike groundwork |
| 11:00 | 🇯🇵JPY | Tokyo CPI YoY (May) | MED | — | — | Pending |
| 15:00 | 🇨🇳CNY | China NBS PMI Manufacturing (May) | MED | 49.0 | 49.2 | Pending |
| All Day | 🌐GLOBAL | US-Iran War Developments / Strait of Hormuz | HIGH | — | — | Fresh strikes — deal uncertain |
Key Questions From the Asian Session
Answers from the Capital Street FX Research team
This brief is for informational and educational purposes only. All trade ideas carry significant risk of loss. Past performance does not guarantee future results. Leverage can amplify both gains and losses. Please ensure you understand the risks involved and trade within your risk tolerance. This is not financial advice.
Asian Session Summary — 29 May 2026
The RBNZ’s hawkish hold is the defining event of this Asian session. NZD is the currency to watch across both NZD/JPY and NZD/CAD as the rate divergence trade plays out into the London open. The JPY remains structurally weak — USD/JPY at 159.30 is at four-week highs with the BoJ signalling no urgency to tighten despite Ueda’s IMES groundwork. The Hang Seng’s 1.38% decline reflects a broad Asia risk-off that is unlikely to resolve until the US-Iran situation reaches a genuine inflection point.
In commodities, WTI Crude’s $87.77 rebound after the ceasefire-hope selloff to $89 illustrates just how headline-sensitive this market is. The 60-day MOU proposal is the most concrete peace signal yet — but Trump’s approval is far from certain, and Iran’s insistence on Hormuz control is a structural sticking point. Corn’s tight 458–464¢ range reflects balanced supply-demand fundamentals with a fundamental upside skew from the fertiliser input shock. Trade the dip to 458¢ with discipline.
Crypto closes May under pressure. Ethereum at $2,006.12 is approaching technical support but the monthly close overhang and ETF outflows argue for caution on new longs until June data clarifies institutional flow direction. Cardano at $0.2352 is a longer-horizon accumulation candidate at the $0.228 demand zone; the whale accumulation data and institutional infrastructure developments are medium-term positives in a short-term bearish structure.
Open a Live Account →