Iran Ceasefire Optimism, Pound Resilience & Crypto Pressure | Capital Street FX Daily Brief · 29 May 2026
GBP/USD1.3439▼ −0.59%
EUR/JPY185.55▲ +0.19%
EUR/USD1.1649▲ +0.20%
USD/JPY158.93→ Cautious
FTSE 10010,412▲ +1.26%
Gold XAU$4,537.29▲ +0.32%
WTI Crude$87.29▼ −15.55%
Brent$111.46▲ +2.01%
Aluminum$3,656.61/t▲ +0.45%
Nat Gas$3.013▲ +1.79%
Tether$0.9987▼ −0.01%
XRP$1.29▼ −4.22%
Unilever4,254p→ Flat
EU 10Y3.34%▼ Easing
UK 10Y Gilt4.82%▼ Monthly low
Bitcoin$73,311▼ −2.32%
GBP/USD1.3439▼ −0.59%
EUR/JPY185.55▲ +0.19%
EUR/USD1.1649▲ +0.20%
USD/JPY158.93→ Cautious
FTSE 10010,412▲ +1.26%
Gold XAU$4,537.29▲ +0.32%
WTI Crude$87.29▼ −15.55%
Aluminum$3,656.61/t▲ +0.45%
Nat Gas$3.013▲ +1.79%
Tether$0.9987▼ −0.01%
XRP$1.29▼ −4.22%
Unilever4,254p→ Flat
EU 10Y3.34%▼ Easing
Friday, 29 May 2026 · European Session · Daily Market Brief
Pound Under Pressure & Crypto Sell-Off
GBP/USD 1.3439 · EUR/JPY 185.55 · FTSE 100 10,412 · Aluminum $3,656.61/t · Nat Gas $3.01 USDT $0.9987 · XRP $1.29 · Unilever 4,254p · EU 10Y 3.34% · UK 10Y Gilt 4.82%
Full Trade Ideas · Technical Charts · Economic Calendar · Macro Fundamentals · FAQ
Capital Street FX Research|29 May 2026|European Session Brief|~20 min read
Session Overview
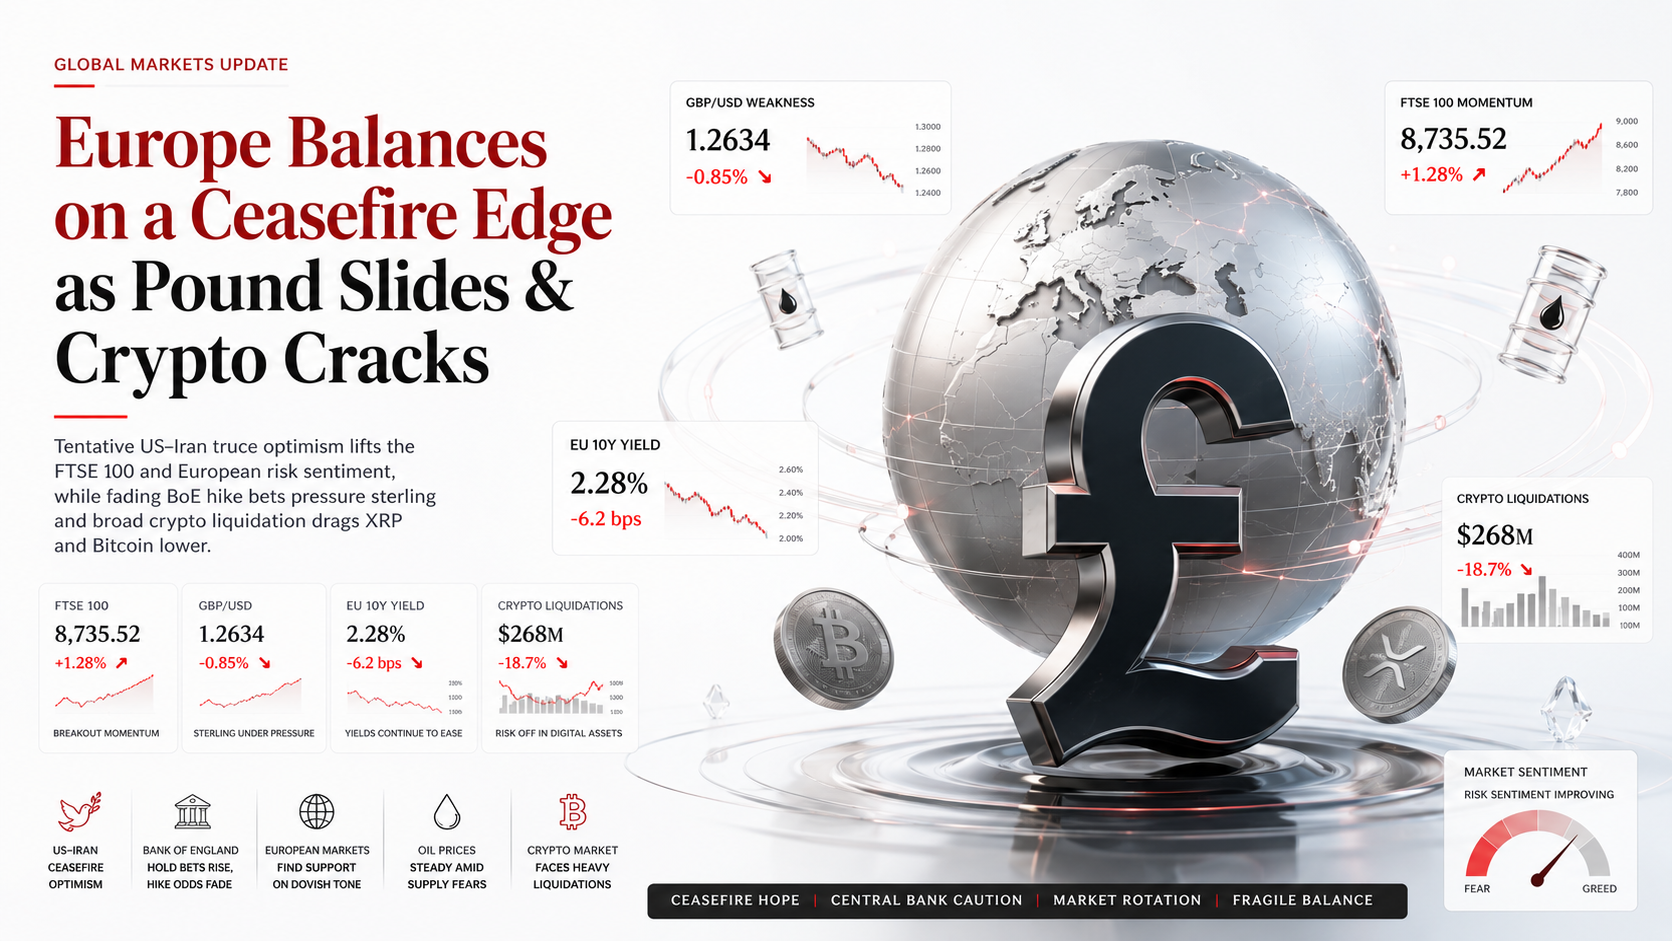
“European equities edge higher Friday as 60-day Iran ceasefire optimism pushes Brent back above $111 and the FTSE 100 surges past 10,400 — yet the pound retreats from multi-week highs as USD safe-haven demand flickers back.”
The dominant macro catalyst this Friday morning is a tentative agreement between US and Iranian negotiators for a 60-day ceasefire extension and talks on Tehran’s nuclear programme. Axios first reported the deal; however President Trump has yet to sign off, keeping markets in a nervous equilibrium. Risk assets are rising, oil is surging, and bond yields are declining — all at once — reflecting the unusual duality of “relief” and “uncertainty” that has characterised the entire Iran war era since February 28.
The Euro Stoxx 50 opened +0.5% and the FTSE 100 is outperforming peers, printing above 10,400 for the first time this week. Sterling is under mild pressure as safe-haven dollar demand persists and traders scale back BoE rate hike bets following a cooling UK labour market and softer CPI prints. The EU 10-year yield has eased to 3.34% from 3.47% last month. Crypto is broadly lower, with XRP down nearly 3% and BTC below $74,000 — a reflection of risk positioning unwinding after last month’s crypto ETF-driven enthusiasm.
GBP/USD
1.3439
▼ −0.59%
EUR/JPY
185.55
▲ +0.10%
FTSE 100
10,412
▲ +1.26%
Aluminum (LME)
$3,656.61
▲ +0.45%
Natural Gas
$3.013
▲ +1.79%
Tether USDT
$0.9987
▼ −0.01%
XRP
$1.29
▼ −4.22%
Unilever (ULVR)
4,254p
→ Flat
EU 10Y Yield
3.34%
▼ −2bp
UK Gilt 10Y
4.82%
▼ 7-wk low
Gold XAU
$4,537.29
▲ +0.32%
WTI Crude
$87.29
▼ −15.55%
Breaking News · 29 May 2026
Top Stories Driving the European Session
High-impact catalysts, macro events, and geopolitical drivers for today’s session
US and Iranian negotiators reached a memorandum of understanding on Thursday for a 60-day ceasefire extension and to begin formal nuclear talks. European equities surged at the open: Euro Stoxx 50 +0.5%, CAC 40 +0.6%, FTSE 100 +1.26%. However, Trump has not yet signed off, keeping sentiment cautiously bullish. Iran has not publicly confirmed the agreement.
FTSE 100 · EUR/JPY · Oil · Risk-On
🔴 High Impact
Sterling Slides as BoE Rate Hike Bets Scaled Back — Labour Market Cooling
GBP/USD trades near 1.3439, defensive in the European session Friday. Recent UK data — softer CPI, rising unemployment, and slower activity — has led traders to cut expectations for a Bank of England rate hike in 2026. UK 10-year gilts are on a seven-session winning streak, yields near a 7-week low of 4.82%.
The broader crypto market is down 5.3% over the past week. XRP trades at $1.29 (−4.22% on the day) with $82B market cap. Bitcoin sits at $73,311 (−2.32%), well below the psychological $80K level. The sell-off reflects broader position unwinding, with the XRP spot ETF ecosystem holding $1B+ in AUM but facing short-term headwinds from macro risk-off.
US Natural Gas futures trade at $3.013/MMBtu (+1.79%), bouncing from recent lows after LNG supply risks re-emerged. The Iran conflict has persistently elevated energy prices globally. Cheniere Energy Partners signed a new contract with Bechtel for Sabine Pass LNG Stage V — a medium-term supply catalyst. The 52-week range spans $2.48–$7.83.
Natural Gas · LNG · Energy · Commodities
🟡 Watch Closely
Aluminum Holds Firm at $3,656.61/t — China Demand Expectations Lift LME Metals
LME Aluminum is trading at $3,656.61/tonne (+0.45%), near session highs. Improving China macro sentiment following ceasefire optimism has lifted base metals broadly. LME warehouse stocks are at 349,100 tonnes. Copper is up 1.52% while Aluminum’s resilience reflects Chinese infrastructure demand expectations and supply constraints from energy costs in Europe.
Aluminum · LME · China · Base Metals
🟢 Positive Catalyst
Unilever Ice Cream Spin-Off Progress — CEO Fernández Signals Q3 Close
Unilever (ULVR) holds at 4,254p with its next earnings expected July 28, 2026. The stock is being closely watched for updates on the ice cream unit spin-off (brands: Magnum, Wall’s, Ben & Jerry’s). Revenue for the last half-year was £21.79B, below the £23.33B estimate, keeping the stock under modest pressure YTD (−11%). CEO Fernando Fernández’s operational restructuring is the key fundamental catalyst for H2 2026.
Unilever · ULVR · FTSE 100 · Consumer Goods
Section 1 · Forex Analysis
GBP/USD & EUR/JPY — Trade Setups for the Session
Entry · Stop Loss · Take Profit · Technical Analysis · Fundamental Context
GBP/USD is trading defensively near 1.3439, pulling back from the 1.3634 52-week high printed earlier this month. The pair has broken the near-term rising trendline from the March lows. On the H4 chart, price is below the 20-period EMA and the MACD is crossing bearish. Key support sits at 1.3380 (50-day EMA) and 1.3310 (confluence with the April swing low). A sustained break below 1.3439 on a 4H close opens the door to 1.3380.
The bear case strengthens if the Dollar Index (DXY) holds above 98.50 into the US close. Resistance at 1.3510–1.3540 is strong: multiple daily pivots coincide here.
Fundamental Context
The key driver is a cooling macro backdrop for the UK. Recent BoE-sensitive data has printed soft: unemployment is ticking higher, CPI has come in below forecast, and economic activity is slowing. The market has scaled back bets on further BoE hikes, which previously underpinned cable above 1.35. The dollar meanwhile is finding episodic safe-haven support as markets await Trump’s approval of the Iran ceasefire MOU. If Trump delays or rejects the deal, USD could spike sharply, accelerating GBP/USD weakness toward 1.33. Conversely, a Trump confirmation would restore risk appetite and could lift cable back toward 1.3560.
GBP/USD — Daily Structure with BoE Repricing (29 May 2026)
▲ Cautiously Bullish — Risk-On Tone, BoJ Uncertainty
2026 High
187.53 (16 Apr)
2026 Low
181.25 (13 Feb)
ECB Rate
2.00% (Jun hike 80% priced)
Entry (Long)
184.80
Buy pullback to 50-day EMA
Stop Loss
183.50
Below Ichimoku cloud base
Take Profit
187.50
2026 high / April resistance
Technical Analysis
EUR/JPY is trading at 185.55, comfortably within its May range of 184.53–185.64. The pair is above the 50-day EMA at 182.40 and the 200-day EMA at 180.15 — the broader trend remains constructive. The RSI sits at approximately 58, in neither overbought nor oversold territory, leaving room for further upside. The pair has held within an ascending channel since the February lows, and a retest of the 2026 high at 187.53 is plausible if ceasefire confirmation materialises. The Ichimoku cloud spans 181.80–183.20, providing a thick support cushion below current price.
Fundamental Context
EUR/JPY remains one of the most sensitive risk-barometer crosses in the G10 FX space. The ECB is pricing approximately an 80% probability of a June rate hike to 2.25%, which underpins the Euro. Meanwhile the Bank of Japan remains cautious on tightening, keeping the yen structurally weak for carry purposes. The ceasefire news is mildly EUR/JPY bullish — a risk-on move tends to weaken the yen as carry trades are reinstated. However, Goldman Sachs analysts have warned that the carry trade advantage may narrow if BoJ signals another step toward policy normalisation. Watch June ECB meeting pricing and BoJ Governor Ueda’s commentary closely for the next EUR/JPY directional catalyst.
EUR/JPY — 2026 Range with ECB–BoJ Rate Differential
Section 2 · European Indices & Equities
FTSE 100 & Unilever PLC — Trade Ideas
Index momentum, equity-specific drivers, and entry/exit levels
The FTSE 100 opened today at 10,395 and has pushed up to 10,412, trading at levels last seen in mid-May. The index is now comfortably above its 50-day SMA (~10,150) and in a recovery from the brief dip to 8,531 printed at the 52-week low. The daily MACD has turned bullish and the RSI is at 58 — room to run before becoming overbought. Resistance clusters at 10,450 (prior session high) and 10,600. Support at 10,200 has proven durable on three tests this month. A confirmed close above 10,380 today would set up a test of 10,520 next week.
Fundamental Context
The FTSE 100 is benefiting from a unique set of tailwinds today. First, oil trading at $87.29 WTI as ceasefire optimism paradoxically spikes energy prices (markets anticipate resumed flows but with lingering supply risk premium), directly benefiting BP and Shell (~18% of the index). Second, the FTSE’s defensive composition — miners, tobacco, consumer staples — is attractive in a risk-uncertain environment. Third, UK gilt yields falling to a 7-week low reduces the discount rate on equities. The risk to the long: if Trump unexpectedly rejects the ceasefire MOU, oil could spike sharply higher and paradoxically hurt the index via inflation fears. Access indices CFDs at Capital Street FX.
FTSE 100 — Daily Structure with Ceasefire Rally (May 2026)
Unilever (ULVR) is holding at 4,254p after trading in a tight range between 4,242p–4,270p today. The stock is down 11% YTD and has lost roughly 17% over the past year — a sustained underperformance vs. the FTSE 100. Technically the stock is in a base-building phase: the RSI is neutral at ~47, and the MACD has shown a possible bullish crossover on the weekly chart. The 52-week low of approximately 3,900p (March 2026) is a key structural support. A break above 4,500p would signal accumulation ahead of the July 28 H1 results. Beta of 0.41 makes ULVR a lower-volatility FTSE play.
Fundamental Context
Unilever’s primary catalyst for 2026 is the spin-off of its Ice Cream division (Magnum, Wall’s, Ben & Jerry’s). CEO Fernando Fernández has guided toward a Q3 2026 completion of the structural separation, which analysts expect will unlock value by allowing the remaining company to trade at a premium FMCG multiple. H1 2026 revenue came in at £21.79B vs. the £23.33B estimate — a miss that has kept the stock under pressure. However, the market cap of £91.7B reflects value investors accumulating at these levels. The dividend yield of 3.97% provides income support. Trian Fund Management’s exit of 579,000 shares in June 2025 removed an activist overhang. The risk: a weaker-than-expected H1 result on July 28 could push ULVR below 4,100p.
Unilever ULVR — Daily Structure with Spin-Off Catalyst Watch
Section 3 · Commodities
Aluminum & Natural Gas — Trade Ideas
LME base metals and energy markets in focus amid Iran ceasefire dynamics
Aluminum (LME)
LME 3M Contract · $/tonne · Code: AH
$3,656.61/t
▲ +0.45% · China demand bid
▲ Bullish Bias — China Infrastructure Demand + Energy Cost Relief
Today’s Range
$3,633 – $3,672
LME Stocks
349,100 tonnes
Lot Size
25 tonnes / lot
Entry (Long)
$3,620
Buy pullback to daily open
Stop Loss
$3,560
Below weekly structure low
Take Profit
$3,780
April monthly resistance
Technical & Fundamental
LME Aluminum is firming at $3,656.61/tonne, reflecting improving risk sentiment linked to the ceasefire and a recovery in Chinese demand expectations. Over 75% of physical aluminum contracts use the ‘LME Basis + Regional Premium’ pricing model, and today’s +0.45% gain reflects the benchmark’s sensitivity to macro risk appetite. Energy costs — a major input into aluminum smelting — have been structurally elevated through the Iran conflict, pressuring European smelter margins. Any durable ceasefire could meaningfully reduce power prices, boosting European smelter profitability and supply. The primary risk to the long is a ceasefire breakdown, which would spike energy costs and threaten demand from auto and construction sectors. Copper’s +1.52% gain today confirms the base metal complex is broadly bid.
LME Aluminum — Price Structure with China Demand & Energy Correlation
Natural Gas
NYMEX Henry Hub Futures · $/MMBtu
$3.013
▲ +1.79% · LNG supply risk re-pricing
→ Neutral / Range-Bound — Volatile Around Iran Headlines
52-Week Range
$2.483 – $7.827
Day’s Range
$2.984 – $3.048
Signal
Strong Buy (Tech)
Entry (Long)
$2.95
Buy dip to weekly support
Stop Loss
$2.78
Below 50-day MA
Take Profit
$3.30
Resistance / Q2 mean reversion
Technical & Fundamental
Natural Gas is bouncing +1.79% today to $3.013 after softening toward the 2.90 region as Asia-Pacific macro signals have been fragile. The asymmetric range this year ($2.48–$7.83) reflects the extreme volatility driven by the Iran war: at the height of the Hormuz closure in March, gas spiked above $7.80. Since then, partial reopening and ceasefire episodes have compressed the price. The Cheniere Energy Partners–Bechtel Sabine Pass LNG Stage V engineering contract (signed this week) signals medium-term US LNG export capacity expansion — a structural bearish factor for Henry Hub prices. Short-term: the range $2.80–$3.20 remains the trading corridor, with breaks driven by ceasefire headline risk. The strong technical buy signal reflects oversold conditions from recent lows.
Natural Gas — Intraday Structure vs. Iran War Timeline
Section 4 · Digital Assets & Fixed Income
Tether (USDT) · XRP · EU 10Y — Trade Ideas
Stablecoin stability, XRP dynamics, and European sovereign bond positioning
Tether (USDT) is trading at $0.9987, showing a minor discount to its $1 peg — a signal of elevated redemption activity during the broader crypto risk-off sell-off. In times of broad crypto market weakness (BTC −2.32%, XRP −2.97%), traders move assets into USDT as a cash equivalent. The current discount of 0.13 cents is within normal operating tolerance (Tether maintains a de-peg threshold at ±0.5%). USDT’s primary function in this environment is a capital preservation vehicle — traders exiting volatile positions park funds here before redeployment. For European session participants, USDT trading volume spikes during periods of sharp crypto draw-down, as European institutional crypto desks manage risk. Monitor the discount: if USDT falls to $0.995 or below, it signals abnormal stress.
Tether USDT — Peg Stability Monitor (Coinbase)
XRP
XRP Ledger · Ripple Payments · Rank #4
$1.29
▼ −4.22% · Weekly: −5.33%
▼ Bearish Short-Term — Range Support at $1.25 Critical
Market Cap
~$80–82B
All-Time High
$3.65
XRP ETF AUM
$1B+ (7 US ETFs)
Entry (Short)
$1.38
Sell bounce to resistance
Stop Loss
$1.48
Above January 2026 range top
Take Profit
$1.18
Range floor / key support
Technical & Fundamental
XRP is trading at $1.29, down 4.22% on the day and 4.12% on the week. The token is currently sitting at the lower bound of a multi-month range structure that has held the bearish pressure for months. The 4H chart shows XRP trading below the Ichimoku cloud, with the RSI approaching oversold at ~38. Bulls are defending the range floor near $1.25–$1.28 zone. The broader context: XRP has gained permanent non-security status following its August 2025 legal victory against the SEC, and 7 US spot XRP ETFs now hold a combined $1B+ in AUM. However, the market is in a quarterly drawdown phase — quarterly realized volatility runs 100–130%. The weekly performance of −4.12% mirrors the global crypto market’s −5.3% weekly decline, suggesting systemic rather than XRP-specific selling. A close above $1.48 would invalidate the short setup and signal accumulation by long-term holders.
XRP — Range Structure with Ceasefire Sentiment Overlay (May 2026)
EU 10Y Bond Yield
Euro Area 10-Year Sovereign Benchmark · Bund Proxy
The EU 10-year yield has fallen 13 basis points over the past month to 3.34%, reflecting a meaningful easing of inflation concerns linked to the Iran war. The bond market has rallied for a seventh consecutive session — the longest winning streak since just before the Iran conflict escalated in late February. The ceasefire optimism is reducing the inflation risk premium embedded in European government bonds: if oil prices sustainably decline, headline inflation falls and ECB hike expectations moderate. The paradox is that the ECB is still expected to hike 25bp to 2.25% in June (80% probability), which should structurally support yields. However, the Iran peace dividend is outweighing ECB hawkishness in near-term bond pricing. A durable ceasefire — with Hormuz reopening fully — could drive the EU 10Y back toward the 3.10% pre-war level, representing meaningful duration alpha. The 10Y yield is currently 27bp higher than a year ago, reflecting the structural inflationary re-pricing of the conflict era.
EU 10Y Bond Yield — Monthly Decline vs. ECB Rate Path (2026)
Economic Calendar · 29 May 2026
Today’s Key Economic Events
All times CET · Impact ratings based on market sensitivity
Time CET
Country
Event
Impact
Forecast
Previous
Actual
08:00
🇩🇪Germany
German Prelim CPI (May YoY)
HIGH
2.4%
2.2%
Pending
09:00
🇪🇺Eurozone
ECB Governing Council Speech
HIGH
—
—
Watch Live
10:00
🇪🇺Eurozone
Eurozone CPI Flash Estimate (May)
HIGH
2.6% YoY
2.4%
Pending
10:30
🇬🇧UK
UK Consumer Confidence (GfK)
MED
−22
−20
Pending
13:30
🇺🇸US
US PCE Price Index (Apr) — Fed’s Preferred Gauge
HIGH
+2.5% YoY
+2.3%
Pending
14:00
🇺🇸US
US Michigan Consumer Sentiment (Final May)
MED
69.1
52.2
Pending
All Day
🌍Global
Iran Ceasefire MOU — Trump Sign-Off Watch
HIGH
Conditional
—
Awaiting
“The ceasefire MOU represents the most important macro catalyst of the quarter — but until Trump signs, every risk asset rally must be treated as provisional.”
Capital Street FX Research · 29 May 2026
Trader FAQ
Frequently Asked Questions for Today’s Session
Quick answers to the questions traders are asking this morning
Why is the FTSE 100 outperforming European peers today?
The FTSE 100’s heavy weighting toward energy companies (BP, Shell ~18% of the index) means it benefits disproportionately when oil prices surge. WTI is −15.55% today and Brent is above $111 as ceasefire optimism keeps an energy risk premium intact. Additionally, the FTSE’s defensive components (tobacco, consumer staples, healthcare) attract safe-haven equity flows when macro uncertainty persists.
Why is GBP/USD falling when European stocks are rising?
This apparent divergence reflects two different drivers. European stocks are rising on ceasefire optimism (risk-on). GBP/USD is falling because the USD is finding episodic safe-haven demand from investors who remain cautious about the ceasefire not being finalised. Additionally, UK-specific factors — softer CPI, higher unemployment, and trimmed BoE rate hike expectations — are independently weighing on sterling regardless of European equity direction.
Is the EU 10-year yield rally (bonds up) contradicting the ECB June hike expectations?
Technically yes — if the ECB hikes in June (80% probability), that should push bond yields higher, not lower. The current bond rally is driven by a ceasefire-related inflation risk premium unwind: markets believe a durable peace deal would structurally lower energy-driven inflation, reducing the ECB’s tightening path beyond June. It’s a forward-looking market signal: the EU 10Y is declining because investors expect fewer ECB hikes in H2 2026 if oil prices fall.
What is driving XRP’s decline despite positive crypto ETF inflows?
XRP’s −4.22% decline reflects the broader crypto market sell-off (global crypto down −5.3% weekly) rather than XRP-specific news. Despite 7 US spot XRP ETFs now holding $1B+ in AUM — demonstrating institutional adoption — short-term price action is dominated by macro risk sentiment. When the broader crypto market sell-offs, XRP correlates. The fundamental picture (legal clarity, ETF growth, Ripple Payments ecosystem expansion) remains intact for medium-term holders.
What should I watch in the US afternoon session today?
The two critical events are: (1) US PCE Price Index at 13:30 CET — the Fed’s preferred inflation gauge. If PCE exceeds 2.5% YoY, it reinforces the ~50% Fed rate hike probability priced for December, which would be USD-bullish and GBP/USD-bearish. (2) Trump’s decision on the Iran ceasefire MOU — if he signs, expect a risk rally, oil pullback, and crypto recovery. If he rejects or delays, expect USD strength, oil spike, and equity sell-off.
Session Outlook & Final Thoughts
Today’s European session is navigating the most pivotal macro crossroads of recent months. The Iran ceasefire MOU — still awaiting Trump’s signature — has created a constructive but fragile risk environment. FTSE 100 bulls have the strongest structural case: ceasefire = lower energy costs = UK industrial margin recovery + BoE flexibility. GBP/USD bears have a clean technical setup with BoE hike bets fading and USD safe-haven demand intact. EUR/JPY longs are supported by the ECB–BoJ rate differential, with ceasefire risk-on providing a near-term catalyst toward the 187.53 2026 high.
On the commodity side, Aluminum is the cleanest ceasefire play — a durable deal reduces European energy costs, boosting smelter margins and demand from Chinese infrastructure. Natural Gas remains highly volatile around ceasefire headlines, with the $2.95–$3.20 range the operational corridor. For digital assets, XRP’s structural picture remains intact (legal clarity, ETF ecosystem, XRPL EVM sidechain) but short-term price action is macro-driven. Monitor Tether’s peg as a real-time stress indicator: USDT at $0.9987 is within normal tolerance.
The afternoon US PCE print and Trump’s Iran decision are the two binary catalysts that will define whether today ends as a sustained breakout or a bull trap. Manage leverage carefully into the binary event risk.