⚡ Next Major Catalyst
Q4 FY2026 Earnings — June 10, 2026
Oracle reports Q4 FY2026 results in 12 days. Guided: Revenue +19–21% YoY · Cloud Revenue +46–50% · Non-GAAP EPS $1.96–$2.00 · FY2027 target raised to $90 billion.
Last Price
$203.70
▲ +6.67% today
Session High
$205.00
Testing 0-level resistance
Session Low
$193.38
Intraday support
Open
$194.04
Strong gap-up session
52W High
$345.72
41% below peak
52W Low
$134.57
+51% recovery
Daily Chart — Oracle Corp (ORCL) NYSE with Fibonacci & Moving Averages

ORCL · 1D · NYSE · Fibonacci retracement from $134.71 (1) to $205.03 (0) · RSI at 66.06 · MA Ribbon (21/50/200 EMA) · Source: TradingView via CSFX-Research
Oracle Q3 FY2026 Performance & Forward Guidance (Key Metrics)
Cloud Revenue
$8.9B
+44% YoY
AI Infra Revenue
+243%
YoY growth
RPO Backlog
$553B
+325% YoY
Non-GAAP EPS
$1.79
Beat $1.71 est.
FY2026 Target
$67B
Revenue guidance
FY2027 Target
$90B
Raised guidance
Technical Analysis Summary — ORCL Next 24 Hours
▲ Bullish Momentum · Testing Key Fib 0-Level at $205.03
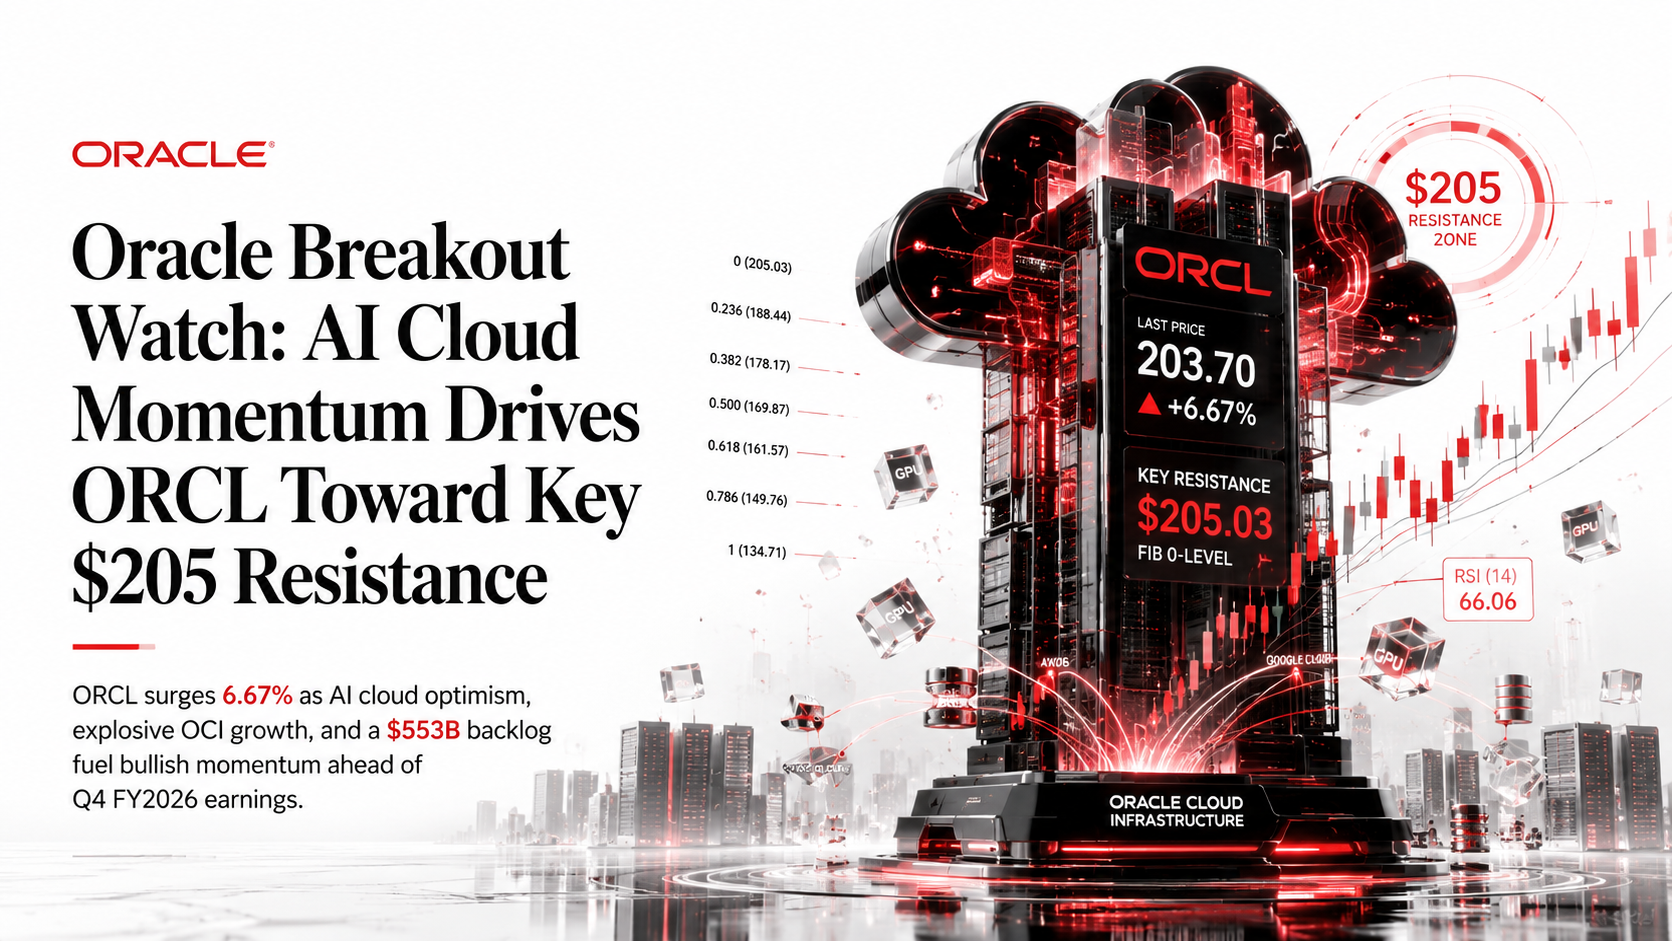
Oracle Corporation is experiencing a significant technical breakout today, surging +6.67% to $203.70, with the session high of $205.00 precisely testing the critical Fibonacci 0-level resistance at $205.03 — the highest point of the measured retracement drawn from the $134.71 swing low. This is the most important technical level on the chart for ORCL over the next 24 hours. The RSI at 66.06 is in bullish territory with the signal line at 60.91, confirming momentum continuation without yet signalling an overbought reversal. The 21 EMA ($167.28) and 50 EMA ($169.65) are both rising and positioned well below current price, providing a supportive EMA structure.
The price has recovered from the $134.71 April low and has now cleared all Fibonacci retracement levels from 0.786 ($149.76) through 0.500 ($169.87) and 0.382 ($178.17) and 0.236 ($188.44) — a remarkably aggressive retracement recovery. The descending supply zone from the 2025 highs around $200–$205 is now being challenged. A daily close above $205.03 on elevated volume would be a decisive bullish breakout signal targeting the $220–$240 zone.
RSI (14)66.06 — Bullish
RSI Signal60.91 — Rising
21 EMA$167.28 — Strong support
50 EMA$169.65 — Support
200 EMA$188.41 — Now below price
Key Resistance$205.03 (Fib 0-Level)
Breakout Level$205.50 — daily close
Trend DirectionUptrend — recovery phase
MomentumStrong — gap & rally
Bias (24H)BULLISH (at resistance)
Fibonacci Retracement Levels — $134.71 (Bottom) → $205.03 (Top)
| Fib Level |
Price (USD) |
Role (Next 24H) |
Status |
| 0 (Top) | $205.03 | KEY RESISTANCE — session high test | 🔴 Being tested NOW |
| Current Price | $203.70 | Active trading zone | 🔵 Trading here |
| 0.236 | $188.44 | First support on pullback | 🟢 Cleared — now support |
| 0.382 | $178.17 | Intermediate support | 🟢 Cleared |
| 0.500 | $169.87 | Mid-range support | 🟢 Cleared |
| 0.618 | $161.57 | Golden ratio support | 🟢 Cleared |
| 0.786 | $149.76 | Deep support | 🟢 Cleared |
| 1 (Bottom) | $134.71 | April 2026 swing low | 🟢 Major swing low |
Note: ORCL has cleared ALL intermediate Fibonacci retracement levels from the April $134 low — a full recovery challenge of the prior supply zone at $205. This is exceptionally bullish internal structure.
Fundamental Drivers — Key Catalysts for ORCL (24H)
🟢 Today’s Catalyst
Snowflake Earnings Beat Triggers AI SaaS Sector Recovery
Snowflake’s impressive Q1 FY2027 earnings results provided clear evidence that the “SaaSpocalypse” — which erased ~$2 trillion from software market values since late 2025 — was overstated. Oracle, as a core AI cloud infrastructure provider, is a direct beneficiary of renewed investor confidence in enterprise software platforms at the centre of AI workflows.
🟢 Structural Catalyst
$553B Remaining Performance Obligation (RPO) Backlog
Oracle’s RPO — signed contracts yet to be recognised as revenue — stands at $553 billion, up 325% year-over-year. This backlog, which includes major AI infrastructure contracts from OpenAI, NVIDIA, and TikTok US (Oracle secured a 15% stake), provides exceptional revenue visibility for FY2026–FY2030 and underpins management’s $90B FY2027 guidance.
🤖 AI Growth Engine
OCI Revenue +84% YoY — Oracle Cloud Infrastructure Dominates
Oracle Cloud Infrastructure delivered $4.9 billion in Q3, up 84% year-over-year, with AI infrastructure revenue growing 243% and multicloud database revenue surging 531%. OCI is now a genuine competitor to AWS, Azure, and Google Cloud for AI workloads, with 33 Microsoft regions, 14 Google regions, and 8 AWS multicloud regions live.
🟢 Forward Guidance
Q4 FY2026 Guidance: Revenue +19–21%, Cloud +46–50%, EPS $1.96–$2.00
Management provided strong Q4 guidance with revenue growth of 19–21% in USD, cloud revenue growth of 46–50%, and non-GAAP EPS of $1.96–$2.00. Full-year FY2026 revenue guidance was reaffirmed at $67 billion, while FY2027 guidance was raised to $90 billion — signalling management confidence in sustained hypergrowth execution.
🔴 Risk Factor
Securities Fraud Class Action Lawsuit (ORCL)
Multiple securities fraud class action lawsuits were filed against Oracle in March 2026, with an April 6 deadline. While the stock has recovered strongly, this legal overhang remains an unresolved risk and could weigh on institutional participation if proceedings escalate ahead of Q4 earnings on June 10.
🔴 Valuation Risk
$50 Billion CapEx Guidance for FY2026 Raises Cash Flow Concern
Oracle has guided for $50 billion in capital expenditures in FY2026, reflecting aggressive data center expansion. While 90% of committed capacity is partner-funded, the absolute scale of capex is a cash flow concern and may pressure free cash flow margins in the near term. Bears argue that revenue recognition from the $553B RPO may take longer than the market prices in.
📅 Event Calendar — Next 24 Hours & Near-Term Catalysts
-
TODAY · MARKET
Post-Snowflake Sentiment Contagion — SaaS Sector Re-rating
🔴 HIGH IMPACT — SNOW’s earnings beat is actively being re-priced across AI software names. Oracle, as the largest AI cloud infrastructure provider with direct exposure to enterprise AI workloads, is the most direct beneficiary. Momentum could extend through today’s session as sector rotation into AI cloud names accelerates.
-
TODAY · ALL DAY
$205.03 Fibonacci 0-Level Resistance — Breakout Watch
🔴 TECHNICAL EVENT — The session high of $205.00 tested Fib 0 at $205.03. A daily close above this level on volume confirmation would trigger technical breakout signals and activate algorithmic buy orders targeting the $215–$225 zone. A rejection here would invite profit-taking to $193–$196.
-
MAY 30 · 18:00 IST
US PCE Inflation Data (April 2026)
🟡 MEDIUM IMPACT — Core PCE is the Fed’s preferred inflation metric. A soft reading supports risk-on sentiment and growth stock outperformance, benefiting ORCL. A hot print could trigger tech sector rotation selling and push ORCL back to $193–$196 support.
-
JUNE 10 · POST-MARKET
⭐ Oracle Q4 FY2026 Earnings Report (12 Days Away)
🔴 HIGH IMPACT — This is the defining near-term event. Oracle has guided Q4 revenue growth of 19–21% and non-GAAP EPS of $1.96–$2.00. The market will focus on (1) RPO conversion rate, (2) OCI growth vs 84% Q3 pace, (3) FY2027 $90B guidance confirmation. A beat could send ORCL toward $220–$240. A miss or guidance cut could reverse gains sharply.
-
ONGOING
Securities Class Action Lawsuit — Settlement or Escalation Watch
🟡 MEDIUM IMPACT — The April 6 deadline securities fraud class action proceedings remain in progress. Any news of settlement, dismissal, or escalation will move the stock. Settlement news would likely be taken as a modest positive, removing the legal uncertainty overhang ahead of Q4 earnings.
Structured Trade Setup — Oracle Corporation (ORCL)
▲
DIRECTIONAL BIAS: LONG (BUY ON BREAKOUT or PULLBACK) — ORCL is in a powerful recovery trend with RSI 66, all Fibonacci levels cleared, and a major AI earnings catalyst in 12 days. Two entry strategies are outlined below: (1) Breakout Buy above $205.50, (2) Pullback Buy on retrace to $193–$196 support zone.
Strategy A — Breakout Buy (Aggressive)
Entry
$205.50+
Daily close above Fib 0 ($205.03) with volume
Stop Loss
$196.00
Below 0.236 Fib pullback zone
Take Profit 1
$215.00
+4.6% from entry · Round number resistance
Take Profit 2
$225.00
+9.5% — pre-Q4 earnings target
Take Profit 3
$240.00
+16.8% — post-Q4 beat scenario
Hold Window
2–14 days
Through Q4 earnings on June 10
Strategy B — Pullback Buy (Conservative)
Entry Zone
$193–$196
Retest of Fib 0.236 level ($188.44) and 200 EMA area
Stop Loss
$186.00
Below Fib 0.236 — bullish structure intact
Take Profit
$210–$220
Above Fib 0-level on breakout confirmation
Risk/Reward — Strategy A (TP1)
≈ 1 : 1.0 | (TP2) ≈ 1 : 2.1 | (TP3) ≈ 1 : 3.6
Risk/Reward — Strategy B (TP Mid)
≈ 1 : 2.5
Key Invalidation
Daily close below $186 (Fib 0.236) — exit all longs
Pre-Earnings Risk
Reduce position size by 50% before June 10 if not stopped out
Market Conclusion — Oracle Corporation (ORCL), May 29, 2026
Oracle Corporation is in one of its most technically and fundamentally compelling positions of the past 18 months. Today’s +6.67% surge, triggered by Snowflake’s earnings beating AI SaaS sector fears, has brought ORCL to the decisive Fibonacci 0-level resistance at $205.03 — the exact top of the measured retracement from the April $134.71 swing low. The RSI at 66.06 confirms healthy momentum without extreme overbought conditions, and the EMA structure (21/50/200 all rising and well below price) provides a strong technical foundation.
Fundamentally, Oracle’s $553 billion RPO backlog, 84% OCI revenue growth, 243% AI infrastructure growth, and raised FY2027 guidance to $90 billion make it one of the most powerful AI infrastructure theses in global equity markets. The Q4 FY2026 earnings release on June 10, 2026 is the next major catalyst and will either confirm the recovery story (target $220–$240) or introduce selling pressure if execution disappoints. Traders should watch the $205.03 Fib 0-level closely — a decisive daily close above this level is the most important technical event for ORCL in the coming days.
Frequently Asked Questions — Oracle Stock (ORCL) Trading
Why is Oracle (ORCL) stock rising so sharply on May 29, 2026?
Oracle shares surged +6.67% today primarily because Snowflake (SNOW) delivered an impressive earnings beat, which provided strong evidence that the “SaaSpocalypse” — a rolling selloff that had erased approximately $2 trillion from software market values since late 2025 on fears that AI would make subscription software obsolete — was overstated. As a core AI cloud infrastructure platform with a $553 billion RPO backlog and 84% OCI revenue growth, Oracle is one of the direct beneficiaries of renewed institutional confidence in enterprise AI software platforms.
What is the most important technical resistance level for ORCL today?
The most critical resistance level for Oracle stock on May 29, 2026 is the Fibonacci 0-level at $205.03, which represents the top of the retracement measured from the April 2026 swing low of $134.71. The session high of $205.00 precisely tested this level. A daily close above $205.03 on strong volume would represent a major technical breakout, potentially opening a run toward $215–$225 in the coming weeks ahead of the June 10 Q4 earnings.
When does Oracle report Q4 FY2026 earnings?
Oracle is scheduled to report its Q4 FY2026 earnings on June 10, 2026, after market close. Management has guided for revenue growth of 19–21% in USD, total cloud revenue growth of 46–50%, and non-GAAP EPS of $1.96–$2.00. The market will focus on OCI revenue growth trajectory (vs 84% in Q3), RPO conversion rate, and any update to the FY2027 $90 billion revenue target.
What is Oracle’s AI cloud competitive position vs AWS and Azure?
Oracle Cloud Infrastructure (OCI) has emerged as a genuine AI hyperscaler, with revenue growing 84% year-over-year to $4.9 billion in Q3 FY2026. OCI operates multicloud regions across 33 Microsoft Azure locations, 14 Google Cloud locations, and 8 AWS locations (targeting 22 by Q4 exit). Key OCI customers include OpenAI, NVIDIA, and TikTok US. Oracle’s GPU cluster density and pricing are cited by management as competitive advantages over AWS and Azure for specific AI training and inference workloads.
What is the stop loss for an Oracle long trade on May 29, 2026?
For a breakout long above $205.50, the recommended stop loss is $196.00, which is below the Fib 0.236 pullback zone. For a conservative pullback entry in the $193–$196 zone, the stop loss should be placed at $186.00, just below the Fibonacci 0.236 exact level at $188.44. A daily close below $186 would invalidate the current bullish recovery structure and suggest a retest of the $178 area.
⚠️ Risk Disclosure & Disclaimer: This report is produced by CSFX-Research for informational and educational purposes only. Nothing in this report constitutes financial advice, investment recommendations, or solicitation to trade. Equity investments carry substantial risk of loss including total loss of invested capital. Past performance is not indicative of future results. Oracle Corporation’s stock price can be highly volatile around earnings events. Always conduct your own due diligence and consult a licensed financial adviser before making investment decisions. Data sourced from Oracle Investor Relations, TipRanks, Yahoo Finance, Bloomberg, Reuters, and TradingView as of May 29, 2026.