Trade Idea for BTCUSD Today: Technical Summary, Fundamental News and a Trade Setup With Entry, Stop Loss and Take Profit
Market Outlook on NVIDIA Corporation Today: Technical Summary, Fundamental News and a Trade Setup With Entry, Stop Loss and Take Profit
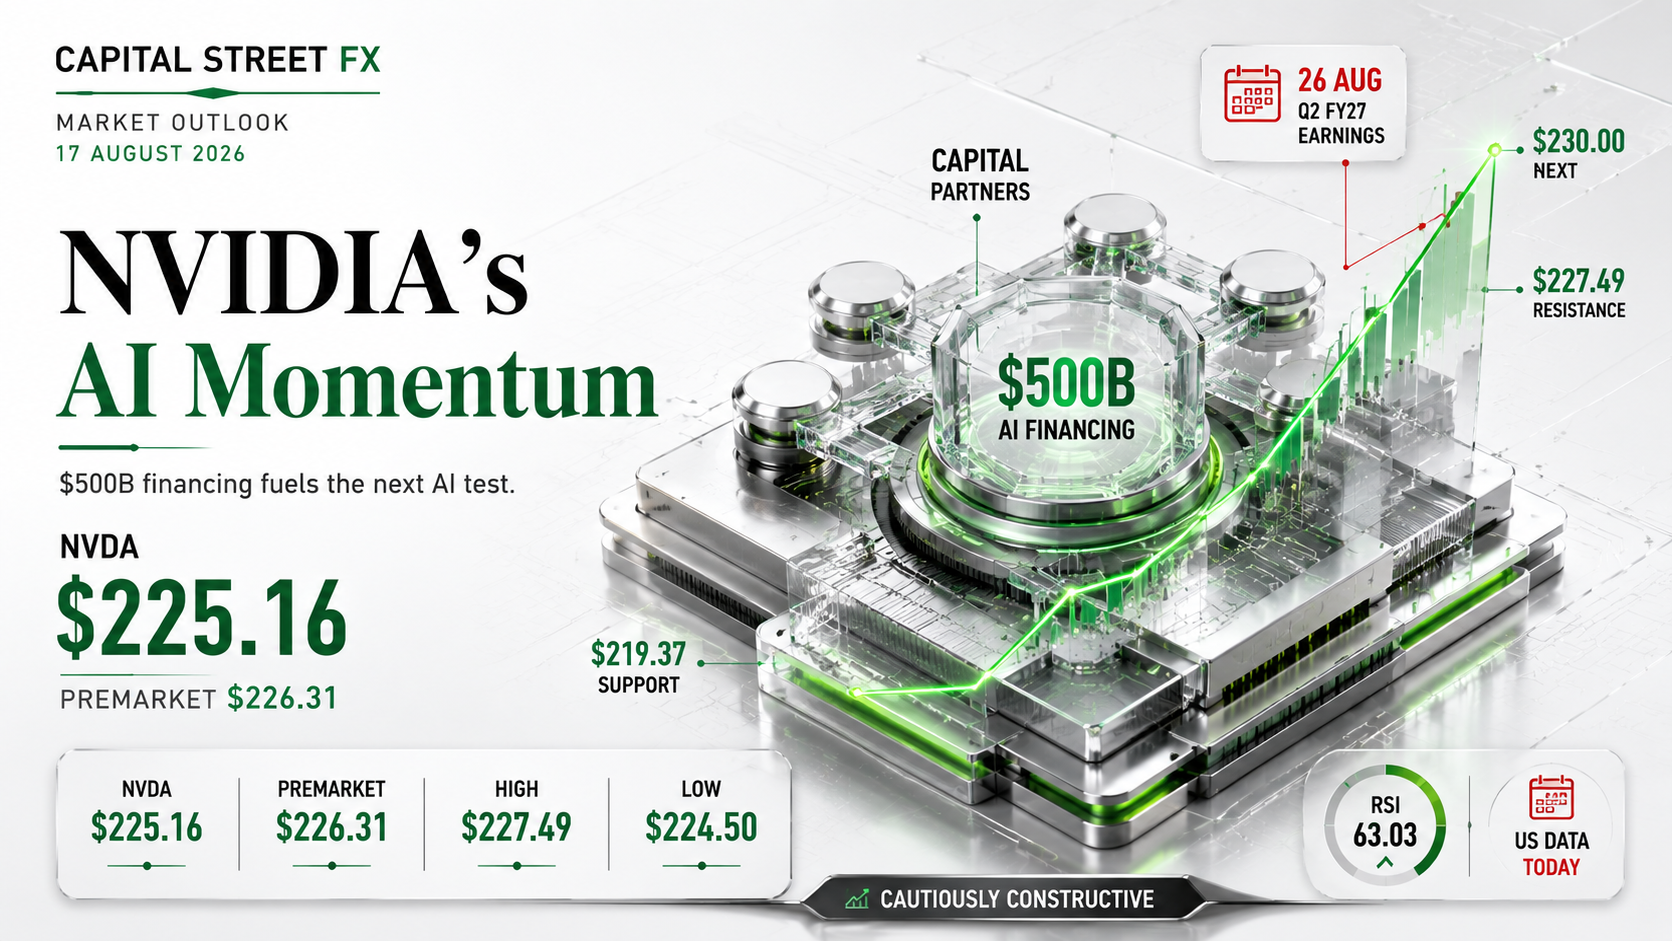
Nvidia stock holds near $225.16 heading into today’s session, consolidating just under its recent high after last week’s $500 billion AI financing initiative and ahead of Q2 FY27 earnings on 26 August.
A same-day Market Outlook on NVIDIA Corporation covering today’s price action, the fundamental news most likely to move NVDA shares, the event calendar for the next 24 hours — closing with a trade setup that lists entry, stop loss and take profit. Nvidia closed Friday’s session at $225.16, down 0.06 percent on the day, after trading between $224.50 and $227.49 on an open of $226.77. The stock slipped a further 0.20 percent after hours to roughly $224.72 before premarket indications on Monday firmed back up to around $226.31, leaving the stock roughly 4.8 percent below its recent swing high of $236.49.
Nvidia enters the next 24 hours with two storylines dominating the outlook. First is the market’s continued digestion of the $500 billion AI infrastructure financing initiative unveiled on 10 August with Apollo, BlackRock, Blackstone, Brookfield, Goldman Sachs and KKR, with Reuters reporting Goldman is now in active talks with insurers, money managers and banks to fund the programme — a structure sell-side desks say could turn AI compute into a new tradeable asset class. Second is today’s US Empire State Manufacturing Index at 8:30am Eastern, a broad macro catalyst that will shape risk appetite across the Nasdaq just as NVDA shares hold above key Fibonacci support. That combination makes today’s session, 17 August 2026, one of the more consequential 24-hour windows of the month for the stock, with UBS and Morgan Stanley commentary ahead of the 26 August earnings report adding further two-way volatility.
Fundamental News Set to Impact the Price Next
The stories driving today’s move and shaping the outlook for the next 24 hours
Technical Summary and Chart Analysis for Today
Daily structure, Fibonacci levels, moving averages and RSI as of 17 August 2026

Nvidia’s technical summary for today shows a stock consolidating just beneath its recent swing high after a mild pullback. NVDA opened Friday’s session at $226.77, ranged between $224.50 and $227.49, and closed at $225.16, down 0.06 percent, before easing a further 0.20 percent after hours to roughly $224.72. Premarket dealing on Monday points to a firmer $226.31, suggesting buyers are defending the pullback rather than extending it.
The Fibonacci grid on the NVDA daily chart is measured from the $163.96 swing low to the $236.49 swing high. Price is holding in the uppermost band of that structure, above the 0.236 retracement at $219.37, which lines up closely with the stock’s recent consolidation floor. A sustained hold above this level keeps the broader uptrend that began in April intact, while a break lower would expose the 0.382 retracement near $208.78.
The moving-average picture remains constructive: the 20-day EMA sits near $210.39, the 50-day EMA near $206.52, and the longer 100-day average near $204.28, all comfortably beneath the current price, forming a rising staircase consistent with an intact uptrend. The daily RSI reads 63.03, above its 55.31 signal line, confirming positive momentum without yet reaching overbought territory above 70.
NVDA Technical Levels at a Glance · Next 24 Hours
- Resistance 1: $227.49 — Friday’s intraday high, the immediate ceiling for today’s session
- Resistance 2: $230.00 — round-number level and short-term supply zone
- Resistance 3: $236.49 — the 0 Fibonacci level and recent swing high
- Support 1: $224.50 — Friday’s intraday low
- Support 2: $219.37 — the 0.236 Fibonacci retracement, the key level to defend
- Support 3: $210.39 — the 20-day EMA, a deeper support band on a sharper pullback
- Momentum: RSI 63.03 above its 55.31 signal line, bullish but not yet overbought
Calendar — Events That Can Move Prices in the Next 24 Hours
Key releases and events shaping the outlook over the coming 24 hours
| Date / Time | Event | Detail | Impact | Why It Matters |
|---|---|---|---|---|
| Mon Aug 17, pre-market through the open |
Full-Session Digestion of Friday’s Close | Market absorbs Friday’s $225.16 close and the firmer $226.31 premarket print as the cash session opens | 🔴 CRITICAL | How NVDA opens and trades in the first hour will set the tone for whether the premarket firmness holds or fades |
| Mon Aug 17, 8:30 ET 18:00 IST |
US Empire State Manufacturing Index (Aug) | First major US data point of the week, setting the tone for risk appetite ahead of Tuesday’s housing data | 🔴 CRITICAL | A broad macro catalyst for the Nasdaq that lands directly into NVDA’s post-financing-news consolidation |
| Mon Aug 17, ongoing through the session |
Nvidia AI Financing Deal Newsflow | Continued reporting on Goldman Sachs and coalition partners’ investor outreach for the $500 billion financing platform | 🟢 HIGH | Fresh headlines on investor commitments or terms could add two-way volatility to NVDA shares through the day |
| Tue Aug 18, 8:30 ET 18:00 IST |
US Housing Starts, Building Permits & Trade Price Indices (Jul) | Broad housing and trade-price data landing just inside the 24-hour window | 🟢 HIGH | Additional data points shaping the Federal Reserve’s near-term rate path ahead of Wednesday’s FOMC minutes |
| Tue Aug 18, 9:15 ET 18:45 IST |
US Industrial Production & Capacity Utilization (Jul) | Manufacturing-sector output data, relevant to the broader tech and semiconductor supply chain | 🟢 HIGH | A read on industrial demand that can influence sentiment across chip and hardware names including Nvidia |
| Wed Aug 19, scheduled outside this window |
FOMC Minutes (28–29 July Meeting) | Lands just outside this strict 24-hour window as the week’s single most important scheduled macro event | ⚪ MEDIUM | The next broad macro catalyst for risk appetite, relevant for positioning heading into Wednesday’s session |
NVDA · NVIDIA Corporation Trade Setup for the Next 24 Hours: Entry, Stop Loss and Take Profit
NVDA · NVIDIA Corporation · $225.16 — ▲ CAUTIOUSLY CONSTRUCTIVE — Buy Dips Into $222.50–$224.50, Target the $227.49–$236.49 Zone
NVDA · NVIDIA Corporation
Technical Summary (Next 24 Hours)
Nvidia is trading around $225.16 into today’s open, holding comfortably above the 0.236 Fibonacci support at $219.37 and the 20-day EMA at $210.39. The RSI at 63.03 above its 55.31 signal line confirms bullish momentum without being overbought, and the stock’s premarket firmness at $226.31 suggests dip-buyers remain active.
Fundamental Driver
Today’s dominant catalyst is continued digestion of Nvidia’s $500 billion AI infrastructure financing initiative, with Goldman Sachs now soliciting investors alongside Apollo, BlackRock, Blackstone, Brookfield and KKR, layered against growing anticipation of the 26 August fiscal Q2 2027 earnings report. Today’s US Empire State Manufacturing Index adds a second layer of broad macro risk.
Risk Management
Risk on the dip entry is roughly $2.66 to $6.00 against a $2.99 to $13.99 move to the staged take-profit levels, a risk-to-reward ratio that improves meaningfully at TP2 and TP3. Given the scale of the AI-financing newsflow and the approaching earnings date, consider reducing position size into any headline-driven spike and trailing stops once TP1 is reached.
There are two valid ways to express this NVDA trade idea into a session dominated by financing-deal newsflow. The patient version waits for a pullback into $222.50 to $224.50, close to Friday’s low, entering once price shows signs of holding rather than sliding through it. The momentum version buys a confirmed reclaim above $227.49, accepting a higher entry level in exchange for confirmation that buyers are pushing back toward the $236.49 swing high.
What would make this NVDA trade setup fail? The clearest failure mode is a broad risk-off reaction to a hot Empire State print or a hawkish repricing ahead of Wednesday’s FOMC minutes, compounding any profit-taking ahead of the 26 August earnings date. If the stock breaks below $218.50 and then the 0.382 Fibonacci support near $208.78, the path opens back toward the 50-day EMA near $206.52.
FAQ: Today’s Price, Technicals and Trade Setup
Common questions traders ask on 17 August 2026
Outlook for the Next 24 Hours
Nvidia stock is trading near $225.16 heading into the session, holding just under its recent swing high after last week’s $500 billion AI infrastructure financing announcement and ahead of the 26 August fiscal Q2 2027 earnings report. The next 24 hours are dominated by two things: continued digestion of the Goldman Sachs-led financing newsflow, and the US Empire State Manufacturing Index due at 8:30am Eastern today — the stock is holding above its 0.236 Fibonacci support near $219.37, the daily RSI at 63.03 remains above its 55.31 signal line without being overbought, and premarket dealing at $226.31 suggests buyers are defending Friday’s modest pullback.
The NVDA trade setup for the next 24 hours is to buy dips into $222.50 to $224.50 or a confirmed reclaim above $227.49, with a stop loss at $218.50 and take profit staged at $227.49, $230.00 and $236.49. Watch the $219.37 Fibonacci level as the line that separates a genuine continuation of the uptrend from a deeper pullback toward $208.78, and treat any fresh AI-financing headlines or shifts in options positioning ahead of the 26 August earnings date as the developments most capable of changing the picture before this window closes.
This report on NVIDIA Corporation will be updated as new price action and fundamental developments unfold. For traders looking to act on today’s NVDA setup with flexible leverage and fast execution around a high-volatility, news-driven session like this one, Capital Street FX offers the tools to position around fast-moving developments.
Explore Capital Street FX