Trade Idea for Corn Today: Technical Summary, Fundamental News and a Trade Setup With Entry, Stop Loss and Take Profit
Trade Idea for Corn Today: Technical Summary, Fundamental News and a Trade Setup With Entry, Stop Loss and Take Profit
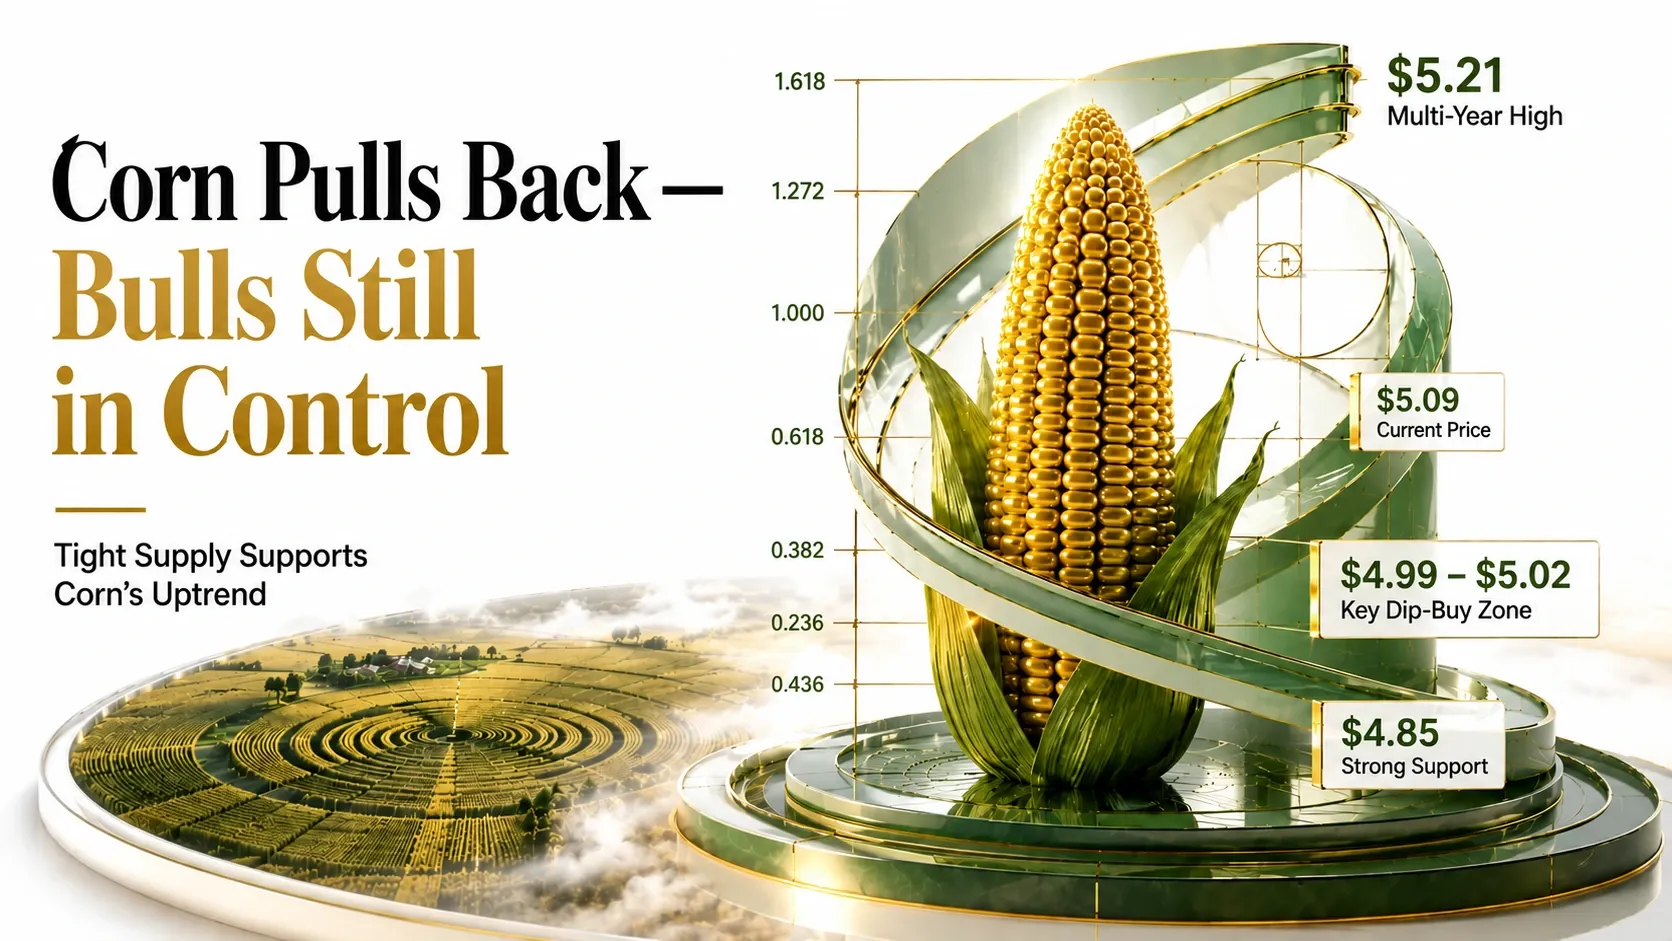
Corn trades at $5.0928, down 1.60 percent over the past 24 hours, consolidating just below the Fibonacci origin at $5.2121 as tightening US and global supply concerns collide with routine technical profit-taking to kick off September.
A same-day trade idea for corn covering today’s price action, the fundamental news most likely to move the market, the event calendar for the next 24 hours, and the small details worth knowing about a commodity that can swing on a single USDA report or crop-condition update. ZC1 is holding near $5.0928 as of 14:26 IST on 2 September 2026, down 1.60 percent over the past 24-hour candle, after a range of $5.0856 to $5.2067 on an open of $5.2019. The market enters September having rallied hard through August to trade above $5.10 per bushel, its highest level since July 2023, before today’s mild pullback as contracts fade off the overnight high to start the new month.
Corn enters the next 24 hours with a genuinely tight supply picture underpinning the broader uptrend: the USDA cut its 2026 US corn yield forecast by 2.3 bushels per acre to 180.7, while the Pro Farmer Crop Tour came in well below that at 173.2 bushels per acre, with production projected at 15.34 billion bushels. Crop conditions have deteriorated through August, with the share of the crop rated good-to-excellent slipping toward the high-40s to high-50s percent range as rising disease pressure, including crown rot, follows heavy August rainfall across parts of the Corn Belt. Against that backdrop, the USDA also raised its 2026/27 export forecast by 75 million bushels to 3.3 billion, reflecting stronger global demand, while prolonged heat and drought have weakened European corn production and constrained Ukrainian exports are adding further pressure to global supplies. That tension between a tightening balance sheet and today’s modest technical pullback is what makes corn’s setup worth tracking with discipline around defined levels through what remains a fast-moving, weather-and-data-sensitive market.
Fundamental News Set to Impact the Price Next
The stories driving today’s move and shaping the outlook for the next 24 hours
Technical Summary and Chart Analysis for Today
Daily structure, Fibonacci levels and range context as of 2 September 2026

The corn technical summary for today shows a market pulling back modestly just below the top of its 2026 uptrend, holding near $5.0928 following a 24-hour range of $5.0856 to $5.2067 on an open of $5.2019, down 1.60 percent. Because corn trades on the CBOT with defined daily sessions, this is a genuine daily candle, and the pullback from the session high signals routine profit-taking after a strong August advance rather than a change in the underlying trend.
The Fibonacci grid on the corn daily chart is measured across the market’s 2026 advance, from the base low at $4.2598, near where the market bottomed earlier in the year, up to the origin high at $5.2121, close to today’s session high and the market’s highest level since July 2023. Price is sitting between the origin and the 23.6 percent retracement at $4.9873, a shallow pullback: a hold above $4.9873 keeps the uptrend intact and opens the door back toward the $5.2121 origin and a potential extension toward $5.35, while a loss of that level points toward the 38.2 percent retracement at $4.8483 and, more meaningfully, the 50 percent midpoint at $4.7359.
The broader chart context matters here: corn spent the first half of 2026 consolidating before breaking out sharply through the summer on tightening yield expectations, with the shaded advance on the daily chart capturing a market that has moved from the low $4 handle toward multi-year highs above $5.20. The RSI reading of 67.11, just above its signal line at 65.67, shows momentum still tilted bullish but edging toward overbought territory, reinforcing that today’s pullback is best read as healthy consolidation within an intact uptrend rather than a reversal signal.
Corn Technical Levels at a Glance · Next 24 Hours
- Resistance 1: $5.1221 — today’s session high area
- Resistance 2: $5.2121 — the Fibonacci origin and multi-year high
- Resistance 3: $5.35 — a round-number extension beyond the origin
- Support 1: $5.0856 — today’s session low
- Support 2: $4.9873 — the 23.6% Fibonacci retracement
- Support 3: $4.8483 — the 38.2% Fibonacci retracement
- Pivot: $4.9873 to $5.02 — zone just above the 23.6% Fibonacci retracement, where a dip-buy setup is favoured
Calendar — Events That Can Move Prices in the Next 24 Hours
Key releases and events shaping the outlook over the coming 24 hours
| Date / Time | Event | Detail | Impact |
|---|---|---|---|
| Today 10:30am ET / 8:00pm IST | EIA Weekly Ethanol Production and Stocks | Ethanol accounts for roughly 38 percent of US corn demand, so this week’s production and stockpile data is a live read on the demand side of the balance sheet through the session | MEDIUM |
| Today 2:00pm ET / 11:30pm IST | Federal Reserve Beige Book | The Fed’s regional economic snapshot ahead of the 15-16 September FOMC meeting can move the US dollar, which directly affects export competitiveness for US corn on world markets | MEDIUM |
| Thursday 8:30am ET (within 24hr window) | USDA Weekly Export Sales Report | The first full weekly export sales report of the 2026/27 marketing year, which began 1 September, is due Thursday morning and will be closely watched for confirmation of the USDA’s recently raised export forecast | HIGH |
| Ongoing 24-hour trade | Crop-Disease and Weather Monitoring | Continued monitoring of crown rot disease pressure following heavy August rainfall, alongside any shift in the near-term weather outlook for the Corn Belt during the dough-to-dent transition, remains a live factor through the session | MEDIUM |
| Today 8:15am ET | ADP National Employment Report (August) | A broader macro release capable of shaping the US dollar and risk appetite over the next 24 hours, an indirect but relevant influence on commodity positioning including corn | LOW |
Corn Trade Setup for the Next 24 Hours: Entry, Stop Loss and Take Profit
ZC1 · CBOT Corn Futures · $5.0928 — • PULLING BACK FROM A MULTI-YEAR HIGH — Buy Dips Toward $4.99–5.02 or a Hold Above $5.15, Target the $5.12–5.35 Zone
Corn · ZC1
Technical Summary (Next 24 Hours)
Corn is holding near $5.0928 after a 24-hour range of $5.0856 to $5.2067, down 1.60 percent, consolidating between the Fibonacci origin at $5.2121 and the 23.6 percent retracement at $4.9873. This placement means today’s session is a shallow pullback within an intact uptrend: a hold above $4.9873 favours a push back toward the $5.2121 origin and on to $5.35, while a loss of that level favours a retest of the $4.8483 support.
Fundamental Driver
Today’s dominant backdrop is a tightening supply picture, with the USDA’s cut to its 2026 yield forecast and the Pro Farmer Crop Tour’s even lower estimate reinforcing concerns about a smaller crop, against a modest technical pullback as funds pause after adding to long positions through late August. Thursday’s USDA weekly Export Sales report, the first full print of the new 2026/27 marketing year, sits just outside today’s 24-hour window but is already shaping positioning.
Risk Management
Risk on the pullback-buy entry is roughly $0.07 to $0.17 against a $0.10 to $0.35 move to the staged take-profit levels, a risk-to-reward profile that improves meaningfully at TP2 and TP3. Given that corn can move sharply on a single USDA report or crop-condition surprise, consider staged profit-taking into strength, conservative position sizing relative to the commodity’s typical volatility, and a firm stop-loss order given how quickly sentiment can shift around scheduled data releases. The idea is invalidated on a close below $4.8483, the 38.2 percent Fibonacci retracement, which would open a path back toward the $4.7359 midpoint of the range.
There are two valid ways to express this corn trade idea in a market pulling back modestly from a multi-year high. The patient version waits for a pullback into $4.99 to $5.02, a zone just above the 23.6 percent retracement, entering once price shows signs of holding rather than chasing the move mid-pullback. The momentum version buys a confirmed hold above $5.15, accepting a slightly higher entry level in exchange for confirmation that the market has genuinely resumed its advance rather than fading further, as commodities often do after a sharp multi-week rally.
A few small things worth knowing before sizing this corn trade: ZC1 futures on the CBOT have defined trading sessions and a contract-expiry calendar, so traders should confirm which contract month their broker is quoting and be aware of the front-month roll date, which can introduce price gaps unrelated to fundamentals; there were 187 delivery notices issued against the September contract overnight, a reminder that the front month is now in its delivery period. Corn is highly seasonal, with harvest pressure typically building through September and October as new-crop supply reaches the market, so today’s tight-supply narrative will be tested directly against combines entering the field over the coming weeks. Crop-disease pressure such as this year’s crown rot outbreak can also affect final yield in ways that only become clear at harvest, meaning the fundamental picture may keep shifting day to day rather than settling quickly.
What would make this corn trade idea fail? The clearest failure mode is a smoother-than-expected harvest that outpaces the Pro Farmer Crop Tour’s lower yield estimate, combined with a soft Thursday export sales print, which would ease the tight-supply narrative and pressure prices toward the lower end of the recent range. A stronger US dollar following a hawkish read on Wednesday’s Fed Beige Book, an unexpected improvement in European or Ukrainian supply conditions, or a broader risk-off move in commodities are the other developments most capable of pressuring corn back toward the $4.8483 and $4.7359 support levels.
FAQ: Today’s Price, Technicals and Trade Setup
Common questions traders ask on 2 September 2026
Conclusion and Outlook for the Next 24 Hours
Corn is holding near $5.0928, down 1.60 percent over the past 24 hours, after a range of $5.0856 to $5.2067, pulling back modestly from a multi-year high near $5.21 as markets digest a tightening 2026 yield outlook against routine technical profit-taking to open September. The next 24 hours are dominated by Thursday’s USDA weekly Export Sales report, the opening print of the 2026/27 marketing year, alongside Wednesday’s EIA ethanol data and the Federal Reserve’s Beige Book — the market has rallied hard through August on the back of the USDA’s yield cut and the Pro Farmer Crop Tour’s even lower estimate, price is consolidating just below its Fibonacci origin, and corn enters the session testing whether it can hold the 23.6 percent retracement and push back on toward $5.2121 and beyond. The technical picture supports the same read: a commodity pulling back modestly within an intact uptrend is being tested against a genuinely tightening fundamental backdrop, which is what makes today’s corn setup worth tracking with discipline through what remains a fast-moving, data-sensitive market.
The corn trade setup for the next 24 hours is to buy dips into $4.99 to $5.02 or a confirmed hold above $5.15, with a stop loss at $4.8483 and take profit staged at $5.1221, $5.2121 and $5.35. Watch $4.8483 as the line that separates continued range-trading from a deeper retest of the $4.7359 midpoint of the range, and treat a soft export sales print, an unexpectedly smooth harvest start, or a stronger US dollar tied to this week’s Fed data as the developments most capable of changing the picture before this window closes.
This trade idea on corn will be updated as new price action and fundamental developments unfold. For traders looking to act on today’s corn setup with flexible leverage and fast execution around a weather-and-data-driven, high-volatility commodity like this one, Capital Street FX offers the tools to position around fast-moving agricultural markets. Traders who are new to the platform can open an account in minutes, and existing clients funding a new position may want to check the current deposit bonus terms before sizing up into this setup.
Open an AccountRelated Research from the CSFX Desk
Trading equities alongside agricultural commodities this week? See today’s companion report, Market Outlook on Moderna, Inc. (MRNA) Today: Technical Summary, Fundamental News and a Trade Setup, for the technical levels and catalysts shaping the biotech stock in the same 24-hour window.