Wall Street Wobbles as Oil Tops $97 and 10-Year Yields Hold Near 4.84% Into Today’s PPI Report | Technical Analysis – US Session | 10 September 2026
Wall Street Wobbles as Oil Tops $97 and 10-Year Yields Hold Near 4.84% Into Today’s PPI Report
USD/CAD · USD/CHF · Gold · Crude Oil · Nasdaq 100 · US 10Y · BTC/USD · XRP — live U.S. market outlook today, updated through the trading session
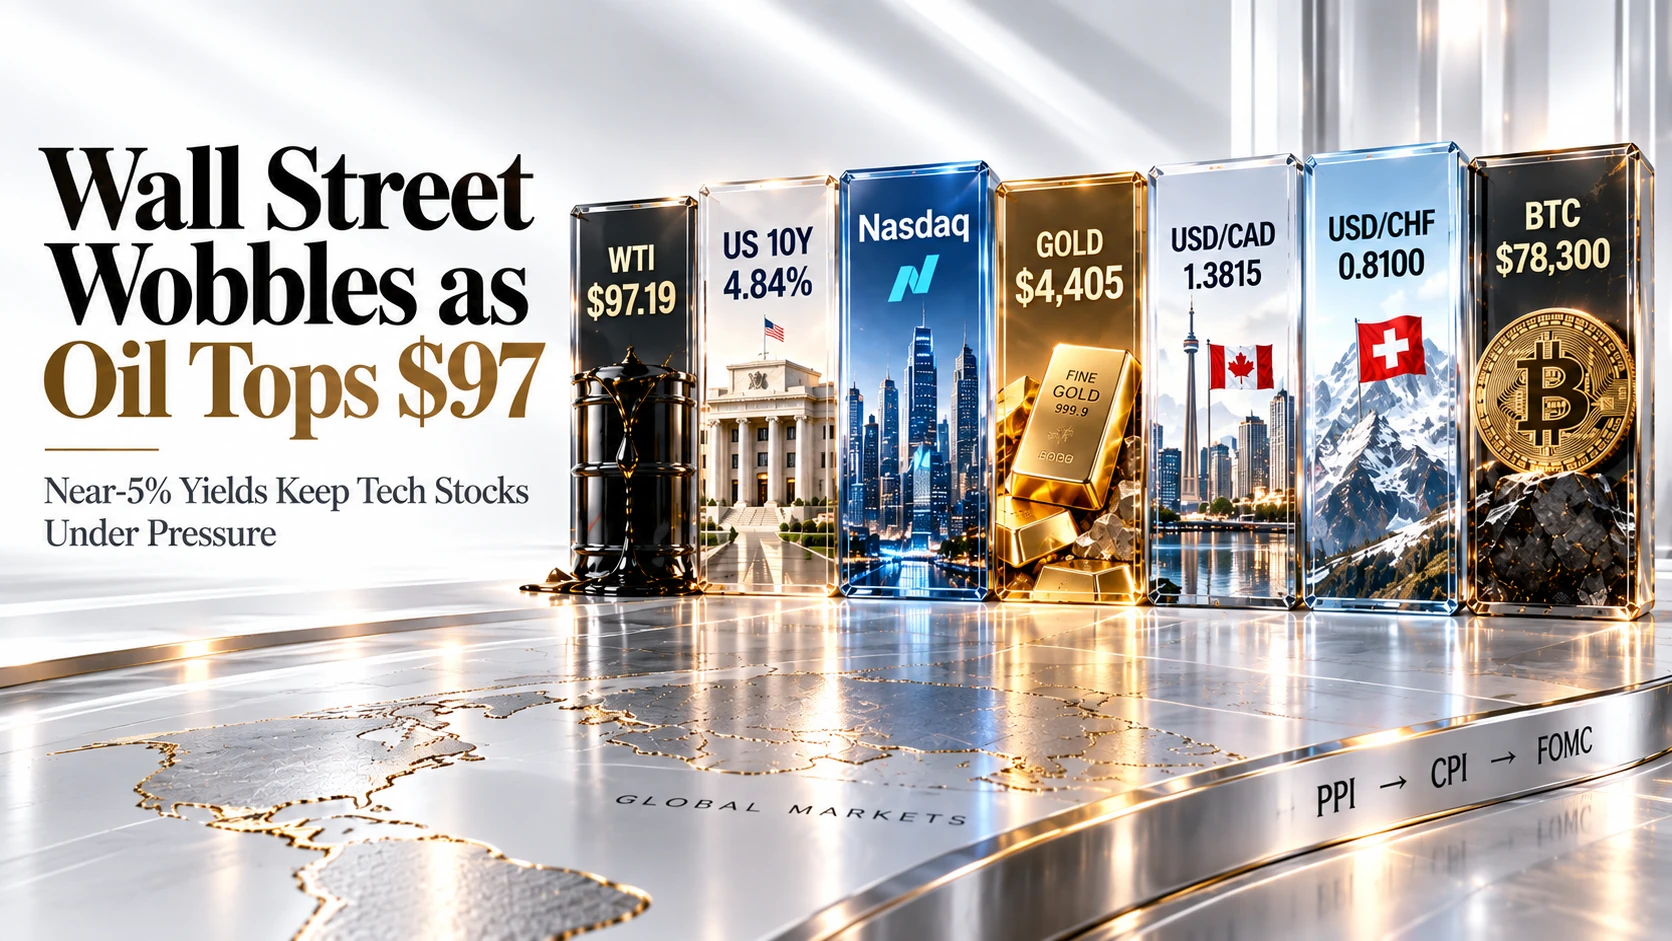
Decision week begins: WTI crude tops $97 and the 10-year Treasury yield sits near a three-year high of 4.84% as Wall Street braces for today’s PPI report and next week’s Fed meeting, with Nasdaq 100 futures under pressure and Gold holding above $4,400.
Thursday’s U.S. session picks up where the European morning left off: an energy-driven inflation shock that is forcing markets to reprice both growth and policy risk simultaneously. WTI crude has climbed to $97.19 a barrel, up about 2.8% on the day and its highest print since May, after fresh U.S. strikes on Iranian oil tankers deepened the Strait of Hormuz standoff and Brent crude broke above $101 for the first time in four months. That has fed straight through into U.S. rates: the 10-year Treasury yield is holding at 4.84%, having touched 4.897% on Wednesday, its highest level since late 2023, as the Treasury’s tripled buyback plan and record AI-linked corporate bond issuance add to term-premium pressure even as investors weigh whether oil-driven inflation could force the Federal Reserve toward a more hawkish path at its 16-17 September meeting.
Equities are feeling the squeeze most directly: Nasdaq 100 futures are down near 29,410 after Wednesday’s close of 29,538.75, as stocks retreat on fears that $100 oil and near-5% long yields could together choke off the AI-capex-driven rally that has carried the index for most of 2026. Gold is bucking the risk-off tone, holding above $4,400 an ounce as safe-haven demand and inflation-hedge buying offset the drag of higher real yields, while in FX, USD/CAD is rangebound near 1.3815 — the Loonie’s usual oil-linked support is being offset by broad Dollar demand tied to the yield spike — and USD/CHF is firm around 0.8100 for the same reason. Crypto is the session’s relative safe corner: Bitcoin is consolidating near $78,300 and XRP is holding just under $1.40, both look past today’s noise toward the Producer Price Index at 8:30 a.m. ET and Friday’s CPI report, the final inflation inputs before next week’s Fed decision.
U.S. Session Economic Calendar — 10 September 2026
Key releases and events shaping price action through the rest of the day
| Time | Event | Forecast / Detail | Impact | Market Read |
|---|---|---|---|---|
| 🇺🇸8:30 AM ET Today | U.S. August Producer Price Index (PPI) | Final major inflation clue before Friday’s CPI and the Fed’s 16-17 September meeting | 🔴 CRITICAL | The single biggest scheduled driver of Dollar, Treasury and Nasdaq volatility today |
| 🇺🇸8:30 AM ET Today | Initial Jobless Claims | Labor-market read watched closely for early signs of an oil-driven growth slowdown | 🟢 MEDIUM | A soft print would add to two-way risk around the PPI reaction |
| 🇺🇸Ongoing (Middle East) | WTI Crude Tops $97 as US-Iran Conflict Intensifies | WTI near $97.19, Brent above $101; Strait of Hormuz shipping risk remains elevated | 🔴 CRITICAL | Driving the broader stagflation narrative pressuring Nasdaq futures and lifting Gold |
| 🇺🇸Ongoing | 10-Year Treasury Yield Near Three-Year High | 10Y near 4.84% after touching 4.897% Wednesday, highest since late 2023 | 🔴 CRITICAL | Reflects mounting fiscal and inflation risk premium weighing on equity valuations |
| 🇺🇸Ongoing | Treasury Debt Buyback & Heavy Corporate Issuance | Treasury tripled its buyback to $6bn; record AI-linked corporate bond supply this week | 🟢 MEDIUM | Adding term-premium pressure that is keeping long-end yields elevated |
| 🇺🇸16-17 September | Federal Reserve FOMC Meeting | Markets weighing whether oil-driven inflation risk tilts the Fed hawkish | 🔴 CRITICAL | The decisive medium-term driver for Nasdaq 100, Gold, BTC and Treasury-yield direction |
| 🇺🇸Friday, 11 September | US August CPI Report & UMich Sentiment (Prelim) | Core CPI seen around +0.2-0.3% m/m; consumer inflation expectations also in focus | 🔴 CRITICAL | The final decisive input for Fed policy expectations into the 16-17 September FOMC meeting |
U.S. Session Trade Ideas — USD/CAD, Gold, Nasdaq 100, BTC/USD and More
Technical setups and fundamental context across the session’s eight key instruments
USD/CAD
Why This Setup
The pair is caught between two opposing forces: crude near $97 should normally be a tailwind for the oil-linked Loonie, but the surge in Treasury yields toward a three-year high is keeping broad Dollar demand firm enough to cap CAD strength. A hot PPI print or a hawkish Fed repricing would be the main source of upside follow-through, while a sudden de-escalation in the Strait of Hormuz standoff that sends oil sharply lower is the clearest source of two-way risk.

USD/CHF
Why This Setup
USD/CHF is holding firm even though the Swiss franc typically attracts haven flows during geopolitical stress, as the sheer scale of the Treasury-yield move is pulling in broad Dollar demand that outweighs the CHF bid. A hot PPI print would reinforce the move toward the 0.8180 zone, while a sharp risk-off shock tied to fresh Strait of Hormuz headlines is the main source of two-way risk that could see haven flows overwhelm the yield story.

Gold (XAU/USD)
Why This Setup
Gold is holding above $4,400 as safe-haven flows tied to the Iran conflict and inflation-hedge demand from $97 oil are offsetting the drag from a near three-year-high 10-year yield. A hot PPI or CPI print that forces a hawkish Fed repricing, lifting real yields further, is the main source of two-way risk that could stall the move toward $4,520.

Crude Oil (WTI)
Why This Setup
WTI’s push to its highest level since May is being driven by an intensifying US-Iran conflict, with Iran vowing to resist the US naval blockade and warning of further escalation. Ongoing Strait of Hormuz shipping risk is the genuine tailwind here, though a confirmed de-escalation or safe-passage arrangement for tankers is a real source of two-way risk that could trigger a sharp pullback.

Nasdaq 100
Why This Setup
Futures are under pressure as $97 oil and a near three-year-high 10-year yield combine to threaten the valuation backdrop that has powered the AI-capex-driven rally through 2026. A soft PPI print or a dovish signal ahead of next week’s Fed meeting is a real source of two-way risk that could spark a sharp relief rally back toward 29,700 and beyond.

US 10Y Treasury Yield
Why This Setup
Yields are consolidating just below Wednesday’s near three-year high as fiscal deficits, a tripled Treasury buyback and record AI-linked corporate bond issuance keep upward pressure on the long end, compounded by oil-driven inflation risk. A soft PPI or CPI print, or a flight-to-quality bid tied to a Strait of Hormuz escalation, is a real source of two-way risk that could pull yields back toward 4.65%.

BTC/USD
Why This Setup
Bitcoin is holding a tight range as spot ETF flows stay resilient even while equities wobble on the oil and yield story, a sign that crypto demand has partly decoupled from the risk-off mood in Nasdaq futures. A hot PPI or CPI print that revives hawkish Fed odds is the main source of two-way risk that could pressure BTC back toward $74,500, while continued institutional accumulation supports the case for a push back toward $82,000.

XRP/USD
Why This Setup
XRP is consolidating just under the stubborn $1.40-$1.43 resistance zone that has capped the token for several sessions, with traders watching next week’s Fed decision alongside pending regulatory catalysts as the next potential trigger for a breakout. Continued weekly gains and fund inflows are a genuine tailwind, though crypto’s sensitivity to a broader risk-off shock around today’s PPI or tomorrow’s CPI is a real source of two-way risk.

U.S. Session Frequently Asked Questions
Quick answers to the questions traders are asking during today’s session
Why is the Nasdaq 100 falling while Gold and oil both rise?
Why is the 10-year Treasury yield near a three-year high?
What is driving crude oil above $97 today?
Why is USD/CAD not falling despite oil’s rally?
Are Bitcoin and XRP more resilient than stocks right now?
What is the single biggest risk to today’s U.S.-session trades?
U.S. Session Summary — Thursday, 10 September 2026 (Live Update)
Thursday’s U.S. session is defined by the same energy-driven inflation shock that dominated European trading, now colliding directly with U.S. rates and equities. WTI crude has climbed to $97.19 a barrel, its highest level since May, after the US-Iran conflict intensified overnight and Brent broke above $101 for the first time in four months. The 10-year Treasury yield is holding at 4.84%, just off Wednesday’s near three-year high of 4.897%, as a tripled Treasury buyback and record AI-linked corporate bond issuance compound the oil-driven inflation pressure ahead of the Federal Reserve’s 16-17 September meeting. Nasdaq 100 futures are under pressure near 29,410 after Wednesday’s close of 29,538.75, as markets weigh whether $100 oil and near-5% long yields together threaten the AI-capex-driven rally that has carried the index through 2026.
Commodities, havens and crypto are telling a different story: Gold is holding firm above $4,400 an ounce as safe-haven and inflation-hedge demand offsets pressure from higher yields, while USD/CAD near 1.3815 and USD/CHF near 0.8100 both reflect broad Dollar strength tied to the yield surge outweighing their usual drivers. Bitcoin near $78,320 and XRP just under $1.40 are both consolidating in comparatively tight ranges, suggesting crypto positioning has partly decoupled from the risk-off mood gripping equities, as traders count down to today’s 8:30 a.m. ET PPI report and Friday’s CPI release, the final inputs before next week’s Fed decision.
Highest-conviction session idea: stay nimble around the 8:30 a.m. ET PPI report, favour long Gold and long Treasury-yield (short bonds) exposure while $100 oil and fiscal pressure stay elevated, and fade Nasdaq 100 strength into rallies while yields hold near three-year highs, while staying alert to fast-moving Strait of Hormuz headlines that could reverse the oil-linked and risk-sensitive positions within minutes once fresh developments land.
For the individual instruments: USD/CAD buy dips toward 1.3760, stop 1.3700, target 1.3900 — broad Dollar demand tied to the yield surge is a genuine tailwind, though a sudden Strait of Hormuz de-escalation that sends oil sharply lower is a real source of two-way risk. USD/CHF buy dips toward 0.8050, stop 0.7990, target 0.8180 — yield-driven Dollar strength is a genuine tailwind, though a sharp risk-off shock reviving the CHF’s haven bid is a real source of two-way risk. Gold buy dips toward $4,340, stop $4,260, target $4,520 — oil-driven inflation-hedge demand is a genuine tailwind, though a hawkish PPI or CPI surprise lifting real yields is a real source of two-way risk. Crude Oil buy dips toward $94.00, stop $91.00, target $101.00 — ongoing Strait of Hormuz tensions are a genuine tailwind, though a confirmed shipping safe-passage arrangement is a real source of two-way risk. Nasdaq 100 sell rallies toward 29,700, stop 30,000, target 28,900 — near three-year-high yields and $97 oil are a genuine tailwind for the downside case, though a soft PPI print is a real source of two-way risk. US 10Y yield buy dips (sell bonds) toward 4.78%, stop 4.65%, target 5.00% — fiscal pressure and oil-driven inflation risk are a genuine tailwind, though a risk-off flight to quality is a real source of two-way risk. BTC/USD buy dips toward $77,000, stop $74,500, target $82,000 — resilient spot ETF inflows are a genuine tailwind, though a hot PPI or CPI print reviving hawkish Fed odds is a real source of two-way risk. XRP buy dips toward $1.34, stop $1.28, target $1.52 — sustained fund inflows are a genuine tailwind, though crypto’s sensitivity to risk-off shocks around today’s data is a real source of two-way risk. The decisive variable for the rest of the day is the 8:30 a.m. ET PPI report, and every position here should be sized with the knowledge that fast-moving Strait of Hormuz headlines can also move oil-linked and risk-sensitive instruments sharply with little warning.
Ready to act on today’s setups? Open an Account with Capital Street FX and trade every instrument covered in this report on our Zero Account’s 0.0 Pips Spreads and 1:10000 Leverage, across 2000+ Instruments, with a welcome deposit bonus and 24/7 Live Support on hand for every session.
Not sure which account fits your style? Compare our Account Types side by side with our Account Comparison tool, browse current Promotions / Bonus offers, and trade from our Trading Platform suite. Funding is simple via our Deposit & Withdrawal options. For ongoing coverage, explore our Forex Analysis Pages, Commodity Analysis Pages and Crypto Analysis Pages, plus our Daily Market Analysis and Weekly Market Analysis reports and the full Economic Calendar. New to trading? Visit our Trading Education / Blog, or reach our Contact Us / Live Support team any time.
Access Live U.S. Markets →