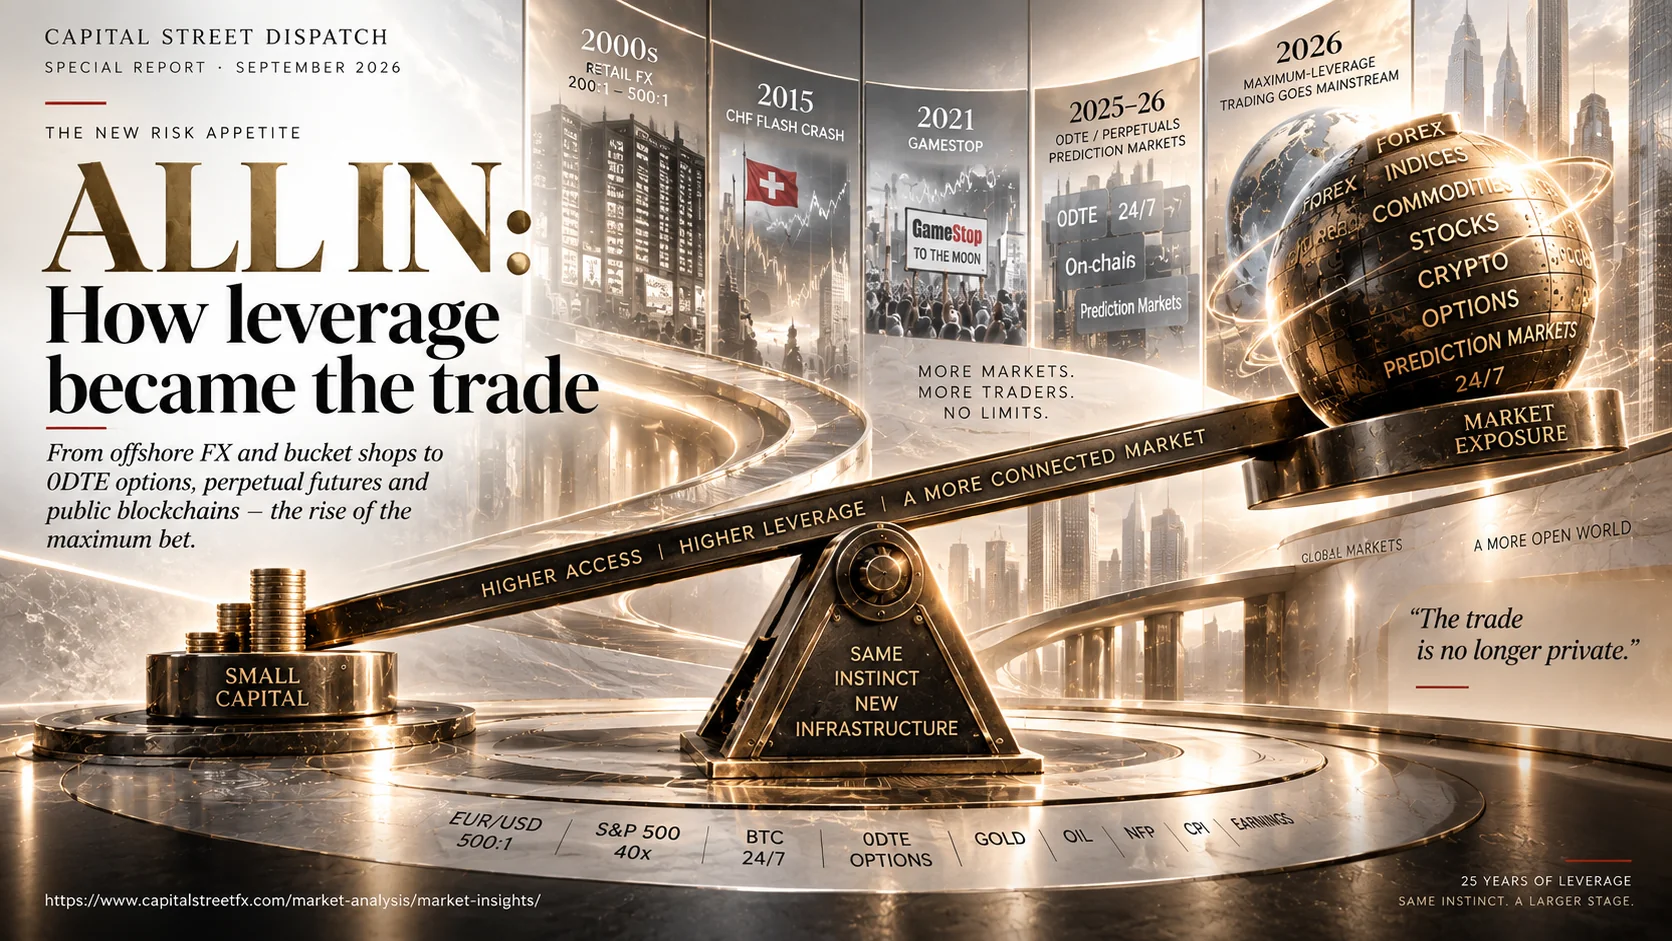
All In: How Leverage Became the Trade — Capital Street Dispatch
The New Risk Appetite
All In: How Leverage Became the Trade
The professional textbook says reduce exposure when volatility spikes. A growing population of traders is doing the opposite — increasing leverage precisely at the moments gold, oil, and the Nasdaq are moving hardest. This is the history of how that became normal, what the data says about why, and how it is likely to play out for the rest of 2026.
Capital Street Dispatch Research DeskSeptember 12, 2026Long ReadThe Contrarians · The Inversion · The Continuum · The Calendar
The New Risk Appetite
All In: How Leverage Became the Trade
The professional textbook says reduce exposure when volatility spikes. A growing population of traders is doing the opposite — increasing leverage precisely at the moments gold, oil, and the Nasdaq are moving hardest. This is the history of how that became normal, what the data says about why, and how it is likely to play out for the rest of 2026.
Capital Street Dispatch Research Desk
September 12, 2026
Long Read · ~10,000 words
The Contrarians · The Inversion · The Continuum · The Calendar
On July 31, 2026, a trader named James Wynn was running a fifty-times-leveraged short against the S&P 500 on Hyperliquid, a derivatives exchange that settles on a public blockchain and never closes. The index moved four points against him. He was liquidated for roughly $300,000, and his account — which had carried a live seven-figure position an hour earlier — fell to about $12,000. It was somewhere past his two-hundredth liquidation on the same public account. Every position he holds is visible in real time to anyone who wants to look, and thousands of people do.
What makes Wynn worth opening with is not that he lost. It is that he is doing, in public and at extreme size, exactly what a rapidly growing population of traders is doing in smaller and quieter versions across four separate markets: increasing leverage and concentrating risk at the specific moments — a Fed decision, a war headline, an earnings release — when professional risk management says you should be doing the opposite. Every trading desk manual written in the last fifty years has said some version of the same thing: reduce exposure ahead of a known volatility event, size your position to survive being wrong, diversify instead of concentrating. A large and growing number of retail traders have inverted that rule on purpose. Not by accident. Not out of ignorance of the textbook. By deliberate choice, at increasing scale, on every continent where a phone can connect to an exchange.
This piece is about how that inversion became normal — and why calling it new is the first mistake anyone makes about it. The instinct to bet maximum size at the moment of maximum uncertainty is as old as organised markets. What has changed, over a continuous arc running from the bucket shops of 1900 through the kerb traders of the 1930s, the pink-sheet speculators of the postwar decades, the day-trading rooms of the late-1990s internet boom, the offshore FX platforms of the 2000s, and the 0DTE desks and Hyperliquid accounts of today, is not the impulse. It is the infrastructure available to serve it, the number of people who can now access it, and the degree to which it has moved from the fringes of financial culture — where it was always frowned upon, always present, always producing its outlier fortunes and its spectacular wrecks — into something that now looks, with twenty-five million retail participants across these instruments, like a movement in its own right.
The question this piece does not resolve — because the data does not yet resolve it — is whether that movement has found a genuine, persistent mispricing in how markets charge for tail risk, or whether it is the latest generation to discover, at greater speed and lower cost than any before it, that the most exciting way to participate in a market is also the most reliably expensive one.
I. The Contrarians — A Century of Betting Against the Rulebook
The rails that were always being built
Online retail FX trading began in 1996. The leverage on offer from day one was already extreme by any other market’s standard — this was not a slow creep from conservative beginnings. What follows corrects the common assumption that high-leverage retail trading is a recent phenomenon, or that 200:1 to 500:1 represents the ceiling of what has been on offer.
1996. The first online retail FX platforms launch. US regulation does not meaningfully exist yet — the NFA does not move to police unregistered FX brokers until 2003, leaving the first seven years of the industry in a near-regulatory vacuum. Mainstream US brokers are already at 400:1. Not 50:1, which most people retrospectively assume was always the rule. Four hundred to one, at legitimate, large, US-registered brokerages.
May 2009. The CFTC makes its first cut, reducing the maximum leverage US brokers can offer from 400:1 to 100:1, in the aftermath of the financial crisis.
October 18, 2010. The CFTC’s Dodd-Frank implementing rule cuts US retail FX leverage again — to 50:1 on major pairs and 20:1 on minors, down from a proposed 10:1 after sustained broker lobbying. This is the moment demand visibly shifts toward brokers in jurisdictions that continue offering the ratios the US has moved away from. Seychelles, Vanuatu, and Belize become the registration addresses of choice for brokers serving that demand. The pattern that Dodd-Frank starts in 2010, ESMA will accelerate eight years later.
2018. ESMA caps retail leverage in the EU and UK at 30:1 on major FX pairs, 2:1 on crypto. Brokers and clients move further toward non-EU jurisdictions rather than delever — accelerating the same pattern Dodd-Frank started eight years earlier.
2020–2022. CBOE completes the rollout of daily SPX options expirations, adding Tuesday and Thursday to the existing Monday/Wednesday/Friday cycle. Zero-day options — contracts that expire the same day they are traded — stop being a niche professional tool and become a daily retail product.
2026. Brokers in non-EU/UK jurisdictions now routinely advertise leverage of 1,000:1 to 2,000:1; at least one major broker offers an account tier with no stated leverage cap at all — broadly consistent with what mainstream US brokers were offering before 2009. Zero-day options account for roughly half of all retail options volume and close to two-thirds of SPY and QQQ volume specifically. US margin debt hits a record $1.53 trillion.
The behaviour that financial commentators began describing as new and alarming in 2025 and 2026 — maximum leverage into scheduled catalysts, weekend positions on always-open venues, size concentrated around data releases — was the operating model of the retail FX industry from its first year of existence. The traders running NFP plays on EUR/USD at 200:1 through a Limassol-registered broker in 2008 were doing, structurally and intellectually, exactly what traders were doing on Hyperliquid in 2025. The instruments differed. The assets differed. The execution was slower. The leverage was, in many cases, higher.
In the United Kingdom, the same impulse found a legally distinct but economically identical home: spread betting. Classified as gambling under UK law — exempt from capital gains tax and for many years subject to lighter regulation — spread betting on financial markets let a trader place a £10-per-point bet on the FTSE 100 without the transaction ever being classified as an investment. By the mid-2000s, IG, CMC Markets, and City Index were serving hundreds of thousands of UK retail clients on platforms built explicitly around short-duration, catalyst-driven, leveraged speculation.
From the kerb to the blockchain — the continuous arc
The connection between Jesse Livermore’s bucket shops and James Wynn’s Hyperliquid account is not metaphorical. It is structural, and it runs through every decade in between. After the 1929 crash discredited the most visible practitioners of maximum leverage, the impulse did not disappear. It moved to the margins the establishment created for it. Kerb trading — named for the literal kerb outside the New York Stock Exchange, where brokers who could not get floor access conducted their own business — survived through the 1930s as an explicitly unofficial market for stocks and instruments the main exchanges considered too speculative to list. Its successor, the pink sheets, served the same function through the postwar decades: a venue for securities that had no home in the respectable financial system, traded by people the respectable financial system preferred not to see. The leverage was informal, often provided by the broker himself, and the regulatory oversight was minimal by design.
The day-trading rooms of the late 1990s were the first time this impulse became briefly visible at scale. When online brokers like E*Trade and Ameritrade made individual stock trading accessible in near-real time, a generation of traders discovered what institutional desks had always known: that short-duration directional bets in a trending market could produce returns that made long-term investing look slow. At the peak of the dot-com boom, day-trading offices operated in strip malls across the United States, filled with people running maximum leverage on technology stocks using Level II quotes and momentum signals. The financial press alternated between breathless profiles of the winners and warnings about the losers. When the Nasdaq fell 78% from its 2000 peak, the warnings dominated, the PDT rule arrived in 2001 to suppress the practice, and the impulse retreated again — this time to a new home that was being quietly assembled offshore.
The ESMA outcome data — 74% to 89% of retail CFD accounts lose money, with average losses per client ranging from €1,600 to €29,000, stable across eight years and 49 regulated brokers — covers only brokers subject to the disclosure requirement. The population trading through brokers in jurisdictions that maintain the leverage ratios the US and EU have moved away from does not appear in that dataset. The figures measure a subset of the market. The market is larger.
of retail CFD accounts lose money — 2026 figure across 49 regulated brokers, stable since 2018
2,000:1
leverage now advertised by major offshore FX/CFD brokers in 2026 — at least one with no stated cap at all
$1.53T
US margin debt, June 2026 — record high, up 51.5% year-over-year. At 3–5% near-threshold, implies $46–77B in plausible forced selling on a 2% adverse move
What each crisis taught — and what the textbook said the lesson should be
The crowd did not arrive at maximum-leverage catalyst trading through theory. It arrived through experience — specifically, through a series of market episodes that each taught a lesson that ran directly counter to what the textbooks said the lesson should be.
2016
Brexit and the GBP flash crashes — two lessons in gap risk
On June 24, 2016, the UK voted to leave the European Union. Markets had positioned overwhelmingly for a Remain result. GBP/USD fell roughly 11% in hours — one of the largest single-day moves ever recorded in a G10 currency. Then, on October 7, 2016, a second flash crash: GBP dropped 6–10% in minutes during thin Asian-session liquidity, triggered by an algorithmic reaction to a stray comment from the French president. Combined client losses at UK spread-betting firms ran into the tens of millions. The October crash is the more instructive of the two: it was not driven by a scheduled event or a major policy decision. It was driven by thin liquidity at 1 AM London time, an automated order flow amplification loop, and a comment that would barely have moved markets in normal hours. Both events destroyed accounts sized for a calmer outcome. The lesson they added to the growing body of collective retail experience: if the market can move 10% in minutes during thin hours, and if platforms are open 24 hours, then the overnight gap is both the greatest risk and — if you are positioned correctly — the greatest opportunity in the instrument.
2020
Syed Shah and negative oil — when the software couldn’t keep up with the market
On April 20, 2020, WTI crude futures settled at negative $37.63 a barrel — the first negative price in the contract’s history. The mechanics: expiring May contracts had more sellers than buyers as storage filled, and the price discovery mechanism did its job. What it revealed about retail infrastructure was something else entirely. Syed Shah, a Toronto day trader who began the session with $77,000, bought 212 WTI contracts at what his brokerage’s interface showed as one cent per barrel. His broker’s software could not display negative prices. The actual settlement meant Shah had purchased contracts at what amounted to a deeply negative price. He was later told he owed $9 million. Interactive Brokers ultimately paid $103 million to compensate clients affected by the system failure, and accepted a $1.75 million CFTC penalty for failing to prevent negative account balances it was technically required to block. The mechanism here is the same one that broke brokers in the SNB crash five years earlier: in a sufficiently extreme market dislocation, the retail trader’s practical downside turned out to be softer than the number on the statement, because the broker absorbed losses the system had failed to stop. That pattern — not a guarantee, but a real, documented tendency — became embedded in how a generation of retail traders calculated the true asymmetry of maximum-leverage positions.
2021
GameStop and the barbell made visible
Keith Gill began buying GameStop options in 2019 when the stock was below $5. He shared every update on Reddit, under the name DeepFuckingValue, for over a year before anyone paid serious attention. His thesis was fundamental: the company had real cash, loyal customers, and a short position so large it was structurally fragile. When the squeeze began in January 2021, his position — built largely in cheap, near-expiry call options — turned a $53,000 stake into tens of millions. At one point he lost $13 million in a single day and posted about it without visible distress. The crowd watching him drew the lesson that a small premium, a high-conviction thesis, and the willingness to hold through adversity could produce returns in weeks that a career of conservative accumulation could not approach. Gill himself returned in June 2024 after three years of silence, disclosed a $116 million position in a single Reddit screenshot, and GameStop surged 80% the following morning. He briefly became a paper billionaire. What the episode demonstrated — whatever one makes of the specific case — was that the asymmetric payoff structure of cheap, short-dated options used against a known structural vulnerability was not merely theoretical. It had produced one of the most spectacular publicly documented returns in the history of individual trading.
2022
Roger Ver — when the position is large enough that the counterparty ends up exposed
Bitcoin’s earliest and most prominent public promoter, Roger Ver, becomes the subject of separate, disputed claims from the exchange CoinFLEX and a Genesis lending subsidiary, each alleging tens of millions of dollars in unpaid debt from positions that moved against him. Ver denies owing anything and has countersued both parties. The specific facts remain contested in litigation. What the shape of the dispute illustrates — whatever a court eventually decides — is a mechanism that runs under the entire leverage story: a position large enough that when it moves against the trader, the counterparty rather than the trader ends up holding the exposure. The broker who cannot collect the debit balance writes it off. The exchange that cannot recover absorbs the loss and raises it in court. The difference between “limited liability in practice” and “someone else absorbing the loss” is a question of accounting entry, not economic substance. This mechanism — visible in the SNB crash broker writeoffs, in the Interactive Brokers negative-oil settlement, and here — is one of the structural reasons that the true downside of maximum-leverage trading is softer in practice than the number on the statement suggests, and one of the reasons the demand for that structure persists.
Oct 2025
Hyperliquid wipes out 56% of open interest in a single day
On October 10, 2025, a sharp crypto selloff erased 56% of Hyperliquid’s total open interest in a single session — from $14.7 billion to $6.5 billion. It was the largest single-day deleveraging event in the platform’s history. The cascade followed a familiar pattern: concentrated leveraged positions on one side of the market triggered forced liquidations, which moved prices, which triggered further liquidations, which moved prices further. The event produced no systemic failure — Hyperliquid’s vault absorbed the liquidations, positions closed, the platform continued operating. But the episode was a preview of the speed at which a concentrated, publicly visible, on-chain leveraged book can unwind. By September 2026, Hyperliquid’s open interest had recovered to $14.3 billion — essentially back to pre-crash levels, and still growing.
Jan 2026
Silver — a 26% single-session crash that no model had priced
On January 29, 2026, silver hit an all-time high of $121.88 an ounce. The following session, January 30, it crashed 26% in a single day following a surprise Federal Reserve Chair nomination — one of the largest single-session moves ever recorded in a major precious metal. A second drop of roughly 20% followed within the week before silver bottomed near $75 and staged a 17% two-day recovery rally. The episode illustrated, with unusual clarity, that extreme single-session moves in assets traditionally regarded as stable enough to hold through volatility events were no longer exceptional. Silver had delivered a move larger than most individual equities experience in a year, on a headline event, in hours. For the leverage-maxxing community already positioned in gold, oil, and crypto for the volatility that had been building since 2025, the silver crash was both a warning and a data point: the range of outcomes in any catalyst-rich environment was wider than any historical volatility model was pricing.
Feb–Sept 2026
The Iran war — the first real-time stress test of the new infrastructure
The conflict that began on February 28, 2026, was not the first Middle East crisis to move markets. What made it different was the infrastructure that met it. By February 2026, Hyperliquid was processing $150–245 billion in monthly perpetual futures volume. 0DTE options accounted for 65% of SPX retail options volume. The PDT rule had been repealed eight months earlier. Prediction markets were processing $24–45 billion a month.
The numbers that followed were among the sharpest in years across every major asset class. On February 27 — the day before the war began — WTI stood at $67.02 a barrel and Brent at $72.48. By March 9, both benchmarks had spiked 18–20% in a single reading to above $109, a nearly 60% rally over the prior thirty days. Oil then whipsawed for months: a roughly 15% single-day drop in early April was followed within hours by a spike back above $97 when Iran closed the Strait of Hormuz; by mid-July, renewed strikes drove Brent and WTI up more than 13% in a single week, as confirmed tanker traffic through Hormuz — a route carrying close to a fifth of the world’s seaborne crude — fell 62%. Single sessions moving 3–5% became routine; single weeks moving over 13% happened more than once.
Gold’s context is a multi-year rally — from around $1,650 an ounce in November 2022 to a record $5,595–5,600 in early 2026 — that turned sharply volatile once the war began. The metal briefly topped $5,300–5,400 an ounce in early March on safe-haven buying, then fell more than 15% from that peak by late March as inflation fears and rate expectations pulled in the opposite direction, with individual sessions moving 2–4% in either direction on single headlines throughout the spring.
The Nasdaq 100 entered a technical correction in late March 2026 — down more than 11% from its October 2025 record close, its first correction since the 2025 tariff shock — with Microsoft falling 34% from its peak, Meta 29%, Nvidia 18%. Within months, the same index staged one of its sharpest reversals on record: a 20% rebound off the wartime low, comparable to the Nikkei 225’s 29% bounce over the same window. An index moving from an 11% correction to a 20% rebound inside a single geopolitical event is itself a case study in exactly the kind of catalyst-driven, high-amplitude environment that rewards and punishes maximum leverage fastest.
Retail participation in 0DTE and leveraged perps grew through this volatility rather than pulling back. Cboe’s own research found that when SPX intraday volatility spiked to levels not seen since the 2008 financial crisis in April 2025, retail’s share of 0DTE trading actually fell — from 57% to 47% — before climbing back to 60% within weeks once the shock passed. That’s worth sitting with: retail 0DTE traders don’t simply pile in blindly during chaos; a meaningful share steps back when volatility gets disorderly, then returns once it settles into a more tradeable pattern. By 2026, retail accounts for more than half of roughly $1 trillion in daily notional flow across the 0DTE product, with small retail-sized trades at 20% of SPX 0DTE volume on their own — double the 2021 level. The always-open, maximum-leverage, catalyst-concentrated trade had become, for a significant and growing community, not a reaction to extreme conditions but an expectation of them.
Five doors that opened in sequence
The Iran war volatility did not create this trading culture. It revealed it — because the infrastructure that met it had been assembled piece by piece over the preceding decade, each piece individually incremental, together a step-change in what a retail trader with a phone and a few thousand dollars could actually do.
The Pattern Day Trader rule, which since 2001 had required a minimum $25,000 account balance before a trader could make more than three day trades in five business days in the United States, was repealed on June 4, 2026. The rule had been written directly in response to the leveraged blowups of the dot-com bust. Its removal — approved by the SEC on April 14, 2026 — opened day trading to anyone regardless of account size, replacing it with a broker-administered intraday margin framework. A $2,000 margin minimum remains through October 2027 full implementation, but the $25,000 capital wall is gone. A trader with $2,000 can now day-trade as freely as one with $500,000.
Zero-days-to-expiry options on the S&P 500 grew from approximately 5% of SPX options volume in 2020 to close to two-thirds of SPY and QQQ volume specifically by 2026 — with industry-wide options volume up 34% year-over-year to 67.2 million contracts a day. The April 2024 notional value of 0DTE contracts tied to the S&P 500 alone reached $862 billion in a single month. One structural fact about this market cuts directly against the purely reckless narrative: Cboe’s own data shows more than 95% of 0DTE trades are executed in a limited-risk format — long options outright, or defined-risk spreads — where the maximum possible loss is fixed at entry. Only about 4% of SPX 0DTE volume is naked short options, the format with genuinely unbounded downside. Most of the people doing this are choosing the version of the instrument that caps their loss, not the version that could take more than they put in.
Combined volume on Kalshi and Polymarket, the two dominant prediction markets, rose from under $5 billion a month in September 2025 to between $24 and $45 billion a month by mid-2026 — several multiples of the total monthly handle of every legal US sportsbook combined. Hyperliquid, the decentralised perpetuals exchange, carries $14.3 billion in open interest as of September 8, 2026, and processes the order-of-magnitude equivalent of a mid-tier institutional derivatives desk, in a market that never closes, with positions visible publicly on-chain. US margin debt has reached $1.53 trillion — a record, up 51.5% year-over-year.
And then there is the parallel ecosystem that rarely appears in mainstream coverage of this story: the funded trader industry. Approximately 2.1 million traders worldwide now participate in prop-trading programmes — firms that offer access to firm capital after a paid evaluation challenge, removing the capital-requirement friction that had historically gated institutional-style trading. The CFTC’s 2023 action against MyForexFunds became this industry’s own SNB moment, concentrating licensing toward Singapore, the UAE, and Curaçao. Only 7% of prop-trading challenge buyers ever receive a funded payout — the evaluation model is itself a revenue business, not primarily a talent-scouting operation. But those 2.1 million active participants represent a population for whom the capital-requirement problem has been partially solved: they can access leverage on sizable accounts without the account equity to back it personally. This is leverage maxxing with someone else’s capital on the line, and it has grown faster than any of the other instruments described above.
Underneath all of it, zero-commission trading, real-time data on every phone, and app interfaces explicitly borrowed from game design — streaks, badges, leaderboards, celebratory animation on a filled order — have been shown in peer-reviewed behavioural finance research to correlate directly with higher trading frequency, shorter holding periods, and heavier leverage use among the retail investors exposed to them. This is a designed input, not a side effect.
The binary bet — when the catalyst becomes a question with one answer
Kalshi and Polymarket both let a trader buy a contract that pays $1 if a specific, single event resolves one way and nothing if it does not — a Fed rate decision, a CPI print, an earnings beat. What is notable is how far the category has already drifted from macro catalysts into genuinely exotic single-event outcomes: single-game NBA and NFL markets, named-candidate mayoral races, PGA tournament outright winners, weather and climate contracts, and pop-culture questions with no economic content at all. The mechanism is identical whether the underlying event is a Fed decision or a golf tournament — a binary, short-duration, all-or-nothing bet on one outcome, priced directly by the order book rather than a bookmaker’s line.
This is where the departure from classical risk management is most structurally visible, because there is no diversification available inside the bet itself. A single-event contract has exactly one resolution and one payout, by design. There is no partial win, no scaling out, no adjusting the position as new information arrives. It resolves once, completely, on a schedule the trader did not set. Combined with app interfaces that mirror sports betting and consumer trading apps down to the streak counters and celebratory animations on a win, the category has taken the leverage-maxxing instinct and stripped out even the pretence of continuous price exposure.
The result is that the retail trader in 2026 increasingly has a menu of instruments — FX and CFD at up to 2,000:1, crypto perpetuals at 40–50x, 0DTE options with fixed premiums, prediction-market contracts at binary resolution — that all reward the identical behaviour regardless of the underlying market: maximum conviction, minimum duration, total resolution. The instrument differs. The instinct is the same one that has been present since the first online FX platform launched in 1996.
II. The Inversion — Is This Intelligent or Is This the Same Mistake?
There is a genuine intellectual argument to be had here, and it does not resolve cleanly in either direction. The conventional financial media has largely treated the phenomenon as self-evidently reckless and reached for the 71% loss figure as though it closed the case. It does not. Because the 71% figure is an average across a population, and populations are not strategies. The question is not whether most people who attempt maximum-leverage catalyst trading lose money. Most people who attempt most things in finance lose money. The question is whether there exists a coherent, learnable version of this approach that produces positive expected value when sized and executed correctly — and whether the crowd now attempting it has absorbed that version or a caricature of it.
The case for the strategy
The strongest intellectual foundation for maximum-leverage catalyst trading comes not from the trading community itself but from two mathematical traditions that run in parallel through the academic literature of the last sixty years, and which have never fully displaced the Markowitz orthodoxy they were critiquing.
The first is Nassim Taleb’s formalisation of Benoit Mandelbrot’s observation that financial market returns are not normally distributed. They have fat tails — extreme events happen far more often than a bell curve predicts. If extreme events are systematically underpriced by the market’s standard models, then there is a coherent portfolio strategy built on that observation: hold the overwhelming majority of capital in extremely safe instruments, and allocate a small, fixed fraction to positions with capped, known downside and theoretically unlimited upside if the rare event arrives. Taleb called this the barbell strategy. Its logic is uncomfortably close to what a hard-out-of-the-money 0DTE option or a small margin deposit on a leveraged perpetual actually is: a position whose maximum loss is fixed and small, purchased specifically because the payoff, if the catalyst moves as expected, is disproportionate. Whether today’s retail traders arrived at this structure through Taleb’s arguments or simply rediscovered it by trial and error is an open question. But the structure has serious intellectual pedigree — it did not spring from nowhere.
The second tradition is the observation about limited liability. The specific failure mode that built 20th-century risk orthodoxy — unlimited, recourse-backed loss — is not always the failure mode these newer instruments carry. A 0DTE option loses its premium and nothing more. Many leveraged crypto derivatives platforms operate on isolated margin, meaning a losing position can only consume the collateral assigned to it. And there is a real, documented track record of retail traders facing limited practical liability even where it is not guaranteed in theory. When WTI crude traded below zero in April 2020, Interactive Brokers’ systems were not built to display or margin negative prices. The firm ultimately absorbed roughly $104 million in client losses rather than collect debit balances its own software had failed to prevent. That was an extreme case, but it is one point on a spectrum: the practical difficulty and cost of a broker pursuing a retail account for a shortfall is often higher than simply writing it off. None of this makes leverage safe. It means the specific failure mode the old rulebook was built around is not always the failure mode now in play.
There is also the probabilistic argument, and it runs parallel to something venture capital has operated on for decades. A venture fund does not expect most of its portfolio companies to succeed. It expects a small number of enormous outcomes to cover a much larger number of total losses, and it prices this in from the outset — funding what looks, in the moment, like hype rather than a proven business, specifically because the payoff structure only requires being right rarely, not often. A retail trader buying a cheap, far-out-of-the-money option or a small leveraged position ahead of a high-impact catalyst is, structurally, running a miniature version of the same portfolio math — provided the position is sized so that being wrong repeatedly doesn’t matter, and being right once does.
The case against
The counter-argument begins not with morality but with mathematics. Capped loss per trade is not the same thing as capped loss to a portfolio. The entire arc of 20th-century risk management disasters — Kelly violations at LTCM, short-volatility crowding at Volmageddon, mortgage correlation failures in 2008 — is a study in what happens when a large number of individually well-defined bets are taken too frequently, sized too aggressively, or correlated with each other in ways their owner didn’t notice until it mattered. A trader who loses the full premium on ten consecutive 0DTE positions has the same account-ruin curve regardless of how “defined” each individual loss was. The barbell only works if the safe side is actually safe and the risky side is actually small.
The instruments are also, on average, not mispriced in the buyer’s favour. An option purchased just ahead of a known catalyst is priced with elevated implied volatility precisely because the market already knows the catalyst is coming. Buying it is buying insurance at a premium that already reflects the storm. Academic work using transaction-level SPX 0DTE data has found retail flow clustered in short-premium structures at fixed times of day — a pattern that reads not as a fresh thesis formed for each individual bet but as systematised, habitual trading at times when implied volatility is highest and the buyer’s edge, if any, is most diluted.
And then there is the historical parallel. Bucket shops at the turn of the twentieth century sold exactly this kind of cheap, short-duration, leveraged exposure to a public that mostly lost. Jesse Livermore, the era’s most famous speculator, made $100 million shorting the 1929 crash and was bankrupt by 1934 — not because the strategy was wrong, but because the same instincts that made him genius also made him catastrophically undisciplined once the rules he had imposed on himself fell away. The details change — swaps instead of margin loans, a Hyperliquid dashboard instead of a ticker tape — but the shape, cheap access plus new instrument plus social proof plus volatility, recurs.
“The case that this is the same mistake in new packaging starts from a different observation: that capped loss per trade is not the same thing as capped loss to a trader or a portfolio.”
The central unresolved tension in leverage-maxxing as a strategyThe verdict, honestly stated, is that neither side has enough data to close the argument. The instruments genuinely are more sophisticated, more precisely defined-risk, and more theoretically defensible than the raw margin speculation that built the old rulebook. Whether the people using them, at the frequency and size the last eighteen months have shown, are applying that sophistication or simply using cheaper, faster rails to do what leveraged speculators have always done — that is a question the data available right now cannot settle either way.
III. Four Reasons. None of Them Stupid.
Given all of the above — the inversion of standard risk practice, the leverage now available, the volatility on offer this year — the honest question is not whether this behaviour is risky. It obviously is. The harder question is why a growing population is choosing it deliberately, at scale, and whether that choice is becoming more or less rational as it scales. Four explanations show up in the data and in traders’ own words. They are not mutually exclusive — a population in the millions will contain real numbers of all four types simultaneously.
It is entertainment. Gamified app design — streaks, badges, a celebration animation on a winning trade — has a growing research base linking those features directly to higher leverage use and shorter holding periods. The trade is doing the same job a slot machine or a same-game parlay does: it is the thrill being purchased, and the strategy story is applied afterward. The social amplification layer reinforces this — a trader’s peak unrealised profit gets screenshotted and circulated; the losses that follow do not circulate with the same enthusiasm. The selection-bias feedback loop recruits new participants on a picture of base rates that isn’t the real one.
It is despondency. For another share, the calculation may be less about thrill than about arithmetic that conventional saving no longer solves. If a trader concludes that the conventional path — saving a portion of ordinary income, investing it diversified, compounding slowly — cannot realistically change their financial position within a normal working life, a small, fast, high-variance bet stops looking irrational by comparison and starts looking like the only meaningful lever available. This is not a claim about any specific individual’s state of mind. It is a structural incentive that exists objectively for anyone who has run the numbers and found that the slow path doesn’t reach where they need to go.
It is the jackpot dream. A third share is chasing the specific, documented cases where it worked spectacularly: Keith Gill’s $53,000 into $300 million. A peak Hyperliquid run of tens of millions. These stories circulate far more widely than the losses that followed them, and for anyone holding a small account with limited ordinary means of building wealth, a bet that could plausibly change a career or a life in a single week has a pull that a diversified index fund, correctly, does not offer.
It may be a real, convergent strategy. The fourth explanation is the least comfortable and the hardest to dismiss. Across a population large enough, repeating a bet often enough, with losses capped at the deposit and gains structurally unbounded, the payoff asymmetry begins to resemble venture capital portfolio math — except compressed from a three-year fund cycle down to a weekly or daily one, and run not by one allocator making fifteen calculated bets but by millions of independent traders each making their own. A VC fund expects most bets to fail and a handful to return fifty to a hundred times their size; the fund’s expected return is positive because the fifty founders that fail cost only their allocated capital, while the one that succeeds returns more than all the failures combined. Leverage maxxing runs the identical structure at retail scale: hundreds of small, capped losses, and one 30x or 90x outcome leaves the underlying population’s aggregate result closer to positive than the headline 74–89% loss rate suggests — when you weight by the size of the rare win rather than simply count losing accounts. Nobody has the data yet to say whether this is true in aggregate. But the mechanism is not invented. It is the same one that makes venture capital a rational institutional strategy, running on a much faster clock, at much higher frequency, with the diversification benefit of millions of independent trials partially substituting for the portfolio diversification an individual account doesn’t have.
These four are not competing theories. A visible win gets amplified by gamification and social sharing regardless of which motive produced the original bet — which is exactly how a strategy that started as thrill-seeking for one trader and arithmetic desperation for another ends up looking, from the outside, like a single coherent spreading idea.
IV. The Continuum — From Livermore to the Public Blockchain
First node · 1877–1940 · The bucket shops to the exchange floor
Jesse Livermore: The concentrated bet at maximum conviction
Jesse Livermore started writing stock quotes on a chalkboard at fourteen and was banned from every bucket shop in Boston by nineteen — because he was winning too much, reading the tape with an accuracy the shops could not afford. He made $3 million shorting the Panic of 1907, lost it on a cotton trade, rebuilt, and in the autumn of 1929 — watching the Dow rise five-fold on loans that had ballooned to exceed the total money supply — went short the entire market. Not cautiously. At maximum conviction. The Dow fell 47% in weeks. Livermore booked $100 million, over a billion dollars in today’s terms, made by a single individual operating alone from a rented office. He was bankrupt by 1934. Dead by his own hand in 1940.
The establishment read this as a story about leverage destroying a man. Livermore’s own writing suggests something more specific: the strategy held when the discipline held. It collapsed when he abandoned the rules he had himself articulated — adding to losers, chasing tips, mistaking conviction for certainty. What makes him the first node in this continuum is not the bankruptcy but the pattern he established: an individual, working against the consensus of what was considered responsible finance, concentrating maximum capital at the moment of maximum uncertainty, and being right in a way that the diversified, cautious, institutionally endorsed approach could not match. The financial establishment frowned on it, then as now. That did not stop it from working when executed with discipline, then as now.
Second node · 2023–present · The blockchain to the public feed
James Wynn: The same impulse, broadcast live
James Wynn turned a $7,000 PEPE bet into tens of millions in 2023 and then moved to Hyperliquid, where his entire trading record lives permanently on a public blockchain. His peak: $87 million in unrealised profit, $100 million in gains over 70 days, with a 43.59% win rate across documented trades — less than half, but with wins large enough to cover all the losses and more. He has described the pattern, in public, as feeling closer to compulsion than discipline. His total liquidation count: over 200. His net all-time PnL: deeply negative. He returned after his most recent wipeout with $3,911 scraped from referral rewards, opened a 40x short, and was $415 from liquidation at the time of the last documented entry.
What makes Wynn significant is not the trading record. It is what the record’s visibility has done. Everything Jesse Livermore did was reconstructed from memoir and court filings, years after the fact. Everything Wynn does is visible as it happens, to thousands of people, which has changed the nature of the trade entirely. He is not just running a strategy. He is running a strategy in public, and the audience draws its own conclusions from the screenshots — not from the final accounting. The visible wins recruit; the full ledger does not circulate with anything like the same enthusiasm.
Disputed · 2022 · The counterparty exposed
Roger Ver: When the leveraged position leaves someone else holding the loss
Roger Ver became one of cryptocurrency’s earliest and loudest public promoters — an early Bitcoin investor who later became a prominent advocate for Bitcoin Cash. In 2022, he became the subject of separate, disputed claims from the exchange CoinFLEX and a Genesis lending subsidiary, each alleging tens of millions of dollars in unpaid debt from positions that had moved against him. Ver has denied owing anything and has countersued both parties. The specific facts remain contested in litigation.
The shape of the dispute, whatever the eventual legal outcome, illustrates a mechanism that runs quietly underneath the entire leverage-maxxing story: a position large enough that the counterparty — not just the trader — ends up exposed to the outcome. The broker who cannot collect the debit balance writes it off. The exchange that cannot recover the negative balance raises it in court. The difference between “limited liability in practice” and “someone else absorbing the loss” is a question of accounting entry, not economic substance. When leverage is large enough and the move is fast enough, the loss does not disappear — it relocates. The question of where it ends up is what the litigation and the regulatory frameworks are ultimately about.
2016 · The same edge, in a sport
Saahil Sud: The algorithm that proved the point in daily fantasy sports
In the mid-2010s, daily fantasy sports — contests where participants assemble virtual lineups of real athletes and win based on real performance — briefly became a billion-dollar industry before regulatory pressure and market concentration narrowed it to a few dominant platforms. During the peak years, a player named Saahil Sud built a predictive algorithm, entered hundreds of DFS contests a day, and was named DFS Tournament Player of the Year in 2016. Independent reporting found that approximately 1.3% of DFS players captured roughly 91% of all profits — a distribution so skewed it is indistinguishable from the participation and outcome distributions in leveraged financial markets.
Sud’s story is in this piece not because daily fantasy sports is finance, but because the identical structural dynamic — a large number of participants, maximum-bet sizing by the serious players, outcomes concentrated among a tiny fraction of the total population — emerged independently in a context entirely separate from financial markets. The mechanism that produces extreme concentration of outcomes does not require leverage, margin, or a broker. It requires only a contest with variable skill distribution, repeated many times, with bet sizing correlated to conviction. That mechanism is present in 0DTE options, in FX catalyst trades, in Hyperliquid perps, and in a fantasy sports tournament, at the same time. The common thread is not the instrument. It is the structure of the bet.
Present · Anonymous · Offshore
The trader with no on-chain record — the majority of the phenomenon
The most important character in this story has no name and no on-chain record. He or she is the trader in Dubai, Lagos, Manila, or Jakarta running 200:1 leverage on EUR/USD through a broker registered in Vanuatu or the Seychelles — a broker that appears in no regulatory dataset, discloses no loss percentages, and pursues no debit balances because the legal mechanism to do so across jurisdictions is too costly to bother with. This trader has been doing the equivalent of what Hyperliquid offers since approximately 2005. They have made and lost several accounts. They are currently profitable, or think they are. They will never appear in the ESMA statistics because the broker is beyond ESMA’s reach. They will never appear in the Hyperliquid on-chain data because they are still trading FX. They are the majority of the phenomenon — offshore, invisible, uncounted, and running, in every essential respect, the identical strategy that the new generation of crypto traders and 0DTE practitioners are running on newer, more public rails.
When regulators cap leverage at 30:1 in Europe, these traders do not stop trading. They move to a broker operating under a different jurisdiction’s framework — one that offers the leverage ratios Europe used to permit and the US used to permit before successive rule changes narrowed what regulated domestic brokers could provide. The effect of each tightening has been to shift that demand rather than reduce it. The ESMA figures cover only brokers within their reach; the population trading outside that reach is uncounted, not absent.
This trader is the direct descendant of the day-trading room operators of 1999, who were themselves the descendants of the kerb traders of the 1930s, who were themselves doing what Livermore was doing in the bucket shops before that. The instruments are different in each era. The regulatory framework in each era called the practice something slightly different — speculation, gambling, day trading, retail FX, leveraged CFDs. The financial press in each era ran the same cycle: fascination, mockery, warnings, documented casualties, eventual normalisation or suppression, and then the reappearance of the same demand through whatever new venue friction had not yet closed. The demand has never stopped. It has only moved.
V. The Movement — Three Frictions Still Dissolving
The infrastructure is not going to be walked back. The PDT repeal is law. Hyperliquid’s blockchain is live. Prediction markets have crossed the threshold from novelty to liquidity. The question of what comes next is not whether this style of trading will persist — it will — but where it goes from here, structurally and practically.
One pattern is now consistent enough across every instrument and market to be structural rather than anecdotal: the three-phase catalyst cycle. In the one to two days before a major scheduled event — an FOMC decision, an NFP release, an earnings report — open interest and options flow climb visibly as traders build directional positions from both sides. On the day itself, volume spikes, volatility expands, and the move produces either a confirmation trade or a violent reversal. In the hours after, a liquidation cascade runs through the leveraged positions on the wrong side, and the social media amplification cycle begins: the winners post screenshots, the platform logs the liquidation totals publicly, and the next round of participants is recruited. This three-phase pattern is not random. It is the behavioural signature of a community that has learned to concentrate capital around known uncertainty events — and it is becoming more predictable, not less, as the community grows.
The next wave of venues is already visible. Tokenised equity perpetuals — instruments that allow traders to take 24/7 leveraged positions on Apple, NVIDIA, or the S&P 500 itself, settled on-chain, without the constraints of exchange hours — are in early deployment on several platforms. Prediction markets are expanding beyond macroeconomic binary outcomes toward single-stock earnings calls, individual Fed governor speeches, and real-time geopolitical events. The FX and CFD industry serving the high-leverage end of retail demand continues to operate globally, with brokers in Seychelles, St Vincent, and similar jurisdictions offering leverage ratios that were standard in North America and Europe not long ago and remain in demand among traders who want that exposure.
The social layer is being engineered into the infrastructure rather than emerging organically from it. Live-streamed liquidations, copy-trading integrated directly with Hyperliquid wallet positions, prediction market probabilities displayed alongside futures prices on the same screen — these are design choices, not accidents. The feedback loop between visible wins and new entrants is being built deliberately, and the scale and speed at which social proof now propagates — a screenshot to a million followers in seconds — is genuinely without historical precedent.
There is also a regulatory divergence that has not yet stabilised. ESMA moved toward lower leverage limits and mandatory loss disclosures in 2018. The SEC’s PDT repeal in 2026 moved in the opposite direction — toward fewer capital barriers and greater access. Brokers in jurisdictions that maintained higher leverage ratios throughout this period have found themselves serving the demand that each successive restriction in major markets displaced rather than eliminated. The direction of travel in US regulation, at least as of 2026, is back toward access. Whether the EU eventually follows, and what that means for the global leverage landscape, is an open question.
The practical framework for navigating this environment — for the trader who wants to participate in catalyst-driven, defined-risk strategies without running the ruin probability that destroys most accounts — rests on four principles that the successful versions of this approach share, from Jesse Livermore to CIS to the documented cases of profitable FX traders in the CFTC’s own datasets:
Every professional risk manual written in the last fifty years says some version of the same thing: reduce exposure ahead of a known volatility event, size your position to survive being wrong, diversify instead of concentrating. A large and growing number of retail traders — running FX at 2,000:1 through offshore brokers, buying 0DTE straddles before FOMC, taking 40x perpetual positions on platforms that never close — have inverted that rule on purpose. Not by accident. Not out of ignorance of the textbook. By deliberate choice, at increasing scale, across four separate markets with four separate regulatory regimes, on every continent where a phone can connect to an exchange.
What the data can settle is that the infrastructure generating this question is permanent. The leverage venues are not going away. The 0DTE market is not going away. The offshore FX brokers have survived every regulatory intervention for twenty years by migrating to a jurisdiction with lower costs and higher leverage allowances — from 400:1 in US mainstream brokers before 2009, to 100:1, to 50:1, and then offshore to 2,000:1 with no stated cap. The prediction markets have crossed the liquidity threshold beyond which regulatory intervention would now require active political will. The funded prop trading industry has built its own parallel ecosystem serving 2.1 million traders who want institutional-size leverage without the capital to back it. None of this is reversing.
What the data cannot yet settle is whether the population running this strategy has found a genuine, persistent mispricing in how markets charge for tail risk — or whether it is the latest generation to discover, at greater speed and lower cost than any before it, that the most exciting way to participate in a market is also the most reliably expensive one. The ESMA figures — 71 to 89% of retail CFD accounts lose money — have been on every regulated broker’s website since 2018. They have not reduced demand. They have been absorbed into the community as a filter: proof that those who survive have beaten a selection process that eliminates the majority. That is either the correct interpretation of a survivorship-bias dataset, or it is the rationalisation of a community that does not yet have enough data to know it is wrong.
Jesse Livermore made $100 million in 1929 and was broke by 1934. Syed Shah started a trading session with $77,000 and was told he owed $9 million before his broker absorbed the loss. Keith Gill turned $53,000 into $300 million on a thesis he spent two years developing in public before anyone noticed. Saahil Sud’s algorithm captured a share of daily fantasy profits so large it was indistinguishable from the outcome distribution in any leveraged market. The argument between Markowitz and Mandelbrot — between diversification and the barbell, between steady compounding and the concentrated bet — will continue to play out in the only arena where arguments about trading are ever actually settled: the market itself, on a clock that never stops.