WTI Tops $104 and the DAX Slides to a Seven-Week Low as Europe Trades a Soft ZEW, Weak UK Payrolls and an All-But-Certain Fed Hike | Technical Analysis – European Session | 15-09-2026
WTI Tops $104 and the DAX Slides to a Seven-Week Low as Europe Trades a Soft ZEW, Weak UK Payrolls and an All-But-Certain Fed Hike
EUR/USD · GBP/USD · Silver · Crude Oil · DAX 40 · ETH/USD · XRP/USD — live European market outlook today, updated through the trading session
European Market News — Live Now, 15 September 2026
Top-moving headlines shaping the European market outlook today, updated through the session
Brent Near $107 With Saudi Hormuz-Bypass Pipeline Still Shut
WTI is up 2.2% at $104.12 and Brent is firmer near $107.30 as Saudi Arabia’s East-West pipeline, which can move roughly seven million barrels a day to the Red Sea export hub at Yanbu, remains offline after drone strikes on 10 and 11 September. A planned Iran-Gulf meeting on Hormuz shipping was postponed and the IEA has cut its 2026 global supply forecast by 5.7 million barrels a day, keeping a firm risk premium in crude.
Commodities & GeopoliticsFOMC Opens Its Two-Day Meeting With a Hike Roughly 92% Priced
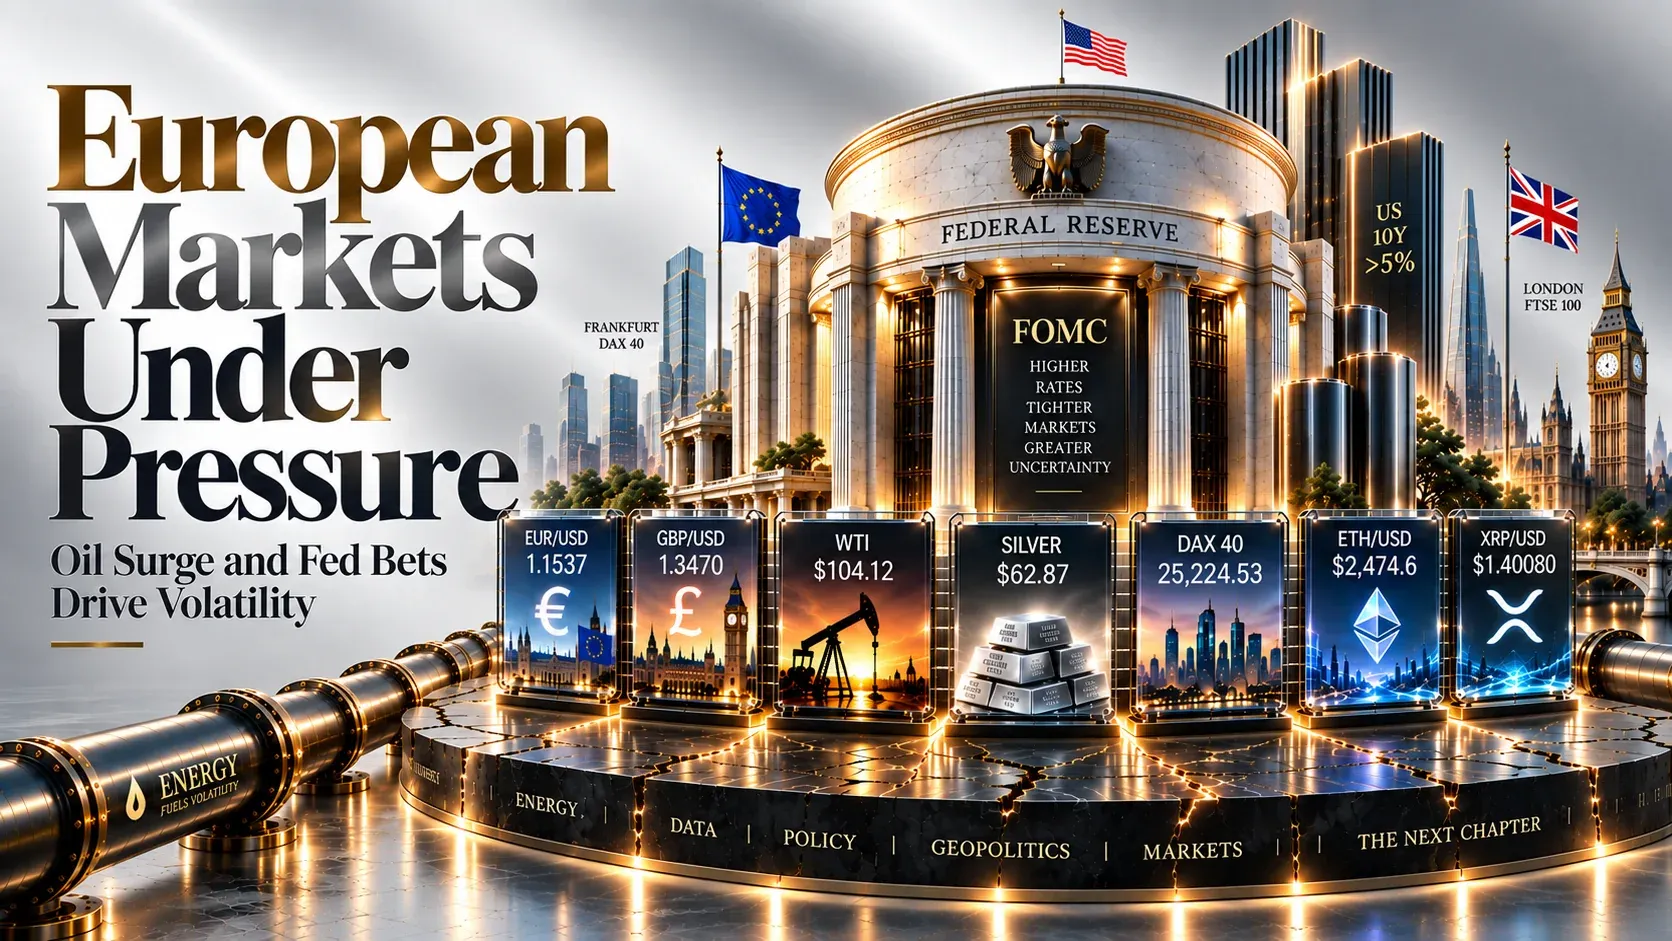
The Federal Open Market Committee begins its meeting today with the decision due Wednesday, and the CME FedWatch tool puts the odds of a 25-basis-point move to 3.75%-4.00% at around 92%, up from roughly 60% a week ago. The US 10-year Treasury yield has pushed above 5% for the first time since 2023 and the Dollar Index sits near 99.33, close to a two-week high.
Central BanksGerman ZEW Misses as Eurozone Sentiment Falls Outright
Germany’s ZEW economic sentiment index rose only to 34.7 in September from 34.2, against forecasts ranging from about 37 to a Bloomberg consensus near 40, though the current conditions gauge improved sharply to -47.1 from -61.1 and beat expectations. The Eurozone sentiment reading went the other way, dropping to 25.8 from 31.4, underlining how unevenly the energy shock is landing across the bloc.
Economic DataUK Payrolls Slump Hands the Bank of England Another Reason to Hold
ONS data showed UK payrolls fell 26,000 in August against expectations for a 5,000 decline, with July’s drop revised to 19,000 from 13,000, while jobless claimants rose well beyond forecasts. The ILO unemployment rate held at 4.9% rather than climbing to 5.0%, and average earnings excluding bonuses grew 3.5%. GBP/USD slipped to about 1.3470, near five-week lows, with the BoE expected to keep Bank Rate at 3.75% on Thursday.
Forex & Central BanksDAX Drops to a Seven-Week Low as Chip Names Stay Under Pressure
Frankfurt’s DAX 40 is down 0.85% at 25,224.53, its weakest level in more than seven weeks, having broken the 25,241.77 moving average with the 24,803 retracement the next measured objective. The MDAX is off about 0.6% near 30,859 and the EuroStoxx 50 around 0.9% lower, extending Monday’s rout that saw Infineon fall 7.7% and Siemens Energy 8.0% on renewed AI capital-spending doubts.
EquitiesSilver Tests Its 62.92 Shelf While XRP Stalls Into the CLARITY Vote
Silver is 0.56% lower at $62.87 an ounce, held well beneath the 66.24 and 66.97 moving averages as a firmer Dollar and 5%-plus Treasury yields weigh on the non-yielding metal. In crypto, XRP was rejected at $1.43 and is 1.56% lower at $1.40080 ahead of the Senate’s 2:15pm ET cloture vote on the CLARITY Act, while Ethereum is down 1.64% at $2,474.6 despite a $216 million single-day inflow into US spot ETH ETFs.
Commodities & CryptoLive · Updated through the European morning session, Tuesday 15 September 2026
Europe & Global Economic Calendar This Week — 15 September 2026
Key releases and events shaping price action through the rest of the week
| Time (GMT) | Event | Forecast / Detail | Impact | Market Read |
|---|---|---|---|---|
| 🇬🇧06:00 · Tuesday, 15 September | UK Labour Market Report | Payrolls -26K vs -5K expected; ILO unemployment steady at 4.9%; earnings ex-bonus +3.5% y/y | 🔴 CRITICAL | Released — pushed GBP/USD toward five-week lows near 1.3465 |
| 🇩🇪09:00 · Tuesday, 15 September | German & Eurozone ZEW Surveys | German sentiment 34.7 vs ~37-40 expected; current conditions -47.1; Eurozone 25.8 from 31.4 | 🔴 CRITICAL | Released — a soft headline that keeps the Euro pinned near 1.1537 |
| 🇺🇸12:30 · Tuesday, 15 September | US Empire State Manufacturing Index | First regional US activity read of the month, into the FOMC blackout close | 🟢 MEDIUM | A hot print would harden the hawkish dot-plot narrative for Wednesday |
| 🇺🇸18:15 · Tuesday, 15 September | Senate Cloture Vote, CLARITY Act (H.R. 3633) | 60 votes needed on the motion to proceed; Republicans hold 53 seats | 🔴 CRITICAL | The binary catalyst for XRP and the broader crypto complex today |
| 🇺🇸20:30 · Tuesday, 15 September | API Crude Oil Stock Estimate | Weekly private inventory read with Saudi export capacity impaired | 🟢 MEDIUM | A draw would add to the supply-risk bid already in WTI and Brent |
| 🇺🇸Wednesday, 16 September | FOMC Rate Decision & Projections | ~92% priced for a 25bp hike to 3.75%-4.00%; dot plot and Warsh press conference in focus | 🔴 CRITICAL | The decisive event risk this week for the Dollar, yields and European equities |
| 🇬🇧Thursday, 17 September | Bank of England Rate Decision | Bank Rate expected unchanged at 3.75%; ING looks for a 6-3 hold rather than a hawkish pivot | 🔴 CRITICAL | A dovish hold widens the Fed-BoE gap and keeps Cable’s downtrend intact |
| 🇯🇵Thursday–Friday, 17–18 September | Bank of Japan Meeting | Markets fully price a 25bp hike to 1.25% | 🔴 CRITICAL | Sets the tone for Yen crosses and global duration into the weekend |
| 🇸🇦Ongoing | Saudi East-West Pipeline & Hormuz Traffic | Pipeline offline after 10-11 September drone strikes; Yanbu storage cover estimated at 5-7 days | 🔴 CRITICAL | Remains the dominant swing factor for crude, inflation and risk appetite |
European Session Trade Ideas — EUR/USD, DAX 40, Crude Oil and More
Technical setups and fundamental context across the session’s seven key instruments
EUR/USD
Why This Setup
A near-92%-priced Fed hike, a US 10-year above 5% and a Dollar Index near 99.33 are doing the work here, and today’s ZEW miss gave the Euro nothing to lean on even with the ECB having lifted its deposit rate to 2.50% on 10 September. Price has rolled over from the 1.16190 Fibonacci level and is now trading below the 1.15543 moving average with the 1.15323 line directly underneath; RSI at 40.82 has broken below its own signal at 53.56. A clean loss of the 0.5 retracement at 1.15155 opens the 0.618 level at 1.14698. The real two-way risk is Wednesday: a hike delivered with soft guidance is the classic sell-the-fact setup for the Dollar.

Chart by TradingView
GBP/USD
Why This Setup
August payrolls fell 26,000 against expectations for a 5,000 drop and claimant counts overshot badly, which hands the Bank of England every excuse to sit at 3.75% on Thursday while the Fed tightens on Wednesday. ING’s James Smith argues UK wage growth has settled near a 2.9% floor consistent with the 2% target, so a hawkish surprise looks unlikely absent another energy spike. Cable is pressing the 0.382 retracement at 1.34719 with the 1.34406 moving average beneath it and the 1.35542 line capping rallies, while RSI at 43.36 sits under its 50.69 average. Below 1.3440 the 0.618 level at 1.33436 is the next real shelf.

Chart by TradingView
Silver (XAG/USD)
Why This Setup
Silver is caught between two forces and the wrong one is winning: oil above $100 is an inflation story that should help the metal, but a US 10-year above 5% and a Fed hike that is effectively priced are a brutal combination for a non-yielding asset. Price has been rejected repeatedly beneath the 66.24 and 66.97 moving averages, is now closing on the 0.236 retracement at 62.9181 with the 62.4782 line just underneath, and RSI at 44.10 has rolled under its 52.54 signal. Losing 62.48 removes the last structure before the low-50s. Industrial demand and any dovish tilt in Wednesday’s dot plot are the genuine two-way risks to a short.

Chart by TradingView
Crude Oil (WTI)
Why This Setup
The bid is structural, not sentimental. Saudi Arabia’s East-West pipeline — roughly seven million barrels a day of Hormuz-bypass capacity to Yanbu — is still shut after drone strikes, analysts put storage cover at the affected Red Sea port at only five to seven days, the Iran-Gulf meeting on shipping was postponed, and the IEA has taken 5.7 million barrels a day out of its 2026 supply forecast. WTI has run the entire retracement from the 66.99 July low back to the 104.81 swing high in a clean rising channel, with every moving average — 84.65, 87.18 and 90.40 — stacked well below price. RSI at 72.01 is overbought, which is the honest caveat: this is a trend to buy on pullbacks, not to chase. A pipeline restart or a revived diplomatic track would unwind a large premium quickly.

Chart by TradingView
DAX 40
Why This Setup
Frankfurt is the most exposed major index to this particular mix: an energy shock it imports, a chip complex being repriced on AI capital-spending doubts, and a domestic growth picture that today’s ZEW confirmed is improving only grudgingly. Monday’s session saw Infineon fall 7.7% and Siemens Energy 8.0%, and the index has now cut through the 25,241.77 moving average with the 25,732.90 and 25,955.49 lines turning into overhead resistance. RSI at 35.09 is deeply under its 48.03 signal and approaching oversold, so expect the decline to be choppy rather than clean. Below here the 0.382 retracement near 24,803 is the measured objective; a quick Red Sea de-escalation, or a Fed that hikes then signals it is done, is the rally risk to respect.

Chart by TradingView
ETH/USD
Why This Setup
Ether is giving back ground with the rest of the risk complex today, but the structural bid is intact: US spot ETH ETFs took in $216 million in a single day and roughly $197 million over the past week while Bitcoin funds bled, and Uniswap V4 fees jumped more than 114% in a day. Price is consolidating in a tight band beneath the 2,670.9 swing high after the late-August gap higher, with the 2,472.5 moving average running directly under the close and the 2,396.5 retracement the first real support beneath that. RSI at 56.93 is still constructive. The risk is macro, not crypto: a hawkish Fed that hikes and points to more would put 2,396 and then the 2,226.8 level in play.

Chart by TradingView
XRP/USD
Why This Setup
Today is the whole trade. At 2:15pm ET the Senate votes on cloture for the motion to proceed to H.R. 3633, the CLARITY Act, which would split digital-asset oversight between the SEC and CFTC and hand most spot digital-commodity supervision to the CFTC — the single biggest structural win available to XRP. Nine consecutive weeks of ETF inflows have built roughly $1.7 billion in assets behind the move. Technically the token pushed to 1.43009 and was turned away at the 0.382 retracement at 1.42925, leaving the 1.38944 moving average as the level bulls must defend; RSI at 56.14 remains above its 40 floor. Be honest about the shape of it: this is binary. Cloture needs 60 votes with Republicans holding 53, and a failed vote points back through 1.3442 toward $1.30.

Chart by TradingView
European Session FAQs — 15 September 2026
Quick answers to what’s moving markets this session
Why are European markets falling on Tuesday?
What did the German ZEW survey show in September 2026?
Why is the Pound under pressure today?
What is driving oil prices on 15 September 2026?
What should traders watch for the rest of the week?
European Session Summary — Tuesday, 15 September 2026 (Live Update)
Tuesday’s European session is being defined by an energy shock meeting a policy squeeze. WTI is up 2.2% at $104.12 and Brent is firmer near $107.30 with Saudi Arabia’s East-West pipeline still offline, Hormuz traffic depressed, Iran-Gulf talks postponed and the IEA having cut its 2026 supply forecast by 5.7 million barrels a day. That is flowing straight into the equity complex: Frankfurt’s DAX 40 is down 0.85% at 25,224.53 and at its lowest in more than seven weeks, the MDAX is off around 0.6% near 30,859 and the EuroStoxx 50 roughly 0.9% lower, with Monday’s 7.7% slide in Infineon and 8.0% drop in Siemens Energy still setting the tone. London’s FTSE 100 is the regional outlier near 10,700 on the strength of its energy weighting.
Currencies are trading the central-bank gap rather than the data. EUR/USD is defensive at 1.15348 after a German ZEW reading of 34.7 undershot forecasts and Eurozone sentiment fell to 25.8, with the Dollar Index near 99.33 and the US 10-year above 5%. GBP/USD has slipped to 1.34730 after August payrolls fell 26,000 against expectations for a 5,000 decline, leaving the Bank of England comfortably able to hold at 3.75% on Thursday while the Fed hikes on Wednesday. Silver is 0.56% lower at $62.87, rejected beneath the 66.24 and 66.97 moving averages. In crypto, XRP was turned away at the 1.42925 retracement and sits 1.56% lower at $1.40080 ahead of today’s 2:15pm ET Senate cloture vote on the CLARITY Act, while Ethereum is 1.64% softer at $2,474.6 despite a $216 million single-day inflow into US spot ETH ETFs.
Highest-conviction session idea: stay long crude dips while the East-West pipeline stays shut, fade DAX rallies while imported energy costs and AI-capex doubts compound each other, and treat XRP as a defined-risk event trade into the 2:15pm ET cloture vote — with Wednesday’s FOMC decision and dot plot as the single variable capable of unwinding all three at once.
For the individual instruments: EUR/USD sell rallies toward 1.1555, stop 1.1625, target 1.1470 — the Fed-ECB policy gap and a 5%-plus US 10-year are a genuine headwind, though a dovish post-hike message is a real source of two-way risk. GBP/USD sell rallies toward 1.3550, stop 1.3610, target 1.3345 — a weak payrolls print and a BoE hold on Thursday are a genuine headwind, though positioning near five-week lows is a real source of two-way risk. Silver sell rallies toward 64.40, stop 66.30, target 59.00 — 5%-plus real-yield pressure is a genuine headwind, though oil-driven inflation hedging is a real source of two-way risk. Crude Oil buy dips toward 102.20, stop 100.30, target 109.50 — the Saudi pipeline outage and the IEA supply downgrade are a genuine tailwind, though a pipeline restart or revived diplomacy is a real source of two-way risk. DAX 40 sell rallies toward 25,500, stop 25,760, target 24,810 — imported energy costs and semiconductor de-rating are a genuine headwind, though the 100-day line near 25,230 is a real source of two-way risk. ETH/USD buy dips toward 2,400, stop 2,290, target 2,670 — record ETF inflows and a rising DEX fee base are a genuine tailwind, though a hawkish dot plot is a real source of two-way risk. XRP/USD buy dips toward 1.3900, stop 1.3400, target 1.5340 — a CFTC-led oversight regime under the CLARITY Act is a genuine tailwind, though a failed cloture vote is a binary risk that points back through 1.3442 toward $1.30. The decisive variable for the rest of the day is whether the Senate clears the 60-vote threshold this afternoon and whether Wednesday’s Fed hike arrives with a hawkish or a finished-for-now message. Size positions accordingly, and note that fast-moving Red Sea, Fed and Senate headlines carry genuine event risk that could exaggerate moves in either direction.
Ready to act on today’s setups? Open an Account with Capital Street FX and trade every instrument covered in this report on our Zero Account‘s 0.0 Pips Spreads and 1:10000 Leverage, across 2000+ Instruments, with a welcome deposit bonus and 24/7 Live Support on hand for every session.
Not sure which account fits your style? Compare our Account Types side by side with our Account Comparison tool, browse current Promotions / Bonus offers, and trade from our Trading Platform suite. Funding is simple via our Deposit & Withdrawal options. For ongoing coverage, explore our Forex Analysis Pages, Commodity Analysis Pages and Crypto Analysis Pages, plus our Daily Market Analysis and Weekly Market Analysis reports and the full Economic Calendar. New to trading? Visit our Trading Education / Blog, or reach our Contact Us / Live Support team any time.
Access Live European Markets →