Trade Idea for Natural Gas Today: Technical Summary, Fundamental News and a Trade Setup With Entry, Stop Loss and Take Profit | 16-09-2026
Trade Idea for Natural Gas Today: Technical Summary, Fundamental News and a Trade Setup With Entry, Stop Loss and Take Profit
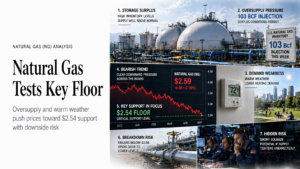
Natural gas trades at $2.920 per MMBtu, effectively flat, pinned beneath the $2.936 pivot as record Lower 48 production meets near-record LNG feedgas demand into the Federal Reserve decision and Thursday’s storage report.
This natural gas trade idea starts from a market that is genuinely balanced rather than one waiting to break. NG futures are at $2.920 after a $2.918 to $2.948 session, one of the narrowest daily ranges of the month, and the RSI at 54.97 sits barely above its 54.55 signal line. That is what a standoff looks like on a chart. The Fibonacci grid measured from the $2.478 base to the $3.394 June swing high puts the 50% retracement at $2.936, and the short-term moving average is almost on top of it at $2.940. Natural gas has probed that band and been rejected from it repeatedly through September, including three separate failures above $3.00 earlier in the month.
The reason the range holds is that the two sides of the balance are both unusually strong. On the bearish side, Lower 48 production has averaged roughly 112.9 Bcf/d in September, above August’s monthly high, and working gas in storage reached 3.254 trillion cubic feet after a 40 Bcf injection that beat the 31 Bcf consensus, leaving inventories about 5% above the five-year average with the EIA projecting 3,969 Bcf by 31 October. On the bullish side, LNG feedgas to the nine major export terminals has climbed to 18.1 to 18.3 Bcf/d from 17.2 Bcf/d in August, with European and Asian buyers competing for cargoes to replace disrupted Persian Gulf supply, and above-average temperatures across the South and Southeast are keeping power burn alive through 18 September. Brent above $108 widens the fuel-switching gap further. The next 24 hours put a scheduled test on both sides: the Federal Reserve at 2:00 PM ET today, and the EIA storage report at 10:30 AM ET on Thursday.
Fundamental News Set to Impact Natural Gas Prices Next
The supply, demand and macro stories shaping the natural gas outlook for the next 24 hours
Natural Gas Technical Summary and Chart Analysis for Today
Daily structure, Fibonacci retracements, moving averages and RSI as of 16 September 2026

The technical summary for natural gas today shows a contract compressed into a very tight band directly beneath meaningful resistance. NG is at $2.920 after opening at $2.938 and trading $2.918 to $2.948, a three-cent range. The Fibonacci structure is measured from the $2.478 April base up to the $3.394 June swing high, and the 50% retracement at $2.936 has become the pivot the entire month is organised around. Sitting almost exactly on it is the short-term moving average at $2.940, with two deeper averages just below at $2.867 and $2.837. Price is wedged between the pivot above and the moving averages below, which is precisely why the daily ranges have collapsed.
The broader structure still matters. Natural gas rallied hard off the $2.478 low into the $3.394 June high, spent July and August rolling over, and has traded a wide sideways channel since. The current position — below the 50% retracement, above the 61.8% at $2.828 — keeps natural gas inside a downtrend from June but no longer in active decline. The RSI at 54.97 against a 54.55 signal line is the most honest reading on the chart: it has recovered from the sub-45 readings of August without generating any real momentum, and it confirms neither side has control. Practically, this means natural gas is a level-based trade rather than a trend trade today. A confirmed reclaim of $2.955 clears both the pivot and the moving average in one move and opens $3.044; continued rejection there keeps the $2.840 to $2.880 moving average band as the buy zone; and a daily close below $2.828 would end the constructive read entirely.
Natural Gas Technical Levels at a Glance · Next 24 Hours
- Resistance 1: $2.936 to $2.948 — the 50% retracement, the $2.940 moving average and today’s session high
- Resistance 2: $3.044 — the 38.2% retracement, and the level that capped three attempts above $3.00 this month
- Resistance 3: $3.178 to $3.394 — the 23.6% retracement and the June swing high
- Support 1: $2.918 — today’s session low
- Support 2: $2.867 to $2.837 — the deeper moving average cluster, the preferred dip-buy band
- Support 3: $2.828 — the 61.8% retracement, then $2.674 and the $2.478 base of the structure
- Pivot: $2.936 — the level the whole month is organised around; reclaiming it is the trigger
- Momentum: RSI 54.97 versus signal 54.55 — neutral, confirming a genuine standoff rather than a trend
Calendar — Events That Can Move Natural Gas in the Next 24 Hours
Key releases, model runs and flow data shaping the natural gas outlook over the coming 24 hours
| Date / Time | Event | Detail | Impact |
|---|---|---|---|
| Today 16 Sep, 2:00 PM ET | Federal Reserve Rate Decision and Dot Plot | A 25 basis point hike to 3.75%-4.00% is close to fully priced, so the reaction will come from the projections. A hawkish set of dots lifts the dollar and pressures the commodity complex including natural gas, while a softer tone would let a reclaim attempt above $2.955 extend | HIGH |
| Today 16 Sep, 2:30 PM ET | Chair Kevin Warsh Press Conference | The press conference has been the larger mover this cycle. For natural gas the channel is indirect, through the dollar and broad risk appetite, but it is capable of overwhelming the weather narrative for a few hours | MEDIUM |
| Tomorrow 17 Sep, 10:30 AM ET | EIA Weekly Natural Gas Storage Report | The single biggest scheduled catalyst in this window. The report covers the week ended 11 September. Last week’s 40 Bcf build beat the 31 Bcf consensus and pushed prices to a three-week low, so another above-consensus injection would likely take out the $2.918 session low and test the moving averages at $2.867 and $2.837 | HIGH |
| Next 24 hours 00z and 12z runs | Weather Model Runs for Late September | Above-average temperatures across the South and Southeast are forecast through 18 September. Each model cycle that extends that heat into the final week of the month is worth several cents to the front month; each one that pulls it forward is worth the same in the other direction | HIGH |
| Next 24 hours Daily estimates | LNG Feedgas Nominations at the Nine Export Terminals | Feedgas has run at roughly 18.1 to 18.3 Bcf/d in September against 17.2 Bcf/d in August. A reading that holds above 18 Bcf/d supports the bid; any unplanned outage at a Gulf Coast terminal would remove demand instantly and is the most common source of an unscheduled gap lower | MEDIUM |
| Next 24 hours Daily estimates | Lower 48 Production Estimates | Output near 112.9 Bcf/d is the ceiling on this market. A pipeline-scrape print showing production slipping below roughly 112 Bcf/d would be read as genuinely constructive; a fresh record would cap the reclaim attempt before it starts | MEDIUM |
| Ongoing Session | Test of the $2.936 to $2.948 Pivot Band | Whether natural gas can close back above the 50% retracement at $2.936 and the moving average at $2.940, or keeps failing there as it has repeatedly this month, is the defining technical question for the next 24 hours | HIGH |
| Ongoing Session | Dollar Index and Real Yields After the Fed | A broadly stronger dollar following the decision is a persistent if indirect headwind for dollar-denominated energy contracts including NYMEX natural gas | LOW |
The shape of this calendar is unusual for natural gas: a macro event today and the market’s own dominant catalyst tomorrow morning, with weather model runs cycling through the night between them. That sequencing matters for execution. A position opened before the Federal Reserve announcement carries dollar risk it was not designed to take, and then carries storage risk fourteen hours later. Traders who prefer one catalyst at a time have a defensible case for waiting until after the 2:30 PM ET press conference before acting on the levels below.
Natural Gas Trade Setup for the Next 24 Hours: Entry, Stop Loss and Take Profit
Natural Gas (NYMEX NG) · $2.920 • PINNED BENEATH THE $2.936 PIVOT — Buy a Reclaim of $2.955 or a Dip Into $2.840–$2.880, Target the $3.044–$3.394 Zone
Natural Gas · NG / NYMEX Futures
Technical Summary (Next 24 Hours)
Natural gas is at $2.920 after a three-cent session, wedged beneath the $2.936 Fibonacci pivot and the $2.940 moving average with the deeper averages at $2.867 and $2.837 underneath. A confirmed reclaim of $2.955 clears both pieces of resistance at once and opens $3.044, the level that has capped every push above $3.00 this month. Continued rejection keeps the $2.840 to $2.880 band as the dip-buy zone. A daily close below $2.828 ends the constructive read.
Fundamental Driver
Lower 48 production near 112.9 Bcf/d and storage roughly 5% above the five-year average sit directly against LNG feedgas at 18.1 to 18.3 Bcf/d and late-season Southern heat running through 18 September. Neither side has won, which is exactly why the range persists. Thursday’s EIA storage report for the week ended 11 September is the scheduled event most likely to break the standoff in one direction.
Risk Management
Risk on the reclaim entry is roughly 16.5 cents against 8.9 to 43.9 cents of reward across the staged targets, which is thin at TP1 and only becomes attractive at TP2 and TP3; the dip entry at $2.840 to $2.880 carries about 5 to 9 cents of risk to the same stop and is by a wide margin the better-priced expression. Natural gas moves in whole percentage points on a single storage print or model shift, so keep size well below what the current three-cent daily range would suggest, scale out rather than holding for TP3, and treat the $2.790 stop as absolute.

There are two clean ways to express this natural gas idea. The confirmation version waits for a reclaim of $2.955, which clears the 50% retracement and the short-term moving average in a single move and signals that the level organising the entire month has finally given way, accepting a worse entry price in exchange for knowing the market has cleared its ceiling before pressing toward $3.044 and $3.178. The dip version waits for a rotation into $2.840 to $2.880, right on the moving average cluster at $2.867 and $2.837 and just above the 61.8% retracement at $2.828, which offers a far tighter stop and a materially better risk profile at the cost of possibly never being filled if the reclaim comes first.
The small things worth knowing before sizing a natural gas position today. First, this contract has failed at the $2.94 to $3.00 area at least three times this month, and a level that has held on repeated tests attracts stops just above it — which is precisely what makes a genuine reclaim worth trading and an intraday wick worth ignoring. Second, the daily range has compressed to three cents; compression this tight almost always resolves into an expansion, and the storage print on Thursday morning is the most likely trigger, so an unusually quiet tape today is not a reason to add size. Third, natural gas is the most weather-sensitive product on any energy desk, and the overnight 00z model run can reprice the front month before the US session opens, which is an argument against carrying an unhedged position through the night in a shoulder-season market. Fourth, the El Nino signal has already pushed the winter strip to its lowest of the year, meaning positioning is crowded short further out the curve; any colder model shift would produce a short-covering move in the front month out of proportion to the underlying news. And finally, keep the LNG side in view: feedgas near 18.3 Bcf/d is the closest thing this market has to a demand floor, and a single unplanned outage at a Gulf Coast terminal removes roughly two Bcf/d of demand instantly and is the most common source of a gap lower that no weather model predicted.
FAQ: Today’s Natural Gas Price, Technicals and Trade Setup
Common questions traders ask about natural gas on 16 September 2026
Conclusion: Natural Gas Holds a Tight Range Into the Storage Report
Natural gas enters the next 24 hours at $2.920 per MMBtu, effectively unchanged, compressed into a three-cent range directly beneath the $2.936 Fibonacci pivot and the $2.940 moving average, with an RSI at 54.97 that confirms neither side has control. That standoff is real rather than technical noise: Lower 48 production near 112.9 Bcf/d and storage roughly 5% above the five-year average are pressing against LNG feedgas at 18.1 to 18.3 Bcf/d and late-season Southern heat that runs through 18 September. Two scheduled events sit inside the window — the Federal Reserve this afternoon and the EIA storage report on Thursday morning — and the storage print is by some distance the more likely of the two to end the deadlock.
The trade idea is therefore built on levels, not conviction. A confirmed reclaim of $2.955 opens $3.044 and $3.178; a rotation into $2.840 to $2.880 is the better-priced entry against the same $2.790 stop; and a daily close below $2.828 removes the constructive case entirely. Ranges this compressed resolve into expansions, so the discipline that matters today is sizing for the move that comes after the quiet, not for the quiet itself.
None of this is investment advice. Natural gas is among the most volatile products traded on any energy desk, and today’s levels can move sharply on a single weather model run, an LNG terminal outage or Thursday’s storage number. Always size positions to your own risk tolerance and confirm every level against a live feed before acting.