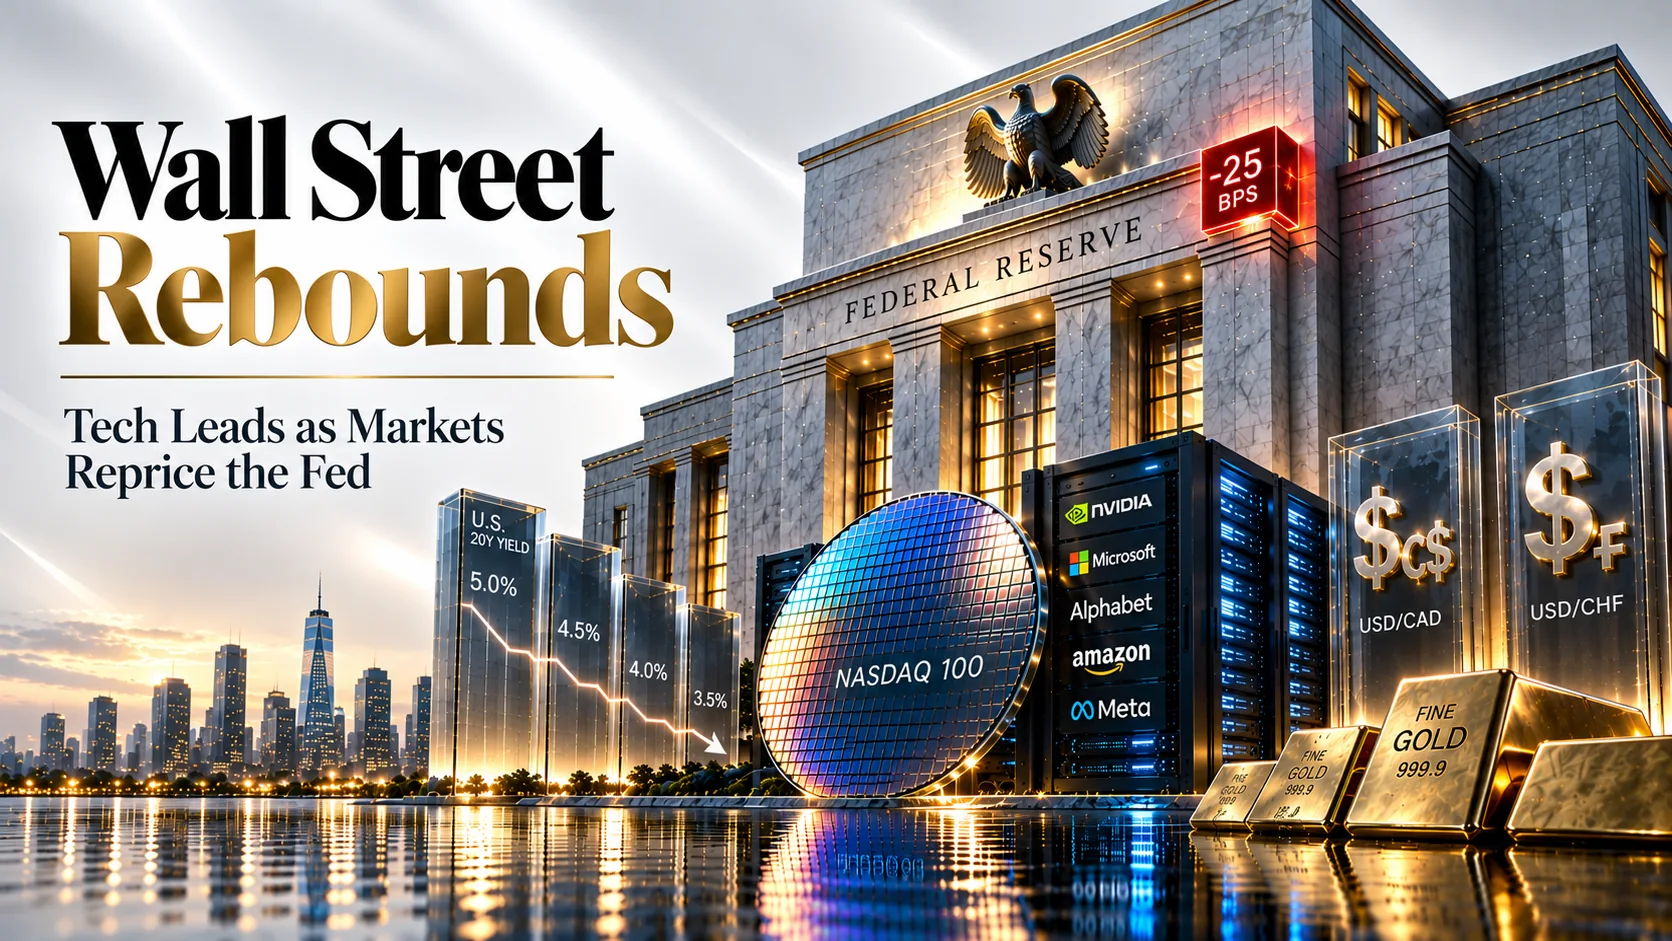
Wall Street Rebounds on a Tech-Led Bounce After the Fed’s First Hike Since 2023, as Oil Slips Toward $100 and Treasuries Rally on Warsh’s Inflation Resolve | Technical Analysis – US Session | 17 September 2026
Wall Street Rebounds on a Tech-Led Bounce After the Fed’s First Hike Since 2023, as Oil Slips Toward $100 and Treasuries Rally on Warsh’s Inflation Resolve
USD/CAD · USD/CHF · Gold · Crude Oil · Nasdaq 100 · US 20Y · BTC/USD · XRP/USD — live US market outlook today, updated through the New York session
U.S. Market News — Live Now, 17 September 2026
Top-moving headlines shaping the US market outlook today, updated through the session
Fed Signals More Tightening After First Hike Since 2023; October Move Now a Coin Flip
The FOMC lifted rates 25bp to 3.75–4.00% in a unanimous vote, and 16 of 18 officials now pencil in at least one more hike this year. Chair Kevin Warsh told reporters inflation “is too high and has been for too long,” and money markets now price roughly even odds of another move in October.
Central BanksUS Data Mixed: Jobless Claims Drop to 196K, Philly Fed Beats, Housing Starts Miss
Initial claims fell to 196,000 against a 208,000 consensus and continuing claims eased to 1.730M. The Philadelphia Fed index slipped to 37.8 from 47.4 but beat forecasts near 30, with prices paid jumping to 48.6. August housing starts fell 2.6% to a 1.275M pace, below the 1.309M expected, as mortgage rates climb.
Economic DataWall Street Rebounds as AI and Chip Stocks Lead a Post-Fed Bounce
By mid-morning the Nasdaq Composite was up about 1.6% near 26,382, the S&P 500 gained roughly 0.9% to 7,621 and the Dow added about 0.4% to 51,679, recovering part of Wednesday’s selloff. Technology, consumer discretionary and materials lead, while financials and energy lag; prominent warnings about AI valuations keep the rally on a short leash.
EquitiesOil Slides as Saudi Arabia Routes More Crude Through Hormuz
Brent is down about 2.6% near $103 and WTI briefly dipped below $100 before steadying around $100.55, after reports that Riyadh is supplying Asian refiners via ship-to-ship transfers off Oman while the East-West pipeline stays shut. Rapidan Energy still sees Saudi exports down about 400,000 bpd this month, and crude remains sharply higher for September.
CommoditiesTreasuries Rally and Gold Rebounds as the Dollar Holds Near a Seven-Week High
The 10-year yield fell about 6bp to 4.94%, the 30-year eased to 5.30% and the 2-year slipped to 4.675%. Gold bounced over 1% to around $4,310 after Wednesday’s dip toward $4,230, even with the Dollar Index near 100.3. Across the Atlantic, the Bank of England held Bank Rate at 3.75% in a 6-3 vote.
Rates & MetalsBitcoin Steadies Near $76,500; XRP Defends $1.30 After CLARITY Act Failure
Bitcoin is up about 1.1% near $76,490 after the Senate’s 49-50 procedural vote stalled the CLARITY Act, while XRP holds around $1.30 following a near-10% drop. Spot Bitcoin ETFs lost about $450 million on September 15, but spot XRP ETFs have kept attracting modest inflows through the selloff.
CryptoUpdated through the New York morning session · 17 September 2026
U.S. Economic Calendar — Today’s Key Events
Key releases and events shaping price action through the US session
| Time | Event | Actual / Detail | Impact | Market Read |
|---|---|---|---|---|
| 🇺🇸Wednesday, 16 September (passed) | FOMC Rate Decision | Hiked 25bp to 3.75–4.00%, unanimous; 16 of 18 officials see another hike in 2026 | 🔴 CRITICAL | Dollar near a seven-week high; October hike odds near 50% |
| 🇬🇧07:00 ET (12:00 London) | Bank of England Rate Decision | Held Bank Rate at 3.75% in a 6-3 vote | 🔴 CRITICAL | Removes a European event risk heading into the New York session |
| 🇺🇸08:30 ET | Initial / Continuing Jobless Claims | 196K vs 208K cons. (prior 206K); continuing 1.730M vs 1.78M cons. | 🔴 CRITICAL | Tight labour market keeps further Fed hikes on the table |
| 🇺🇸08:30 ET | Philadelphia Fed Manufacturing (Sep) | 37.8 vs ~30.5 cons. (prior 47.4); prices paid 48.6 vs 40.9 | 🟢 MEDIUM | Firm activity and hotter input prices add to inflation worries |
| 🇺🇸08:30 ET | Housing Starts / Building Permits (Aug) | Starts 1.275M vs 1.309M cons.; permits 1.394M vs 1.410M cons. | 🟢 MEDIUM | Rising mortgage rates are biting on housing activity |
| 🇺🇸10:00 ET | Pending Home Sales (Aug) | Further read on housing demand as borrowing costs climb | ⚪ LOW | Secondary catalyst for yields and rate-sensitive sectors |
| 🇺🇸Ongoing | Saudi East-West Pipeline / Strait of Hormuz | Saudi crude rerouted via ship-to-ship transfers off Oman | 🟢 MEDIUM | Dominant driver for WTI, USD/CAD and inflation expectations |
U.S. Session Trade Ideas — USD/CAD, Gold, Nasdaq 100, BTC/USD and More
Technical setups and fundamental context across the session’s eight key instruments
USD/CAD
Why This Setup
A 150-basis-point-plus policy gap after the Fed’s hike to 3.75–4.00% against the Bank of Canada’s 2.25% is a genuine tailwind for the pair, while today’s slide in crude removes some support from the oil-linked Loonie; the real source of two-way risk is a renewed oil spike on Strait of Hormuz headlines, or a broader Dollar pullback as Treasury yields ease.

USD/CHF
Why This Setup
The widest Fed-SNB rate gap in years and markets pricing little chance of a Swiss hike this year make the Franc an attractive funding currency, which is a genuine tailwind; the Franc’s safe-haven status is the real source of two-way risk if Middle East tensions or an equity wobble trigger defensive flows, and the SNB’s September assessment is a further event risk.

Gold (XAU/USD)
Why This Setup
Bargain buying after Wednesday’s flush toward $4,230 and easing Treasury yields are a genuine tailwind, with long-run fiscal worries still underpinning demand; the Fed’s signal that more hikes are coming, and a Dollar sitting near a seven-week high, are the real source of two-way risk that could cap rallies near the $4,414–$4,440 area.

Crude Oil (WTI)
Why This Setup
An East-West pipeline outage that independent analysts warn could last weeks or months, plus an unresolved Strait of Hormuz standoff, is a genuine tailwind that keeps a floor under prices; Saudi Arabia’s ship-to-ship workaround off Oman and Washington’s insistence that the disruption will be short are the real source of two-way risk that could extend today’s pullback.

Nasdaq 100
Why This Setup
A strong rebound in AI, semiconductor and data-centre names, helped by a pullback in Treasury yields, is a genuine tailwind for the index; a 10-year yield still close to 5%, a Fed signalling more tightening, and high-profile investors trimming AI exposure are the real source of two-way risk that could turn this bounce into a lower high.

US 20Y Yield
Why This Setup
Chair Warsh’s firm anti-inflation stance has reassured bond buyers and pulled long-dated yields lower, while softer oil trims the inflation impulse — a genuine tailwind for bond prices (lower yields); heavy Treasury supply, fiscal concerns and any renewed oil spike are the real source of two-way risk that could send the long end back toward its multi-year highs.

BTC/USD
Why This Setup
Bitcoin has absorbed the failed CLARITY Act cloture vote better than most altcoins and is trading more like a macro asset alongside gold, which is a genuine tailwind for a recovery toward the $78,000 area; last Tuesday’s roughly $450 million spot-ETF outflow and a hawkish Fed are the real source of two-way risk, with $74,000 the key line below.

XRP/USD
Why This Setup
Continued spot XRP ETF inflows through the selloff and a well-defined support cluster are a genuine tailwind for a tactical bounce; the Senate’s 49-50 failure to advance the CLARITY Act removes a key catalyst and, together with tighter financial conditions, is the real source of two-way risk that could force a break below $1.25.

U.S. Session FAQs — 17 September 2026
Quick answers to what’s moving markets this session
What is driving US markets in today’s session?
How did this morning’s US economic data come in?
Why are USD/CAD and USD/CHF holding near recent highs?
Is gold’s rebound sustainable after the Fed hike?
What should traders watch for the rest of the US session?
U.S. Session Summary — Thursday, 17 September 2026 (Live Update)
Thursday’s US session is being shaped by the aftermath of Wednesday’s Federal Reserve hike to 3.75–4.00% and the central bank’s signal that more tightening is likely this year. Markets have steadied after the initial shock: equities are rebounding on a tech-led bounce, Treasury yields are easing with the 10-year near 4.94%, and the Dollar Index is holding near a seven-week high around 100.3. This morning’s data added to the hawkish backdrop, with jobless claims falling to 196,000 and the Philadelphia Fed survey beating forecasts alongside a jump in prices paid, while housing starts disappointed as mortgage rates rise. Earlier, the Bank of England held Bank Rate at 3.75% in a 6-3 vote.
Across the instruments in focus, USD/CAD is hovering near 1.3995 and USD/CHF near 0.8247, both supported by the widening US rate advantage. Crude Oil (WTI) has slipped to around $100.90 as Saudi Arabia reroutes barrels through the Strait of Hormuz, though the East-West pipeline outage keeps supply risk alive. Gold has rebounded to about $4,367 as yields ease, the Nasdaq 100 is leading equities higher near 29,424, and the US 20-year yield has dipped to around 5.330%. In crypto, Bitcoin is steadying near $76,668 and XRP is holding near $1.306 after the CLARITY Act setback.
Highest-conviction session idea: stay with the US Dollar’s rate advantage by buying dips in USD/CAD and USD/CHF while the Fed keeps further hikes on the table; treat the Nasdaq 100 rebound as tactical while the 10-year yield sits just under 5%; keep a constructive bias on crude dips given the unresolved Saudi pipeline outage; and treat crypto bounces as tactical until the US regulatory picture clears.
For the individual instruments: USD/CAD buy dips toward 1.3940, stop 1.3895, target 1.4080. USD/CHF buy dips toward 0.8210, stop 0.8165, target 0.8340. Gold (XAU/USD) buy dips toward 4,265.00, stop 4,215.00, target 4,420.00. Crude Oil (WTI) buy dips toward 98.80, stop 96.80, target 104.50. Nasdaq 100 buy dips toward 29,150.00, stop 28,880.00, target 29,850.00. US 20Y Yield sell yield bounces toward 5.380%, stop 5.450%, target 5.230%. BTC/USD buy dips toward 75,000, stop 73,800, target 78,600. XRP/USD buy dips toward 1.260, stop 1.190, target 1.420. The decisive variables for the rest of the session are whether Treasury yields keep easing, how crude reacts to further Hormuz and pipeline headlines, and whether the tech-led rebound can hold into the close. Size positions accordingly, and note that fast-moving central-bank and geopolitical headlines carry genuine event risk that could exaggerate moves in either direction.
Ready to act on today’s setups? Open an Account with Capital Street FX and trade every instrument covered in this report on our Zero Account‘s 0.0 Pips Spreads and 1:10000 Leverage, across 2000+ Instruments, with a welcome deposit bonus and 24/7 Live Support on hand for every session.
Not sure which account fits your style? Compare our Account Types side by side with our Account Comparison tool, browse current Promotions / Bonus offers, and trade from our Trading Platform suite. Funding is simple via our Deposit & Withdrawal options. For ongoing coverage, explore our Forex Analysis Pages, Commodity Analysis Pages and Crypto Analysis Pages, plus our Daily Market Analysis and Weekly Market Analysis reports and the full Economic Calendar. New to trading? Visit our Trading Education / Blog, or reach our Contact Us / Live Support team any time.
Access Live U.S. Markets →