The Fear Gauge: VIX, Volatility & What Comes Next
Dread Reckoning: The Price of Panic
Before satellites, sailors found their position by dead reckoning: speed, heading and an honest guess. Markets steer into the future the same way, and their compass is the VIX, the index that turns fear into a number. This dispatch tells its whole story. Where it came from, and why the first version fell short. How it grew a family of gauges for bonds, gold, oil and currencies. What every great panic and every long calm went on to deliver. And what it means that today, with the bond and oil gauges flashing, the VIX is the calmest one in the room. We close with our call for the next thirty days to five years.
What this dispatch covers
- Scare Quotes. What the VIX is and how to read it
- From Chalk to Ticker. The journey from idea to index
- Flying Blind. How risk was judged before 1993
- Eight Options and a Prayer. The first VIX and its flaws
- The Rebuild. What changed in 2003 and why
- Fear for Sale. Futures, options and the day it blew up
- Screams and Silences. Every major spike and every long calm
- Relative Volatility. The family of fear gauges
- Cross Winds. Gold, the dollar, bonds and oil
- Four Weathers. A regime framework for traders
- The Calmest Sibling. Where we are in October 2026
- Dead Ahead. Our view for 30 days to 5 years
- Short Answers. Practical questions
Scare Quotes
Every market price is a quote for something. A share price quotes a slice of a company. A bond yield quotes the price of time. The VIX quotes fear. More exactly, it quotes how much the S&P 500 is expected to swing over the next 30 days, as implied by what traders are paying right now for options on that index.
Options are insurance. A put option pays out if the market falls, a call pays out if it rises, and like any insurance the premium goes up when the buyer is nervous. Nobody has to be surveyed about how they feel. The premiums are the survey, and they are answered with real money, thousands of times a second. The Cboe (the Chicago exchange that owns the index) takes those premiums across hundreds of S&P 500 options, runs them through a fixed formula, and publishes one number every 15 seconds.
That number is an annualised percentage. A VIX of 15 means options are priced as if the S&P 500 will move at a pace of 15% a year, up or down, over the coming month. Nobody thinks in annualised standard deviations, so traders use a shortcut.
| VIX level | Typical daily move | In S&P 500 points | Range over 30 days | Regime |
|---|---|---|---|---|
| 9.14Record low, Nov 2017 | ±0.58% | ±45 pts | ±2.6% | Calm |
| 15.52Monday's close | ±0.98% | ±76 pts | ±4.5% | Normal |
| 19.50Long-run average | ±1.23% | ±95 pts | ±5.6% | Normal |
| 31.05March 2026 peak | ±1.96% | ±152 pts | ±9.0% | Panic |
| 52.33April 2025 peak | ±3.30% | ±256 pts | ±15.1% | Panic |
| 82.69Record high, Mar 2020 | ±5.21% | ±405 pts | ±23.9% | Panic |
Three things about this number trip up newcomers, and all three matter for everything that follows.
It is a price, not a forecast. The VIX tells you what protection costs. Because insurers want a margin, that cost usually runs above what actually happens. S&P Dow Jones Indices has measured the gap: on average the VIX overshoots the volatility that follows by around four points. Sellers of insurance pocket that difference in quiet times and hand it all back, with interest, in loud ones.
It has no direction. A VIX of 30 says big moves are expected. It does not say down. In practice it nearly always rises when shares fall, because people rush to buy puts in a falling market and the daily relationship between the two runs at roughly minus 0.7 to minus 0.8. But the index itself is a measure of size.
It always comes home. A share price can rise for decades. Volatility cannot. The VIX has averaged about 19.5 since 1990, it has never closed below 9.14 and never above 82.69, and after every excursion it has drifted back toward the middle. That homing instinct is why its extremes are worth studying. An extreme, by definition, is a place it will not stay.
From Chalk to Ticker
The story starts in a smoking lounge. On 26 April 1973 the Chicago Board Options Exchange opened for business in what had been the members' smoking room of the Chicago Board of Trade. It listed call options on 16 stocks and traded 911 contracts on day one. Within weeks, two academics named Fischer Black and Myron Scholes published a formula for what an option ought to cost.
The timing was a coincidence that changed finance. The formula needed five inputs. Four of them could be read off a screen: the share price, the strike, the time left and the interest rate. The fifth, how much the share would bounce around in future, could not be seen anywhere. But the formula could be run backwards. Feed in the option's actual market price and out came the volatility that price implied. Traders had stumbled on a way to read the crowd's expectations straight from the tape, and they called it implied volatility.
By the mid-1970s floor traders carried programmable calculators and printed sheets of theoretical values in their jacket pockets. Each option had its own implied volatility, and each trader had a private sense of whether "vol" was rich or cheap. What nobody had was a single figure for the market as a whole.
Two finance professors, Menachem Brenner and Dan Galai, proposed one in 1986. They called it the Sigma Index, pitched it to exchanges as something that could be traded like any other index, and published the idea in 1989. The exchanges listened politely and did nothing. Then the Cboe, still stinging from the 1987 crash (more on that in a moment), hired Robert Whaley, a professor at Duke University's Fuqua School of Business, to build a volatility index it could publish in real time.
Whaley delivered in 1992. On 19 January 1993 the Cboe switched on the Market Volatility Index, ticker VIX. He also reconstructed its history back to 1986 so that traders could see what the gauge would have shown on days it did not yet exist. One of those days stood out. On Black Monday, 19 October 1987, the reconstructed index closed at 150.19, a level that implies daily moves of more than 9%. Nothing since has come close.
Notice the gap in that sequence. For its first eleven years the VIX was a number on a screen and nothing more. You could look at it. You could not buy it, sell it or hedge with it. That gap shaped how the index was first used, and it is where the next two chapters live.
Flying Blind
Ask how risk was measured before 1993 and the fair answer is: after the fact. The standard tool was historical volatility. You took the last 20 or 30 days of price changes, worked out how widely they had been scattered, and assumed tomorrow would look similar. It was a rear-view mirror, and it had the rear-view mirror's defect. It showed the bend only once you were through it.
The alternatives were crafts more than measurements. On the floor of the New York Stock Exchange, specialists kept the order book for each stock and could feel pressure building before it reached the tape, but that knowledge stayed in their heads. Technicians watched the ratio of put volume to call volume, the number of advancing against declining shares, and surveys of newsletter writers. Bond desks watched the gap between corporate and government yields. Old hands watched the gold price and the dollar. Each of these said something about nerves. None was forward-looking, continuous and expressed in a single unit.
The insurance that set the house on fire
In the mid-1980s a Californian firm called Leland O'Brien Rubinstein sold pension funds a clever product named portfolio insurance. There was no insurer. The fund simply agreed to sell stock index futures as the market fell and buy them back as it rose, which on paper reproduced the payoff of a put option without the cost of buying one. By 1987 somewhere between $60 billion and $90 billion of assets were run this way.
The flaw was that everyone's rule said the same thing at the same moment. When shares slid in the week of 12 October, the programs sold. Their selling pushed prices lower, which told the programs to sell more. On Monday the 19th the futures in Chicago fell so far below the shares in New York that the two markets came apart, and the Dow closed down 508 points, or 22.6%, which is still its worst day.
Two legacies came out of that afternoon. Investors stopped trusting home-made protection and began paying up for real put options, especially ones far below the market, a habit that permanently bent option prices into what traders call the skew. And exchanges, regulators and academics all reached the same conclusion: the market needed a public, real-time reading of how much risk was being priced. The VIX is the answer to a question first asked that week.
So when the index arrived it filled a real hole. For the first time there was a forward-looking, minute-by-minute, market-wide statement of expected turbulence. Newspapers picked it up. Whaley himself gave it the nickname that stuck when he titled a paper "The Investor Fear Gauge".
It is worth being honest about what it could not do in those early years, though, because the romance of the origin story tends to skip this part. In February 1994, thirteen months after launch, the Federal Reserve raised interest rates for the first time in five years and set off what bond traders still call the Great Bond Massacre. The US 10-year yield climbed from about 5.8% to 8% over the year. Orange County in California went bankrupt on leveraged rate bets. Mexico's peso collapsed that December. Through all of it the VIX barely stirred, peaking in the low 20s. The carnage was in bonds, and the VIX only listens to share options. A fear gauge existed. It was pointed at the wrong market, and nobody could trade it anyway.
Eight Options and a Prayer
Whaley's 1993 index was elegant, and for its day sensible. It took exactly eight options on the S&P 100, an index of the hundred biggest American companies. Four were calls and four were puts, split across the two nearest expiry dates, and all were chosen to sit as close as possible to the current level of the market. Each price was run backwards through the Black-Scholes formula to get an implied volatility, and the eight results were blended into one figure representing a 30-day horizon.
Why the S&P 100 and not the more famous S&P 500? Because in 1992 that was where the action was. Options on the S&P 100, known by their ticker OEX, accounted for about three quarters of all index option trading in America. The design used the deepest pool of prices available.
The trouble showed up slowly, and it came in four parts.
1. It listened to the wrong end of the room
Remember the skew that 1987 left behind. After the crash, investors bought disaster insurance in the form of puts struck far below the market, and those puts carried much higher implied volatility than options near the current price. That is where fear actually lives. The original VIX, by using only at-the-money options, ignored it completely. It measured the mood of people insuring against a wobble and left out the people insuring against a catastrophe.
2. It leaned on a model the market had stopped believing
Black-Scholes assumes that volatility is constant and that big falls are no more likely than big rises. The existence of the skew is the market saying, in prices, that neither is true. So each of the eight inputs was a number produced by a formula that was known to be wrong in exactly the conditions when the index mattered most.
3. It ran hot
A quirk in how the formula converted calendar days into trading days pushed every reading higher than it should have been. Peter Carr and Liuren Wu, who dissected the two versions of the index in a paper called "A Tale of Two Indices", showed the bias was built into the arithmetic. It meant the old VIX could not be compared like for like with the volatility that later occurred, which is rather the point of a volatility index.
4. Nobody could build a product on it
This was the fatal one. To offer futures on an index, a bank has to be able to hedge them, which means constructing a portfolio that tracks the index. There is no portfolio of real securities that reproduces an average of eight Black-Scholes outputs. Meanwhile the market it was built on was fading. Through the 1990s trading migrated from S&P 100 options to S&P 500 options, and the index found itself reading a shrinking crowd.
| Original VIX, 1993 (now "VXO") | Rebuilt VIX, 2003 to today | |
|---|---|---|
| Underlying index | S&P 100 | S&P 500 |
| Options used | 8, all near the current market level | Hundreds: every out-of-the-money put and call with a live bid |
| Pricing model | Black-Scholes, run in reverse | None. Prices are used directly |
| Sees crash insurance? | No | Yes. Deep puts are in the sum |
| Level bias | Reads high by construction | Comparable with realised volatility |
| Can it be hedged? | No | Yes, with a strip of options |
| Tradable products | None, ever | Futures 2004, options 2006, funds 2009 |
None of this made the first VIX useless. It rose when it should have and it gave the financial press a daily fear headline. But as a working instrument it was a thermometer bolted to the wall: informative, slightly miscalibrated, and impossible to do anything with. Ten years in, the index its creators had hoped would become a hedging tool had not produced a single contract.
The Rebuild
The fix came from a different corner of finance. In the late 1990s banks had begun dealing in a contract called a variance swap, which pays out according to how volatile the market turns out to be. To price it, a team at Goldman Sachs (Kresimir Demeterfi, Emanuel Derman, Michael Kamal and Joseph Zou) published a research note in 1999 with the memorable title "More Than You Ever Wanted to Know About Volatility Swaps". Building on earlier work by Anthony Neuberger, Peter Carr and Dilip Madan, it showed something surprising. You can work out the market's expected variance from option prices alone, with no pricing model at all, provided you use options at every strike and weight each one by one over its strike squared.
The Cboe and Goldman turned that insight into a new index. Out went the eight options, the S&P 100 and Black-Scholes. In came the S&P 500 and a sum across the whole board:
In words: take every out-of-the-money put and call on the S&P 500 that someone is actually bidding for. Multiply each price, Q, by the gap between neighbouring strikes, ΔK, and divide by the strike squared, K². Add them all up. Do it once for options expiring just under 30 days from now and once for those just over, blend the two so the result sits at exactly 30 days, take the square root and multiply by 100.
The one-over-strike-squared weighting is the clever part. It gives low strikes more weight than high ones, so the far-from-the-market puts that the old index ignored now count for the most. When investors scramble for crash protection, the new VIX hears it first.
That last tile is the one that changed history. Because the new VIX equals the fair price of a 30-day variance swap, a dealer who sells a product linked to it can offset the risk with a basket of ordinary options. The index had stopped being a thermometer and become a specification. The old series was renamed VXO and kept running for comparison. The new one took the famous ticker, and the Cboe back-filled it to 1990 so that every chart you see today, including the one in chapter 7, uses a single consistent method.
The method has been tuned since. Weekly options were added to the calculation in 2014 so that the two expiries always sit close to the 30-day mark. And the family of S&P 500 gauges has grown in both directions along the calendar: VIX9D for nine days, VIX3M for three months, VIX6M and VIX1Y beyond that, and, since April 2023, VIX1D for a single day. Hold on to that last one. It matters in chapter 11.
Fear for Sale
Six months after the rebuild, on 26 March 2004, the first VIX futures traded in Chicago. Options on the index followed in February 2006. For the first time an investor could take a position on volatility itself, without owning a single share, and a fund manager could buy protection that paid out precisely when everything else in the portfolio was falling.
The real boom came after the 2008 crisis. In January 2009 Barclays listed VXX, a note that tracked VIX futures and could be bought in any brokerage account like a share. Dozens of imitators followed, including products that did the opposite and paid out when volatility fell. Volatility had become an asset class with retail distribution.
There was a catch that most buyers discovered the expensive way. You cannot buy the VIX itself, only futures on it, and those futures normally cost more the further out they expire. Traders call that upward slope contango. A fund holding them must keep selling cheaper near-dated contracts to buy dearer later ones, and it bleeds a little every day. Products that were long volatility lost most of their value over time. Products that were short volatility made money almost every day. You can guess which became popular.
Volmageddon: the crash that calm built
2017 was the quietest year the VIX has ever recorded. It closed below 10 on 52 separate days, having done so only nine times in the previous 27 years. Selling volatility looked like free money, and the most popular way to do it was an exchange-traded note with the ticker XIV (read it backwards). By January 2018 XIV held close to $2 billion, and together with its rivals the inverse products held roughly $3 billion.
Those products had a rule buried in the prospectus. To keep their exposure constant they had to buy VIX futures at the end of any day on which volatility rose. The more it rose, the more they had to buy.
On Monday 5 February the S&P 500 fell 4.1%, a bad day but hardly a historic one. The VIX went from 17.31 to 37.32, a rise of 116% and still the largest one-day percentage jump on record. Into the close the inverse funds needed to buy an enormous quantity of futures in a market where everybody knew they were coming. Prices gapped higher, which increased what they needed to buy, which pushed prices higher again. By the time after-hours trading settled, XIV had lost about 96% of its value. It was wound up two weeks later.
No bank failed. No economy stumbled. The S&P 500 was back at a record by August. The only thing that broke was the trade that had been betting nothing would break. The loop was the same one that sank portfolio insurance in 1987: a rule that makes everyone sell, or here buy, at the same instant.
Volmageddon gave the market a lesson it now has to keep in mind permanently. Once fear could be bought and sold, the gauge stopped being a passive observer. Positions built on the VIX can move the VIX. Long quiet spells attract sellers of volatility, their selling presses the index lower, the lower reading attracts more sellers, and the eventual snap is sharper because of the weight of money leaning the wrong way. The economist Hyman Minsky said it in four words decades before the index existed: stability is itself destabilising.
Screams and Silences
Thirty-six years of data, including the back-filled stretch before launch, give us about a dozen genuine panics and five or six long sleeps. Read them one at a time and they are war stories. Read them together and a pattern comes through that is more useful than any single episode.
The screams: what a spike portends
A spike is the market paying any price for protection. It marks maximum agreement that things will get worse, which is why it so often arrives near the moment they stop getting worse. The table shows what happened next each time.
| When | Peak close | What lit the fuse | What it portended, and how it panned out |
|---|---|---|---|
| Aug 1990 Back-filled | 36.47 | Iraq invades Kuwait. Oil doubles. America slides into recession. | S&P 500 fell about 20% and bottomed in October. The ground war in early 1991 lasted 100 hours, and the longest bull market of the century began from the low. |
| Oct 1997 | 38.20 | Asian currency crisis reaches Hong Kong. The Dow drops 554 points in a day. | A one-week event for US shares. New highs by December. It was a warning about emerging-market debt that came due ten months later. |
| Oct 1998 | 45.74 | Russia defaults. The hedge fund LTCM, carrying more than a trillion dollars of derivatives, has to be rescued by 14 banks. | The Fed cut rates three times in seven weeks. Shares hit records by November, and the easy money helped inflate the dot-com bubble. A spike can be cured so thoroughly that the cure causes the next one. |
| Sep 2001 | 43.74 | The 11 September attacks. Markets shut for four trading days. | Shares rallied 20% into year-end, then resumed the bear market already under way. The spike marked a tradable low, not the final one. |
| Jul to Oct 2002 | 45.08 | WorldCom and the tail end of the dot-com bust. The S&P 500 is down 49% from its 2000 peak. | Volatility stayed above 30 for months. This was capitulation at the end of a long decline, and the true bottom. The index doubled over the next five years. |
| Oct to Nov 2008 | 80.8620 Nov. Intraday record 89.53 on 24 Oct | Lehman fails. Money markets freeze. AIG and Citigroup are bailed out. | The exception that keeps traders humble. The VIX first crossed 30 in mid-September, and anyone who bought shares then was still under water a year later. The low came in March 2009, four months after peak fear. Then came a rally of more than 400% over eleven years. |
| May 2010 | 45.79 | Greece nears default. The "flash crash" wipes almost 1,000 points off the Dow in minutes. | A 16% correction that ended in July. First sign that the euro area, not America, would supply the next two years of shocks. |
| Aug 2011 | 48.00 | America loses its AAA credit rating. Italian and Spanish bond yields soar. | The S&P 500 fell 19% and bottomed in October. Odd footnote: Treasuries, the asset that had just been downgraded, rallied hard. In a panic, investors still ran to the dollar. |
| Aug 2015 | 40.74Intraday 53.29 | China devalues the yuan. The Dow opens down more than 1,000 points. | A 12% correction, retested in early 2016, then new highs by July 2016. A scare about growth, with no financial accident behind it. |
| Feb 2018 | 37.32 | Volmageddon. The short-volatility trade collapses under its own weight. | A 10% correction and a full recovery by August. A positioning accident, covered in chapter 6. |
| Mar 2020 | 82.69Record close, 16 Mar | Covid shuts the world economy. The S&P 500 loses 34% in 23 trading days. | The fastest bear market ever met the largest policy response ever. The low came on 23 March, one week after peak fear. Shares gained roughly 75% over the following twelve months. |
| Mar 2022 | 36.45 | Russia invades Ukraine while the Fed starts its fastest rate rises in forty years. | The bear market that never panicked. Shares fell 25% over nine months and the VIX never once closed above 37. The stress was in bonds, where the MOVE index reached 160. Remember this one. It is the closest cousin of today. |
| Aug 2024 | 38.57Intraday 65.73 | The Bank of Japan raises rates, a weak US jobs report lands, and trades funded in cheap yen unwind at once. | The quickest round trip on record. The VIX was back under 20 within about a week and shares hit new highs the following month. A flash, like 2018. |
| Apr 2025 | 52.33Intraday 60.13 | Washington announces sweeping tariffs. The S&P 500 falls almost 19% from its February high. | A 90-day pause on 9 April produced a 9.5% one-day rally, and shares were at records by late June. The notable part was the dollar, which fell alongside shares. More on that in chapter 9. |
| Mar 2026 | 31.05 | Confrontation with Iran and a squeeze on shipping through the Strait of Hormuz. Oil surges. | A drawdown of about 10% in the first quarter, then a 10.5% gain in April alone. The VIX halved by August. Oil, as we will see, did not calm down with it. |
Three kinds of scream come out of that list, and telling them apart is most of the skill.
The positioning accident
1997, 2018, 2024. Something crowded unwinds. No bank is in trouble and no recession follows.
- Tell: the VIX leaps but credit spreads and bond volatility stay quiet.
- Duration: days to weeks.
- Outcome: new highs within months.
The event with an off-switch
1990, 2001, 2011, 2015, 2025, early 2026. A war, a policy, a downgrade. Painful, but one decision can end it.
- Tell: a clear cause and a clear authority able to reverse it.
- Duration: one to three months.
- Outcome: falls of 10% to 20%, then recovery.
The plumbing fails
1998, 2002, 2008, 2020. Lenders stop trusting each other. Every volatility index in the family spikes together.
- Tell: the VIX stays above 40 for weeks, and bond, currency and credit gauges all confirm.
- Duration: months.
- Outcome: the best long-term entry points, but the first spike is rarely the low.
The rule of thumb that survives all fifteen cases is this. Buying shares when the VIX closes above 30 has, on most occasions, been rewarded handsomely over the next year. The two times it hurt, 2001 and 2008, were the two times the spike came early in a bear market that had further to run. A high VIX tells you fear is expensive. It takes the rest of the family to tell you whether the thing people fear has finished happening.
The silences: what a long calm portends
Now the other half, and the half that matters this week. Long stretches of low readings feel like safety. The record says they are when risk is being built.
| Period | How quiet | What built up in the quiet | How it ended |
|---|---|---|---|
| 1993 to early 1994 | 9.31low close. Five closes under 10 | Leveraged bets that interest rates would stay low, in hedge funds, bank treasuries and at least one Californian county. | The Fed's February 1994 rate rise. Bonds were massacred. Shares wobbled, the VIX only reached the low 20s, and the equity calm resumed. The damage was real but it was next door. |
| 2004 to mid-2007 | 9.89low close, Jan 2007 | The "Great Moderation". Mortgage credit, structured products and bank leverage all grew on the assumption that volatility had been tamed. | A 64% one-day VIX jump in February 2007 was the first crack, a quant-fund rout that August the second. Then 2008. From the lowest reading to the highest took 22 months. |
| 2017 | 9.14record low. 52 closes under 10 | The short-volatility trade itself, in exchange-traded form. | Volmageddon, February 2018. Three months from the record low to the record one-day jump. |
| Late 2019 to Feb 2020 | 11.5to 13 for months | Record share prices and record corporate borrowing. | Covid. Nobody can claim the calm caused a virus, but it did set the scale of the fall. Markets priced for perfection have the furthest to drop. |
| Mid-2023 to Jul 2024 | 11.9low close. Mostly 12 to 15 | Yen-funded positions and a boom in same-day options. | The August 2024 flash. Over in a week, because nothing systemic stood behind it. |
| May 2026 to now | 14.22026 low, in August | Record index levels carried by a narrow group of very large companies, at valuations seen once before. | Open. This is the subject of chapters 11 and 12. |
Be careful with the conclusion here, because a sloppy version of it does the rounds every time the VIX is low. Calm does not predict a crash on any timetable. The quiet of the mid-2000s lasted three years, and anyone who sold shares the first time the VIX touched 11 missed a 40% rally. The record since 1990 is plain on this: a VIX close between 12 and 15 has been followed by a rise of 20% or more in the index within twenty sessions less than half the time.
What a long calm does predict is fragility. Quiet markets invite borrowing, crowding and the selling of insurance, and each of those makes the eventual shock travel further. Low volatility is the condition in which large losses are prepared. It says nothing about the date they are delivered.
Relative Volatility
Here is the question a currency or commodity trader should be asking by now. The VIX is built from options on 500 American companies. Why should it say anything about gold, or the euro, or a barrel of oil? The straight answer is that it says something, but much less than its reputation suggests. That is why, market by market, the industry went and built each of them a gauge of its own.
The recipe was reusable. Once the 2003 formula existed, it could be pointed at any asset with a busy options market. The Cboe applied it to the Nasdaq and the Dow, then in 2008 to oil, gold and the euro. Eurex did the same for European shares, Hong Kong for the Hang Seng, India, Korea, Japan and Australia for their own indices. Bond traders already had theirs: Harley Bassman at Merrill Lynch had created the MOVE index for Treasuries in 1994, the very year the bond market showed why it needed one.
What follows is the family tree. The column to study is the last one, which says how tightly each relative has moved with the VIX.
| Index | What it measures | Since | Run by | How closely it tracks the VIX |
|---|---|---|---|---|
| The household: US shares | ||||
| VIX | S&P 500, next 30 days | 1993, rebuilt 2003 | Cboe | The reference point |
| VXN | Nasdaq-100. Technology's fear gauge | 2001 | Cboe | Very tight Moves almost in step, at a higher level. The gap between the two widens when tech is the worry. |
| VXD | Dow Jones Industrial Average | 2005 | Cboe | Very tight Usually a point or two under the VIX. |
| RVX | Russell 2000. Smaller US companies | 2006 | Cboe | Very tight Normally well above the VIX. A narrowing gap means risk is concentrating in big companies. |
| VIX1D, VIX9D, VIX3M | S&P 500 over one day, nine days and three months | 2023, 2013, 2007 | Cboe | Very tight The same market at different distances. Short above long means panic now. Long far above short means calm that the market does not trust. |
| VVIX | The volatility of the VIX itself, from VIX options | 2012 | Cboe | Leads Often turns up before the VIX does, because traders buy VIX calls ahead of trouble. |
| SKEW | How lopsided S&P 500 option prices are toward a crash | 2011 | Cboe | Loose Measures the shape of fear, not its size. Often highest when the VIX is low. |
| The cousins abroad: other share markets | ||||
| VSTOXX | Euro Stoxx 50. Europe's VIX | 2005 | Eurex / STOXX | Tight, about 0.8 Higher in crises. Long-run average near 23.5 against the VIX's 19.5. Studies find shocks travel from the VIX to VSTOXX far more than the other way. |
| VHSI | Hang Seng, Hong Kong | 2011 | Hang Seng Indexes | Moderate, about 0.5 Half New York, half Beijing. |
| Nikkei VI | Nikkei 225, Japan | 2010 | Nikkei | Moderate Led the world for once in August 2024. |
| A-VIX | S&P/ASX 200, Australia | 2010 | ASX | Moderate, about 0.6 |
| India VIX | Nifty 50 | 2008 | NSE | Loose, about 0.3 Driven mostly by domestic events such as elections and budgets. |
| VKOSPI | KOSPI 200, Korea | 2009 | KRX | Moderate |
| VXEEM | Emerging-market shares, via a US-listed fund | 2011 | Cboe | Tight It trades in New York hours, in dollars. |
| The in-laws: other asset classes | ||||
| MOVE | US Treasury yields across 2, 5, 10 and 30 years. Quoted in basis points | 1994 | ICE (created at Merrill Lynch) | Depends on the crisis Joins the VIX in systemic events. Runs far ahead of it when the problem is interest rates, as in 1994, 2022, the March 2023 bank failures and now. |
| OVX | Crude oil, via the US Oil Fund | 2008 | Cboe | Moderate Shares the big global shocks, ignores the rest. Typically in the low 30s. Hit 325 in April 2020 when oil futures went negative. |
| GVZ | Gold, via the SPDR Gold fund | 2008 | Cboe | Loose and unstable Typically around 18. Gold can be volatile because it is rising as a haven or because it is being dumped for cash. |
| VXSLV | Silver | 2011 | Cboe | Loose Gold's more excitable sibling. |
| EVZ | Euro against the dollar | 2008 | Cboe | Loose Driven by the gap between central banks more than by share-market nerves. |
| JPMorgan VXY, Deutsche Bank CVIX | Baskets of major currency pairs | 2006 to 2007 | The banks | Moderate in crises, loose otherwise Currency volatility tends to lag shares at the start of a panic. |
Tightness labels summarise published research and long-run behaviour: the St Louis Fed on VSTOXX, a CFA Institute review of global volatility indexes for Hong Kong, Australia and India. All of these relationships strengthen in global crises and weaken in local ones. Treat the figures as typical, not fixed.
So can the VIX be trusted as a guide to other markets?
Partly, and it helps to be precise about which part.
For other share markets, largely yes. American volatility is the world's anchor. Research on spillovers between these indexes keeps finding the same thing: shocks run outward from the VIX to Europe and Asia much more than they run back. A trader in the DAX or the Hang Seng who ignores the VIX is ignoring the weather system that most of their storms come from.
For bonds, gold, oil and currencies, only in a full-blown crisis. When the plumbing fails, as in 2008 or March 2020, every gauge in the family goes off at once and the VIX is as good a summary as any. In ordinary times, and in crises that begin outside the share market, these markets have their own causes and their own clocks. The VIX did not see the 1994 bond rout. It did not register the oil collapse of 2014. It gave no warning of gold's record and reversal this year.
As a forecaster, with heavy caveats. The level of the VIX mostly describes the present. The more useful signals are comparisons. One is the gap between the VIX and the volatility that actually occurs, which academic work by Tim Bollerslev and colleagues found explains a meaningful share of the following quarter's share returns. The other is the gap between the VIX and its relatives, and that is the idea this whole article has been walking toward.
If bond volatility is high and share volatility is low, somebody is wrong. If Europe's gauge sits far above America's, the trouble is regional. If gold's gauge is above the VIX, the metal is being repriced for reasons the share market has not noticed. Used as a set, these indexes become a map of where risk is being priced and where it is being ignored. That map is the real instrument.
Cross Winds
Traders love a simple rule. VIX up, dollar up. VIX up, gold up. VIX up, bonds up. Each of those is true often enough to be dangerous, because each fails in a specific and repeatable kind of crisis. The trick is to stop asking how gold correlates with the VIX and start asking what kind of fear this is.
There are four kinds, and each produces its own pattern across markets. Pick one.
Episodes: 2008 and March 2020.
What is happening: Lenders stop trusting each other and everybody needs cash, which in practice means dollars. Every gauge in the family goes off together.
How to read it: This is when the VIX is a good guide to everything, and when the old rules (dollar up, bonds up) work best. Expect gold to disappoint for the first week or two.
Episodes: The tariff shock of April 2025 is the clean example. The August 2011 downgrade was a partial one: gold surged, but Treasuries and eventually the dollar were still bought.
What is happening: The source of the fear is US policy or US credit, so the usual shelter is the thing investors doubt.
How to read it: The dollar falling as the VIX rises is the giveaway. Gold, the Swiss franc and the yen do the haven work the dollar normally does.
Episodes: 1994, 2022, and the pattern forming in autumn 2026.
What is happening: Inflation forces central banks to tighten. Bonds and shares fall together, so the standard portfolio has no cushion.
How to read it: The VIX is the last to know. In 2022 shares lost a quarter of their value without a single VIX close above 37, while MOVE reached 160. Watch bond volatility, not share volatility.
Episodes: Volmageddon in February 2018 and the yen unwind of August 2024.
What is happening: A crowded position is forced out. The VIX is the cause as much as the symptom.
How to read it: The rest of the family staying quiet is the tell. When only the VIX is screaming, the scream has usually been a buying opportunity within days.
The dollar: haven or suspect
In most panics the dollar rises with the VIX, and the reason is mechanical. A great deal of the world's borrowing is in dollars. When markets fall, borrowers and funds everywhere need dollars to repay loans and meet margin calls, and they sell whatever they hold to get them. In 2008 and in March 2020 the dollar index climbed sharply even though both crises had strong American roots.
April 2025 broke the pattern. The shock was a decision taken in Washington, and for several weeks shares, Treasuries and the dollar all fell together while the VIX closed above 50. That combination is normal for an emerging market in trouble. Seeing it in America was a warning that the dollar's haven status depends on what, exactly, investors are running from.
So the dollar index (DXY) gives a second reading that the VIX cannot. If both rise together, the world wants safety and still finds it in America. If the VIX rises while the dollar falls, the world is afraid of America itself. A currency trader should watch that pairing ahead of either number alone.
Gold: the haven that sometimes gets sold
Gold's relationship with the VIX is the loosest in the table, and there are two reasons for it. In the first days of a true liquidity panic gold is sold, because it is one of the few things that can still be sold. It dropped more than 20% during the worst of 2008 and about 12% in ten days in March 2020 before recovering to records. Once the scramble for cash passes, it tends to do very well.
The second reason is that gold's deeper driver is the real interest rate, meaning the bond yield after inflation, and beneath that the trust placed in paper money. Those can move with no share-market fear at all. In 2022 the VIX was elevated all year and gold fell about 20% from its March high, because yields and the dollar were rising. From the start of 2024 to January 2026 it went from about $2,050 to a record $5,589, mostly while the VIX dozed, on central-bank buying and worries about government debt. Since then it has fallen 26% while the Fed has gone back to raising rates. In none of those three moves did the VIX offer a clue.
For gold, then, the instruments to watch are its own gauge, GVZ, and the bond market's MOVE. A calm VIX tells you very little about what bullion will do next.
Bonds: the hedge that fails when you need it
For twenty years after 2000 the standard portfolio rested on one relationship: when shares fall and the VIX rises, Treasury bonds go up. It held in 2001, 2008, 2011 and 2020. It failed completely in 2022, and for a simple reason. Bonds protect against fear about growth. They cannot protect against fear about inflation and interest rates, because in that case bonds are the thing being sold.
This is why the MOVE index earns its place beside the VIX. When the two rise together, the crisis is general. When MOVE climbs alone, the trouble starts in rates and reaches shares later, more slowly, as a grind and not a crash. In March 2023 MOVE approached 200 several days before share volatility reacted to the failure of Silicon Valley Bank. Bond traders had seen the problem on bank balance sheets first.
Oil: its own weather
Oil volatility shares the VIX's biggest moments and little else. OVX responds to pipelines, cartels and warships. Its use to a share or currency trader is as an early reading on inflation. A sustained rise in OVX with oil prices climbing tends to feed into bond volatility within weeks, and from there into everything else. That chain is live right now.
Four Weathers
Everything so far can be folded into a routine that takes two minutes a day. Step one is to place the VIX in one of four bands, because markets behave differently in each. Step two is to check whether the rest of the family agrees. Agreement means the reading can be trusted. Disagreement is the signal.
What it feels like: Nothing happens, pleasantly. Dips are bought within days and selling volatility looks like easy income.
The risk: Leverage and crowding build unseen. Every major spike in the record began from this band.
What to do: Stay invested, hedge while it is cheap, and resist adding leverage because it feels safe. Share of trading days since 1990: roughly a third.
What it feels like: An ordinary market. Good and bad news both register.
The risk: Little that is specific to the regime. Direction comes from profits and rates.
What to do: Standard position sizes. Note which way the VIX is drifting inside the band. Arriving from below is a different message from arriving from above.
What it feels like: Headlines move prices. Good days are sold. Correlations between shares rise.
The risk: This band is where grinds happen. 2022 spent most of the year here.
What to do: Cut position sizes by a third to a half to keep risk constant. Use the patterns in chapter 9 to work out which kind of fear you are in before trusting any haven.
What it feels like: Screens are red, liquidity is thin and the news is uniformly bad.
The risk: Capitulating at the bottom, or buying a first spike that turns out to be early, as in September 2008.
What to do: Stop buying protection. Begin looking for entries in stages. The signal that the worst has passed is the one-month VIX falling back below the three-month.
The cross-check: five spreads worth a daily glance
| Compare | Normal state | What a break means |
|---|---|---|
| VIX against VIX3M one month against three | Three-month sits a few points higher | One-month above three-month: panic is here now, and historically closer to its end than its start. Three-month far above one-month: the market is calm today and does not expect to stay that way. |
| MOVE against VIX bonds against shares | Rise and fall together | MOVE rising alone: an interest-rate problem that shares have not priced. This has led share volatility in 1994, 2022 and 2023. |
| VXN against VIX tech against the market | VXN roughly a quarter higher | A widening gap: the risk is concentrated in the largest technology names, which are also the largest part of the index. |
| VSTOXX against VIX Europe against America | VSTOXX a few points higher | A wide gap: a regional problem. A VIX above VSTOXX is uncommon and says the trouble is American. |
| VIX against the dollar index | Rise together | VIX up with the dollar down: capital is leaving America, not sheltering in it. Seen in April 2025. |
The Calmest Sibling
Now apply the routine to this week. The VIX closed on Monday at 15.52, a whisker inside the normal band. The S&P 500 finished at 7,773.95, within 0.3% of its record, and the Nasdaq set a new closing high. By the Rule of 16 the options market expects daily moves of under one percent. On its own that reading says there is nothing to see.
Then look at the relatives. Monday itself offered a hint. Shares rose 0.7% and the VIX rose with them, which is not how a relaxed market behaves.
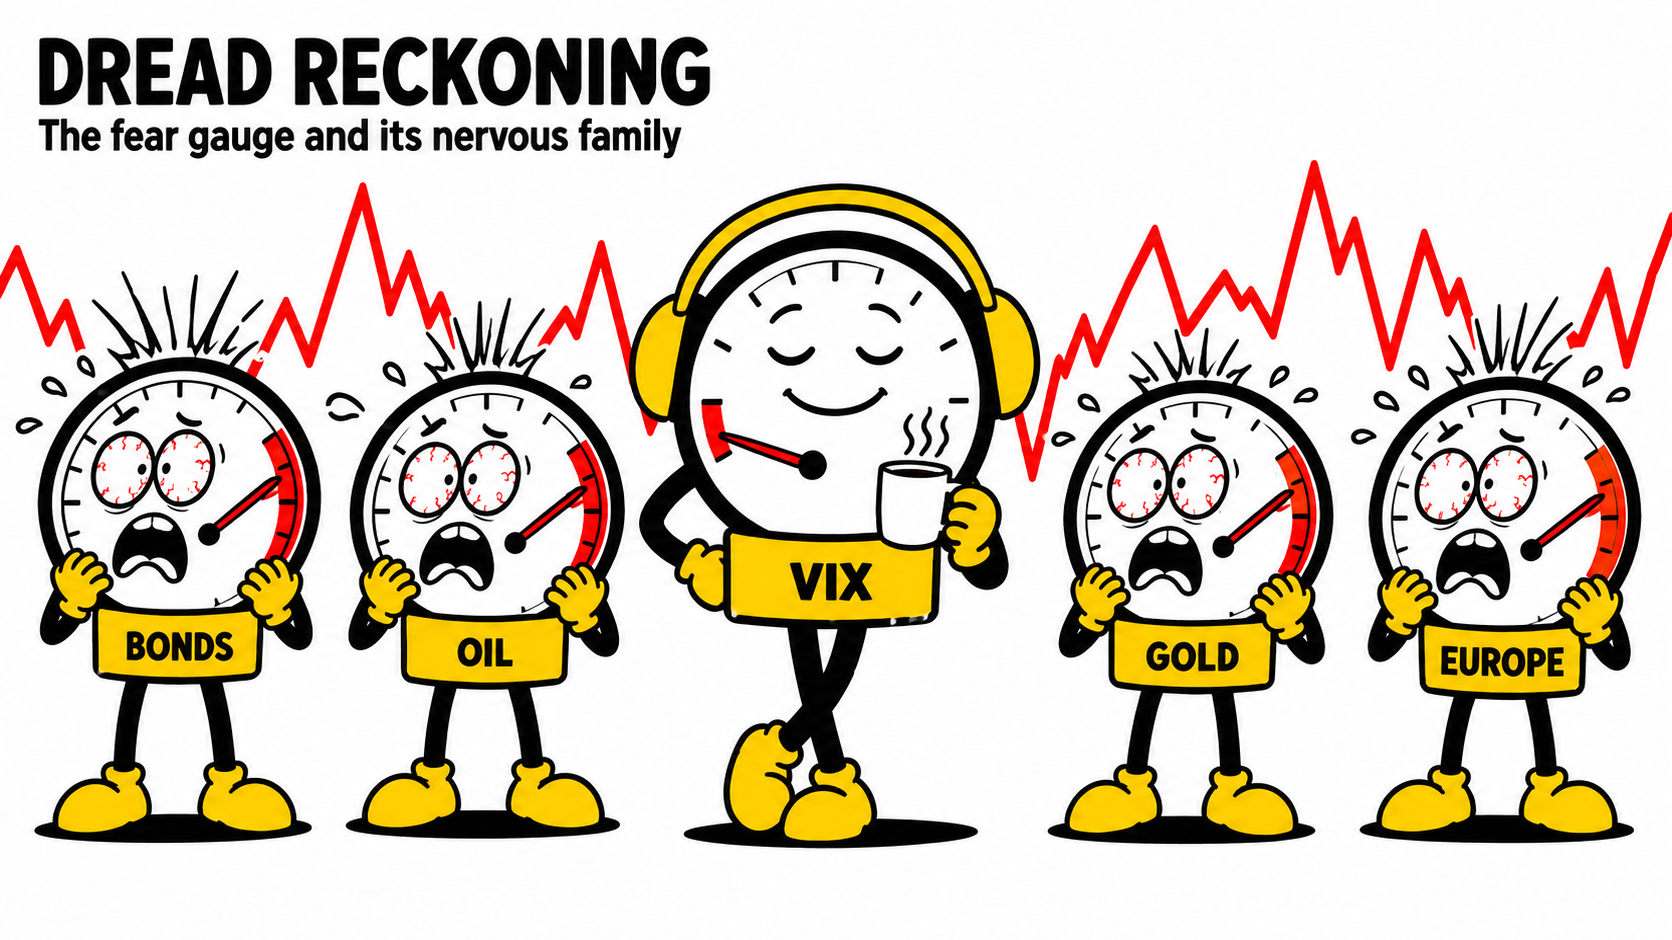
Share volatility is about a fifth below its long-run norm. Gold volatility is almost a third above its own. Oil volatility is more than half again above normal, with US crude near $89 and Brent around $100 after the spring's confrontation with Iran. Bond volatility has just had one of its sharpest monthly rises in two decades. Europe's gauge sits about five points above America's, with France stuck in a budget fight and the euro at a 17-month low. Among all its relatives, the VIX is the only one at ease.
How we got here
The year has had three acts. In January gold peaked at $5,589 and then cracked. In March the Iran confrontation sent the VIX to 31.05 and shares down about 10%, and April brought one of the strongest monthly rallies in years. Over the summer the VIX slid to a 2026 low of 14.2 while shares set record after record.
The third act is in the bond market. Inflation, pushed along by oil, has forced the Federal Reserve to reverse course. On 16 September, under its new chair Kevin Warsh, it raised rates by a quarter point to a range of 3.75% to 4.00%. The Bank of Japan is tightening as well, which is pulling Japanese money home from foreign bonds. The longest-dated Treasury funds have fallen to their lowest prices since they were launched. Last Friday's jobs report showed only 29,000 new jobs in September against 162,000 the month before, so the Fed is now raising rates into a slowing economy. Monday added a twist: a survey of service companies showed their costs rising at the fastest pace in more than four years. Futures now put the odds of another rate rise on 28 October at about one in five, down from two in three a week earlier.
Which kind of fear is this?
Go back to the four patterns in chapter 9 and the match is not subtle. Bond volatility leading. Yields and the dollar rising together. Gold falling in spite of geopolitical tension. Share volatility low and slow to react. That is the signature of a rates shock, the pattern of 1994 and 2022. It is the one kind of fear the VIX has always been last to register.
Valuation raises the stakes. The Shiller CAPE, which compares share prices with ten years of inflation-adjusted profits, stands at 41.38. It has been higher only at the top of the dot-com boom, when it reached about 44. Turned upside down, that ratio gives shares a long-run earnings yield of 2.4%. A 10-year Treasury pays 5.31%. Investors are being paid less than half as much to own the riskier asset, and the thing that makes that arrangement tolerable is a belief that profits, led by a handful of very large technology companies, will grow fast enough to close the gap. The wide VXN reading shows where the options market thinks the weak point in that belief sits.
Is the VIX itself reading low?
One more wrinkle. Options that expire the same day they are traded now make up a large share of all S&P 500 option volume, and none of that activity enters the VIX, which only looks at contracts with 23 to 37 days to run. Some strategists argue this pulls hedging demand away from the options the index measures and makes it read a little low. The Cboe's own research disputes that the effect is large, and it launched VIX1D in 2023 so that the same-day market has a gauge of its own. We treat this as an open question. Either way it is one more reason to read the term structure and the family, and not to lean on one number. When the VIX made its low in August, the three-month version stood at 18.46, almost 30% higher, one of the widest such gaps since 2009. Even the VIX's own options traders did not believe the calm.
Dead Ahead
A forecast that says volatility may rise or may fall is worthless, so here is a view with a direction. It rests on one judgement drawn from everything above: the present set-up is a rates shock that the share market has not yet priced. The base case that follows from it is a grind, in the style of 2022, and not a crash in the style of 2008 or 2020. In a grind, volatility does not explode. It steps up a regime and stays there.
These are the Dispatch Desk's working ranges, with what would prove them wrong. They are judgements, not statistics. Reference levels at the time of writing on 6 October: VIX 15.52, S&P 500 7,773.95, 10-year 5.31%, gold $4,140, dollar index 102.2.
| Horizon | VIXnow 15.52 | S&P 500now 7,773.95 | US 10-year yieldnow 5.31% | Goldnow $4,140 | Dollar indexnow 102.2 | The call |
|---|---|---|---|---|---|---|
| 30 days to early November | 15 – 21 | 7,450 – 7,850 | 5.10 – 5.45% | $4,000 – 4,350 | 101 – 103.5 | Vol drifts up Two dated risks sit inside the window: the Fed on 27 to 28 October and the US midterm elections on 3 November. Expect the VIX to spend more time above 17 than below it. Shares hold a range unless yields break above 5.45%. |
| One quarter to early January 2027 | 17 – 26 | 7,000 – 7,650 | 5.00 – 5.60% | $3,900 – 4,400 | 101.5 – 105 | Regime change to tense The gap between bond and share volatility closes from the share side. We look for a pullback of 6% to 9% from the record, led by technology, with the dollar firm and gold still under pressure while the Fed is tightening. |
| Six months to April 2027 | 18 – 30 | 6,700 – 7,500 | 4.70 – 5.50% | $4,200 – 4,900 | 99 – 104 | The grind Slowing jobs growth meets high rates. Yields peak during this window and begin to fall as the economy weakens. That is the turn for gold, which should lead the recovery, and for the dollar, which should top out. Shares trough later than bonds. |
| Two years to October 2028 | Avg 18 – 22 | 7,200 – 8,800 | 4.00 – 5.00% | $4,800 – 6,000 | 95 – 101 | Higher floor The sub-13 world of 2017 does not return while rates are this high and government borrowing this heavy. Shares recover but re-rate: returns come from profits, not from rising valuations. Gold retests its record. |
| Five years to 2031 | Avg 19 – 21 | 8,800 – 10,500 | 3.75 – 5.00% | $5,500 – 7,500 | 92 – 100 | Constructive, unevenly From a CAPE above 40, history argues for modest returns of roughly 3% to 6% a year. Expect the VIX to average close to its long-run 19.5 and to print above 40 at least once. It has done so in ten of the past 29 calendar years. |
What would prove this wrong
The soft landing
- MOVE falls back under 85 while the VIX stays put. The gap closes from the bond side.
- The 10-year yield drops below 5% without a growth scare.
- Oil slides under $80 and OVX returns to the 30s.
- The Fed signals that September's rise was the last.
- VXN narrows toward the VIX as profit growth broadens beyond technology.
The accident
- The 10-year breaks above 5.60% and a Treasury auction goes badly.
- The VIX one-month rises above the three-month and stays there.
- The VIX climbs while the dollar falls: the April 2025 pattern, on a larger scale.
- Funding markets strain. Watch use of the Fed's repo facility.
- VVIX above 120 with every gauge in the family rising together.
What to do with it
Buy insurance when it is cheap. At a VIX near 15, protection on the S&P 500 costs about a fifth less than its long-run average, at a moment when the bond market is telling you the risks are above average. Hedging is a thing to do in the silence. During the scream it costs two or three times as much.
Size positions to the regime you expect, not the one you are in. A position sized for daily moves of 1% is half as big again as it should be if the VIX moves to 24.
Watch the spread. If MOVE falls back and the VIX holds, the calm was right and this view is wrong. If the VIX rises to meet MOVE, the grind has begun. That single comparison will tell you more over the next quarter than any headline.
If panic does come, remember chapter 7. A VIX above 30 with the rest of the family confirming is a time to be looking for entries. The traders who do well out of volatility are the ones who prepared in the quiet and have cash and nerve left for the noise.
Short Answers
Can I trade the VIX directly?
Not the index itself. It is a calculation, not a security. What trades are VIX futures, options on those futures, exchange-traded products that hold the futures, and CFDs priced off them. All of these follow the futures, which can sit several points away from the index you see quoted. That gap is the most common source of surprise for new volatility traders.
Why do long-volatility products lose money over time?
Because VIX futures usually cost more the later they expire. A product that holds them has to keep selling the nearer contract and buying the dearer one, and that roll costs a little every day. Over a year of calm it can cost most of the investment. These are instruments for days or weeks, not for holding.
Is a very high VIX a signal to buy shares?
Usually, with one large exception. Buying after a close above 30 has paid well over the following year on most occasions since 1990. In 2008 the first close above 30 came six months before the low. The filter that separates the two is whether the rest of the family (bond volatility, credit, currencies) is still getting worse.
Is a very low VIX a signal to sell?
No. Calm can persist for years, as it did from 2004 to 2007. A low VIX is a signal that protection is cheap and that positioning is probably crowded. The sensible response is to hedge and to trim leverage. Betting on an imminent fall is a different trade and a much worse one.
I trade currencies. Which gauge should I watch?
Three, in this order. A currency volatility index (EVZ for the euro, or the JPMorgan and Deutsche Bank baskets) for the market's own pricing. MOVE, because interest-rate expectations drive exchange rates more than anything else. And the VIX together with the dollar index, for the haven test described in chapter 9.
I trade gold. Does the VIX help?
Only at the extremes. In a full liquidity panic gold tends to be sold first and bought later. Outside those moments its drivers are real yields and the dollar, so MOVE and gold's own gauge, GVZ, carry more information. A GVZ reading above the VIX, as now, says gold is being repriced for reasons the share market is not watching.
Has same-day options trading broken the VIX?
It has changed what the index captures. Same-day contracts fall outside its 30-day window. Whether that makes the VIX read low is argued over, and the Cboe's research says the effect is small. The practical answer is to look at VIX1D for today's risk, the VIX for the month and VIX3M for the quarter, and to pay attention when they disagree.
If I only have time for one comparison a day, which?
MOVE against the VIX. When they agree, trust the picture. When they part company, as they have this autumn, the one that moved first has usually been right.
This article is market commentary for information and education. It is not investment advice or an offer to buy or sell any instrument. Forward-looking ranges are the opinions of the Capital Street Dispatch Desk at the date of publication and will be wrong in ways we cannot foresee. Past patterns do not guarantee future results. CFDs and leveraged products carry a high risk of rapid loss.
Market levels are closing values for 5 October 2026 (VIX, S&P 500, 10-year yield, US crude), 2 October (VXN, GVZ, OVX), 1 October (VSTOXX) and late September (MOVE), with gold and the dollar index as quoted on the morning of 6 October. The Shiller CAPE is as of 2 October.