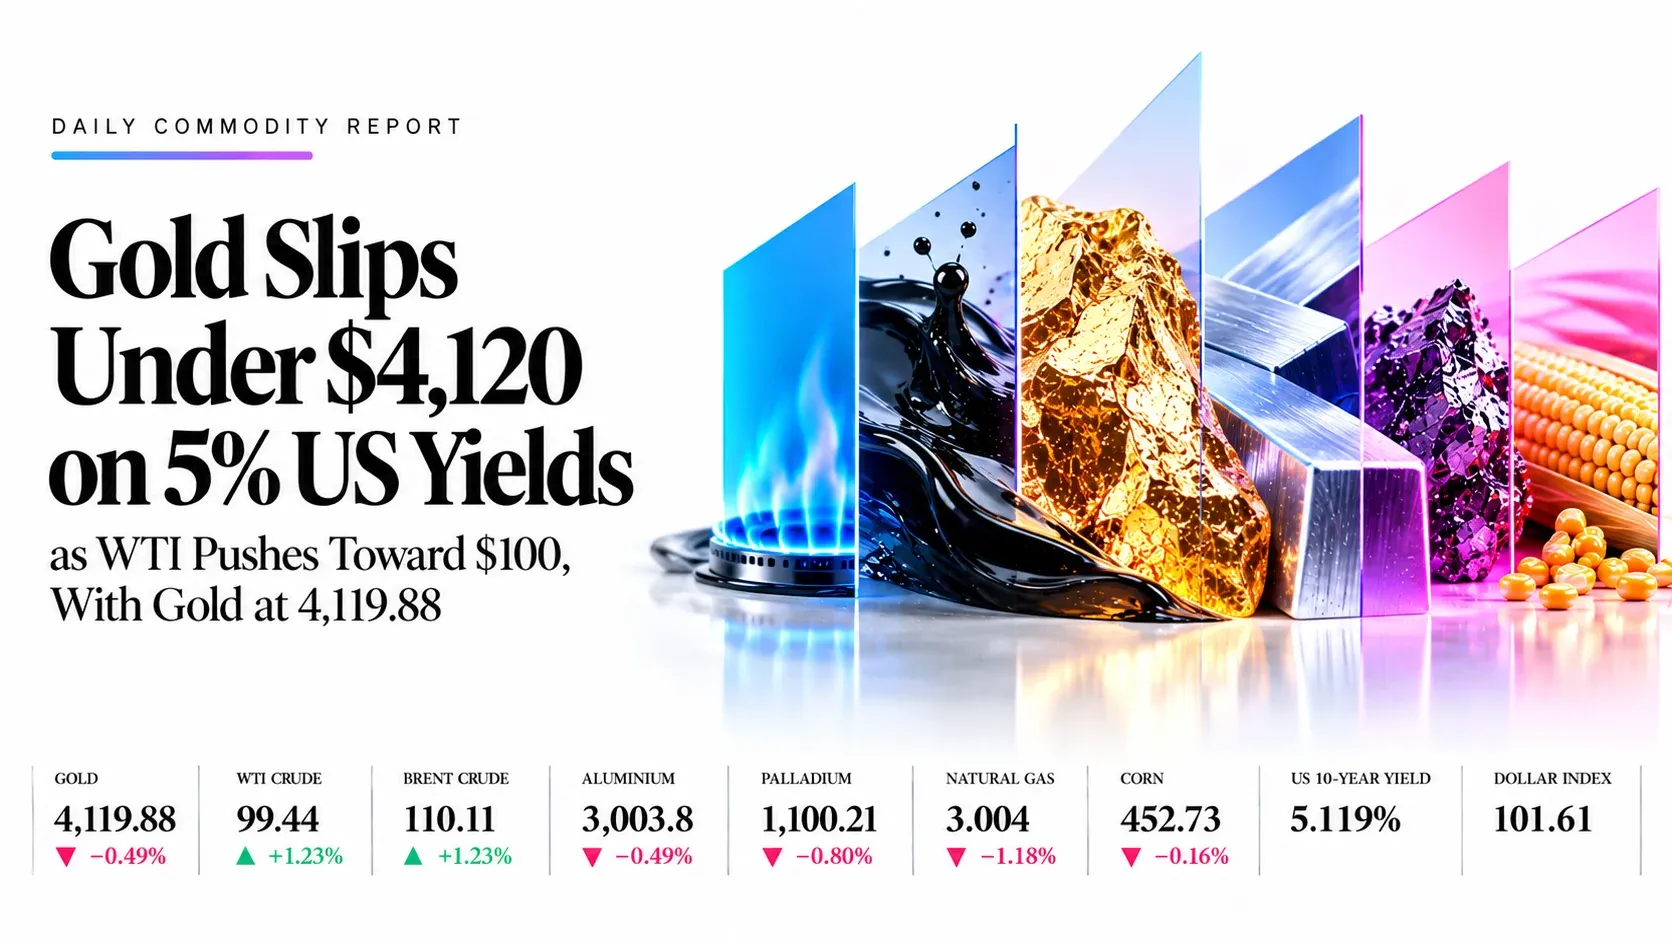
Gold Slips Under $4,120 on 5% US Yields as WTI Pushes Toward $100, With Gold at 4,119.88 | Technical analysis – Commodity Report | 20 Oct 2026
Commodities Today | Tuesday 20 October 2026
Gold Slips Under $4,120 on 5% US Yields as WTI Pushes Toward $100, With Gold at 4,119.88
Market Overview
Commodities split on Tuesday. At 08:10 GMT, WTI crude was 99.44 (+1.23%) with Brent near $110, while gold fell to 4,119.88 (−0.49%), aluminium to 3,003.8 (−0.49%), palladium to 1,100.21 (−0.80%), natural gas to 3.004 (−1.18%) and corn to 452.73 (−0.16%). The US 10-year yield is near 5.12%, the dollar index is about 101.6, and traders still price roughly an 89% chance of a Fed hike in December (Investing.com, FXStreet). The next catalysts are US housing starts at 12:30 GMT today, EIA crude stocks on Wednesday, EIA gas storage on Thursday and the Fed on 28 October. We read the session as an energy-led market where metals and grains stay heavy.
Key highlights
- Gold: Price is 4,119.88 under its 4,169.99 average; 5% yields and December hike bets cap rallies, with 4,073 the first floor.
- Crude oil: WTI is 99.44 above all three averages; Brent near $110 and Iranian tanker attacks keep supply risk priced in.
- Aluminium: Price is 3,003.8 after a triangle breakdown; LME cash fell from about $3,248 on 28 September to $3,107 by 5 October.
- Palladium: Price is 1,100.21 inside a falling channel; US duties on Russian metal add volatility, but the trend is down.
- Natural gas: Price is 3.004 at a channel floor; mild weather through 29 October and storage 45 Bcf above average weigh.
- Corn: Price is 452.73 and oversold (RSI 28.43) after USDA raised the yield to 181.2 bushels per acre.
What’s Moving Commodities Today
US yields near 5.1% and December hike bets weigh on gold
The 10-year yield is 5.119% and the dollar index is 101.61. Odds of an October hike have faded to about 16%, but a December hike is priced near 89%, and Fed Chair Warsh’s FOMC meets on 27–28 October. Gold has failed to rally even as inflation stays hot.
Brent holds near $110 on Middle East supply risk
Brent touched $109.99 overnight, a five-month high, after a 3.7% jump on 16 October, and traded at 110.11 at 07:07 GMT. Iranian tanker attacks and several conflicts keep supply risk priced in, while US Energy Secretary Wright said gasoline prices have peaked.
Mild weather and a storage surplus cap natural gas
Weather is forecast milder than normal through 29 October. Working gas rose 67 Bcf to 3,567 Bcf, below the 76 Bcf forecast, but stocks remain 45 Bcf above the five-year average. Front-month gas fell from a three-week high of 3.283 on 13 October.
LME aluminium retreats from late-September highs
LME cash aluminium fell from 3,248.5 on 28 September to 3,107 on 5 October after a drop of about $84 on 1 October. LME stocks eased to 238,875 tonnes on 7 October, and Indonesian smelter capacity is still being added.
US duties on Russian palladium keep the market volatile
The US set a 132.83% anti-dumping duty in April and a 109.1% countervailing duty in May on Russian palladium. Nornickel, with about 40% of supply, expects 2026 output of 2.415–2.465 million ounces, a 20-year low, yet price has fallen toward 1,100.
USDA’s larger crop pushes corn to an eight-week low
USDA raised the 2026/27 yield estimate to 181.2 bushels per acre from 178.5, production to 16.03 billion bushels and ending stocks to 1.849 billion, while lifting exports by 25 million bushels to 3.3 billion. Harvest was 23% complete as of 4 October.
Key Drivers Today
Five events that set direction for gold, crude oil, natural gas and the industrial metals. All times are GMT.
- US housing starts
- Sep
- Consensus 1.30M, prior 1.275M
- EIA crude inventories
- Weekly
- Usual release time; API data the night before
- EIA gas storage
- Weekly
- Last build 67 Bcf vs 76 Bcf forecast
- Flash PMIs
- Oct
- Eurozone, UK and US; read for metals demand
- FOMC decision
- 28 Oct
- Fed meets 27–28 Oct; December hike priced near 89%
Swipe the strip to see every driver.
Trade Setups for Today
Ranked by conviction and valid for today’s session. A 1-hour close beyond the stop cancels the idea.
| Instrument | Direction | Entry | Stop | Target 1 | Target 2 | Reward:risk | Conviction |
|---|---|---|---|---|---|---|---|
| Gold | Short | 4,160.00 | 4,215.00 | 4,075.00 | 3,998.00 | 1.5 / 2.9 | Medium |
| Aluminium | Short | 3,050.0 | 3,110.0 | 2,935.0 | 2,855.0 | 1.9 / 3.2 | Medium |
| Palladium | Short | 1,135.00 | 1,175.00 | 1,060.00 | 1,000.00 | 1.9 / 3.4 | Medium |
| Crude Oil | Long | 98.20 | 94.80 | 103.00 | 106.00 | 1.4 / 2.3 | Medium |
| Natural Gas | Long | 2.970 | 2.900 | 3.120 | 3.280 | 2.1 / 4.4 | Low |
| Corn | Short | 461.00 | 472.00 | 442.00 | 428.00 | 1.7 / 3.0 | Low |
Reward:risk is the distance from entry to each target divided by the distance from entry to the stop. Prices are read at 08:10 GMT on 20 October from TradingView charts; most entries sit away from the current price and need a pullback or a bounce to trigger. Corn is quoted in US cents per bushel on a CFD feed. Levels are conditional technical references, not recommendations.
Yield Scenario Analysis
US yields and the Fed path are the swing factors for gold and the metals, while Middle East supply risk drives oil. The Fed on 28 October is the next big test.
Yields surge: hawkish Fed repricing
Hot US data or hawkish Fed talk would push the 10-year yield higher and lift the dollar, adding pressure to gold and the industrial metals.
- Gold4,073, then 3,996
- Aluminium2,935, then 2,855
- Palladium1,055, then 1,000
Relief rally: yields ease and the dollar fades
Softer data and fading hike bets would let metals recover toward their short averages before sellers return.
- Gold4,170, then 4,243
- Aluminium3,097, then 3,192
- Palladium1,159, then 1,205
XAU/USD | Gold spot, TVC feed
Gold Analysis: Price Slips Toward the Floor of a Falling Channel as 5% Yields Bite
4,119.88 −20.22 (−0.49%) at 08:10 GMT Day range 4,115.75–4,147.21
Outlook: Bias is lower while 4,170 caps rallies. The US 10-year yield is near 5.12% and markets price about an 89% chance of a December Fed hike, so gold struggles despite sticky inflation; the 14 October low at 4,073 is the first test.
Key levels
- Support 2
- 3,996.00
- Support 1
- 4,073.00
- Resistance 1
- 4,170.00
- Resistance 2
- 4,243.00
- Price (4,119.88) is under the 4,169.99 average, which also sits at the channel roof; the 4,242.58 and 4,320.54 averages are stacked above.
- RSI 41.33 is just under its signal line at 41.53, a soft reading that favours selling bounces; the July low at 3,996 is the next floor below 4,073.
Setup: Short at 4,160.00, stop 4,215.00, targets 4,075.00 and 3,998.00. Reward:risk 1.5 / 2.9, medium conviction.
ALIUSD | Aluminium, Capital.com CFD
Aluminium Analysis: Triangle Breakdown Leaves Price Hovering Near $3,000
3,003.8 −14.8 (−0.49%) at 08:10 GMT Day range 2,996.8–3,029.8
Outlook: Bias is lower while 3,097 caps rallies. LME cash aluminium fell from about $3,248 on 28 September to $3,107 by 5 October, and the late-September triangle break has pushed price to its lowest since July.
Key levels
- Support 2
- 2,855.0
- Support 1
- 2,935.0
- Resistance 1
- 3,097.0
- Resistance 2
- 3,192.0
- Price (3,003.8) is well under the 3,097.0 average, with 3,191.7 and 3,228.6 above; the broken triangle floor near 3,200 now acts as resistance.
- RSI 33.58 is above its signal line at 31.27, a first bounce from near-oversold rather than a trend change; the October low near 2,935 is the first floor.
Setup: Short at 3,050.0, stop 3,110.0, targets 2,935.0 and 2,855.0. Reward:risk 1.9 / 3.2, medium conviction.
XPD/USD | Palladium, OANDA CFD
Palladium Analysis: Price Presses the Floor of a Falling Channel Near $1,100
1,100.21 −8.85 (−0.80%) at 08:10 GMT Day range 1,095.75–1,111.05
Outlook: Bias is lower while 1,159 caps rallies. US duties on Russian palladium (132.83% anti-dumping, 109.1% countervailing) add volatility, but price keeps sliding inside a channel that began at the late-August high.
Key levels
- Support 2
- 1,000.00
- Support 1
- 1,055.00
- Resistance 1
- 1,159.00
- Resistance 2
- 1,205.00
- Price (1,100.21) is under the 1,159.39 average and far below the 1,259.28 and 1,259.63 averages; the channel floor near 1,055 is the next test.
- RSI 34.96 is above its signal line at 33.07, a weak but stabilising reading; a close above 1,159 would be the first sign the channel is failing.
Setup: Short at 1,135.00, stop 1,175.00, targets 1,060.00 and 1,000.00. Reward:risk 1.9 / 3.4, medium conviction.
NG1! | Natural Gas Futures, NYMEX
Natural Gas Analysis: Price Tests the Floor of a Rising Channel Near $3.00
3.004 −0.036 (−1.18%) at 08:10 GMT Day range 2.999–3.046
Outlook: Bias is neutral to lower while 3.124 caps rallies. Weather stays milder than normal through 29 October and storage is 45 Bcf above the five-year average, though last week’s 67 Bcf build missed the 76 Bcf forecast; the next EIA report is on Thursday.
Key levels
- Support 2
- 2.850
- Support 1
- 2.958
- Resistance 1
- 3.124
- Resistance 2
- 3.300
- Price (3.004) sits on the 2.994 average with 2.958 just below and the 3.124 average above; the October high near 3.30 marks the channel roof.
- RSI 46.22 is under its signal line at 56.34, a fading reading; a close below the channel floor and 2.958 would open the August low near 2.85.
Setup: Long at 2.970, stop 2.900, targets 3.120 and 3.280. Reward:risk 2.1 / 4.4, low conviction.
USOIL | WTI Crude Oil, TVC feed
WTI Crude Oil Analysis: Price Pushes Toward the Roof of a Triangle Near $100
99.44 +1.21 (+1.23%) at 08:10 GMT Day range 98.04–99.75
Outlook: Bias is higher while 93.25 holds. Brent is near $110 after touching a five-month high, Iranian tanker attacks keep supply risk alive, and WTI is climbing toward the falling roof of a triangle that began at the March spike.
Key levels
- Support 2
- 91.38
- Support 1
- 93.25
- Resistance 1
- 103.50
- Resistance 2
- 106.50
- Price (99.44) is above the 93.25, 91.38 and 85.87 averages, all rising; the triangle roof near 103–104 and the September high near 106.5 are the targets.
- RSI 62.22 is above its signal line at 53.39, a firm but not overbought reading that favours buying dips; a drop under 93.25 would cancel the idea.
Setup: Long at 98.20, stop 94.80, targets 103.00 and 106.00. Reward:risk 1.4 / 2.3, medium conviction.
Corn vs USD | Corn CFD, Skilling feed
Corn Analysis: Oversold Price Sits Below a Broken Channel as the Harvest Grows
452.73 −0.74 (−0.16%) at 08:10 GMT Day range 451.27–453.22
Outlook: Bias is lower while 460 caps rallies. USDA’s October report lifted the 2026/27 yield estimate to 181.2 bushels per acre from 178.5, production to 16.03 billion bushels and ending stocks to 1.849 billion, which pushed futures to an eight-week low.
Key levels
- Support 2
- 426.00
- Support 1
- 442.00
- Resistance 1
- 460.00
- Resistance 2
- 468.78
- Price (452.73) is under the 468.78, 479.59 and 489.33 averages; the underside of the broken channel near 460 is the first resistance.
- RSI 28.43 is below its signal line at 35.41 and deeply oversold, so sharp bounces are likely; that is why conviction is low and entries sit on rallies.
Setup: Short at 461.00, stop 472.00, targets 442.00 and 428.00. Reward:risk 1.7 / 3.0, low conviction.
Conclusion
Energy is the strong corner today and everything else is heavy. We prefer buying WTI dips while 93.25 holds, selling rallies in gold, aluminium and palladium while yields stay near 5.1%, and treating natural gas and corn as lower-conviction ideas because the first sits on a channel floor and the second is oversold. The nearest risks are US housing starts at 12:30 GMT today, EIA crude stocks on Wednesday at 14:30 GMT, EIA gas storage on Thursday at 14:30 GMT, flash PMIs on Friday and the FOMC at 18:00 GMT on 28 October. A daily close above 4,170 on gold would challenge the bearish view.
Trade Gold, Aluminium, Palladium, Natural Gas, Crude Oil and Corn with Capital Street FX.
Frequently Asked Questions
Why is gold falling when inflation is high?
Gold pays no yield, so a 10-year Treasury yield near 5.1% and a December Fed hike priced near 89% raise the cost of holding it. Hot inflation is lifting yields faster than it is lifting demand for gold as a hedge.
Why is crude oil holding near $100?
Brent is near $110 after a five-month high, and Iranian tanker attacks and other conflicts keep Middle East supply risk priced in. A sharp diplomatic breakthrough or a drop in weekly EIA stocks would change that quickly.
What is holding natural gas near $3?
Weather is milder than normal through 29 October and storage is 45 Bcf above the five-year average, which limits heating demand. Last week’s smaller-than-expected 67 Bcf build gives bulls some support, so Thursday’s EIA report matters.
Does an oversold RSI mean corn will bounce?
An RSI near 28 shows selling has been heavy and a bounce is likely, but it does not stop a downtrend. A bigger USDA crop estimate and the harvest keep supply heavy, so rallies toward 460 are treated as selling chances here.