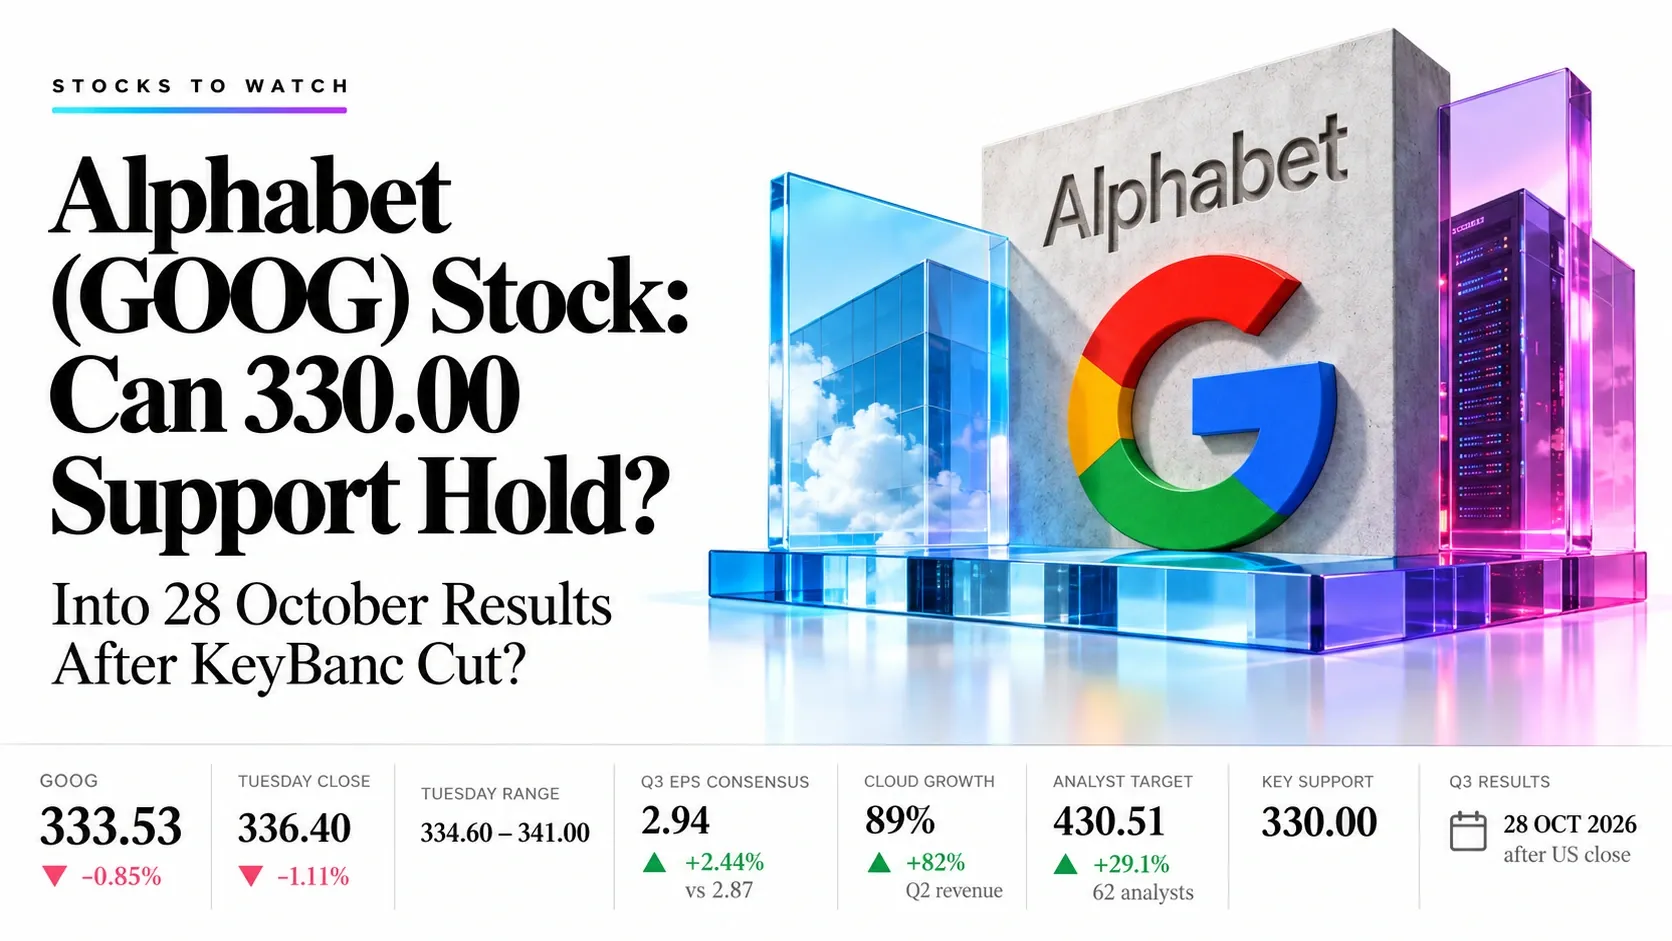
Alphabet (GOOG) Stock: Can 330.00 Support Hold Into 28 October Results After KeyBanc Cut?
Stocks to Watch Shares, earnings catalyst
Wednesday 21 October 2026
GOOG
Alphabet Inc. Class C Nasdaq, United States, communication services
333.53
-2.87 (-0.85%) pre-market at 12:59 GMT, Tuesday range 334.60–341.00
Tuesday close 336.40, -1.11% that session
Alphabet (GOOG) Stock: Can 330.00 Support Hold Into 28 October Results After KeyBanc Cut?
- Catalyst
- Q3 results, 28 October
- Status
- Pre-market, testing triangle support
- Desk sentiment
- +3, mildly bullish
- Next earnings
- 28 Oct 2026, after 20:00 GMT close
Desk Summary
Alphabet (GOOG) trades at 333.53 in pre-market at 12:59 GMT, down 0.85% after Tuesday’s 1.11% fall to 336.40, with price sitting on the rising line that anchors the triangle. Third-quarter results are due on 28 October after the US close, with consensus near 2.94 a share and Cloud growth near 89%, reported. Our preferred plan is a long inside 330.00–334.00 with a stop at 327.50. Answer: yes while 330.00 holds on a closing basis; a daily close below it opens 320.50.
Key highlights
- Catalyst: Q3 results on 28 October, after the US close
- Levels: Resistance 341.00–343.50 and 347.50–353.50; support 330.00–334.60 and 315.00–320.50
- Backdrop: Triangle apex close, RSI 44, averages above price
Alphabet Trade Setups: Long From 330.00, Short Below It
Plan A Buy the support Long, low conviction
Entry zone330.00–334.00
- Stop loss
- 327.50
- Target 1
- 341.00
- Target 2
- 347.50
- Reward:risk
- 2.0 and 3.4
Average entry 332.00, risk $4.50 a share. Triangle support meets Tuesday’s low at 334.60; the stop sits below the 330.00 band.
Plan B Short the breakdown Short, on confirmation
TriggerDaily close below 330.00
- Entry
- 329.50
- Stop loss
- 333.00
- Target 1
- 320.50
- Target 2
- 315.00
- Reward:risk
- 2.6 and 4.1
Risk $3.50 a share. A close under 330.00 breaks the rising line; the stop returns inside the band at 333.00.
Earnings risk: Results follow the 20:00 GMT close on 28 October and can gap past stops; both plans lapse at 20:00 GMT on 27 October.
Alphabet Sentiment Heat Map: Mildly Bullish, +3
Cloud growth
+82%Q2 revenue growth, $24.8bnAnalyst view
Strong Buy62 analysts, target 430.51Revenue
+24%12th double-digit quarterValuation
25.2xForward P/E, StockAnalysisTarget moves
MixedKeyBanc 410, BMO 480Momentum
RSI 44Neutral, not oversoldChart trend
Below averagesTriangle since August, apex nearSpending
$180–190bn2026 capex, plus equity raiseNet score +3 on a scale of −16 to +16. Each tile scores −2 to +2.
Catalyst File: Third-Quarter Results Due 28 October
| Results date | Wednesday 28 October, after the US close |
|---|---|
| Conference call | 20:30 GMT, 28 October |
| EPS consensus | About $2.94 a share, against $2.87 a year ago |
| Revenue consensus | Near $127bn, against $119.8bn in Q2 |
| Cloud growth | Consensus near 89%; one analyst reported at 93% |
| 2026 capex guide | $180–190bn; 2027 expected significantly higher |
| Analyst moves | KeyBanc cut target to $410; BMO raised to $480 |
Reaction Map: Cloud and Capex Decide 330.00 or 341.00
Cloud beat, capex steady
341.00, then 347.50
Plan A targets in play above 334.60
In line, range holds
330.00 to 341.00
Triangle edges guide entries; stay flat inside
Capex or margin miss
330.00, then 320.50
Plan B short on a daily close below 330.00
GOOG Chart: Triangle Support Near 333.00, Resistance 341.00
- Base: Symmetrical triangle since August; the rising line from the April low near 272 now runs close to 333.00.
- Averages: Shorter averages at 341.83 and 340.79 and the longer one at 347.45 sit above price; RSI(14) reads 44.03.
- Ceiling: The 341.00–343.50 band holds Tuesday’s high and the averages; 347.50–353.50 follows, with the falling line near 344.00.
Alphabet by the Numbers: Cloud Growth Against Heavy Spending
- Q2 revenue
- $119.8bn
- Up 24%, 12th double-digit quarter
- Google Cloud revenue
- $24.8bn
- Up 82% in Q2
- Operating margin
- 34%
- Up 2 points year on year
- Q3 EPS consensus
- About $2.94
- Q3 2025: $2.87
- 2026 capex guide
- $180–190bn
- 2027 expected higher still
- Equity raise
- $80bn
- Includes $10bn from Berkshire
Catalyst Calendar in GMT
21 Oct
US market open
28 Oct
FOMC statement, reported
28 Oct
US close, Alphabet Q3 results follow
28 Oct
Alphabet earnings conference call
Alphabet Company News Behind the Move
KeyBanc trims Alphabet target to $410
Target cut from $435, Overweight kept, on lower Google Services earnings estimates and a lower multiple on cloud chip profit. Benzinga, 19 Oct 2026
BMO lifts target to $480, names Alphabet Top Pick
Raised from $465 on the cloud growth outlook, with an Outperform rating maintained. Investing.com, 20 Oct 2026
Shares slip below $340 after failing above $355
Investors position for 28 October results, weighing legal challenges and rising compute costs, according to the report. FX Leaders, 20 Oct 2026
Alphabet Price Targets: Where the Street Sees the Stock
62 analysts polled by S&P Global rate Alphabet Strong Buy, with an average target of $430.51, 29.1% above 333.53; targets range from $340 to $515 (StockAnalysis).
Bottom Line
Yes, while 330.00 support holds
Alphabet reports third-quarter results on 28 October after the US close, with the stock testing the rising triangle line. Plan A buys 330.00–334.00 with a stop at 327.50 and targets at 341.00 and 347.50. A daily close below 330.00 cancels it and switches to Plan B toward 320.50, while a close above 343.50 would favour the 347.50 band.
Trade Alphabet and 2,000+ instruments with Capital Street FX.
Frequently Asked Questions
Why is Alphabet stock falling today?
Shares are 0.85% lower pre-market at 333.53 after Tuesday’s 1.11% fall, as investors weigh heavy spending and a KeyBanc target cut ahead of 28 October results.
What is the Alphabet trade setup?
Plan A is a long at 330.00–334.00 with a stop at 327.50, aiming for 341.00 and 347.50. Plan B shorts a daily close below 330.00.
How much did Alphabet earn in the second quarter of 2026?
Revenue rose 24% to $119.8bn and operating margin reached 34%. EPS was $9.11, lifted by a $98.0bn net gain on equity securities (company release).
When does Alphabet report its next earnings?
Alphabet reports third-quarter results on Wednesday 28 October 2026 after the US close at 20:00 GMT, with the conference call at 20:30 GMT.