Gold Drops to 4,060 as Oil Fuels Fed Hike Bets, and the Next Test Is the 4,000 Floor | Technical Analysis – Commodity | 22 Oct 2026
Commodities Today | Thursday 22 October 2026
Gold Drops to 4,060 as Oil Fuels Fed Hike Bets, and the Next Test Is the 4,000 Floor
Market Overview
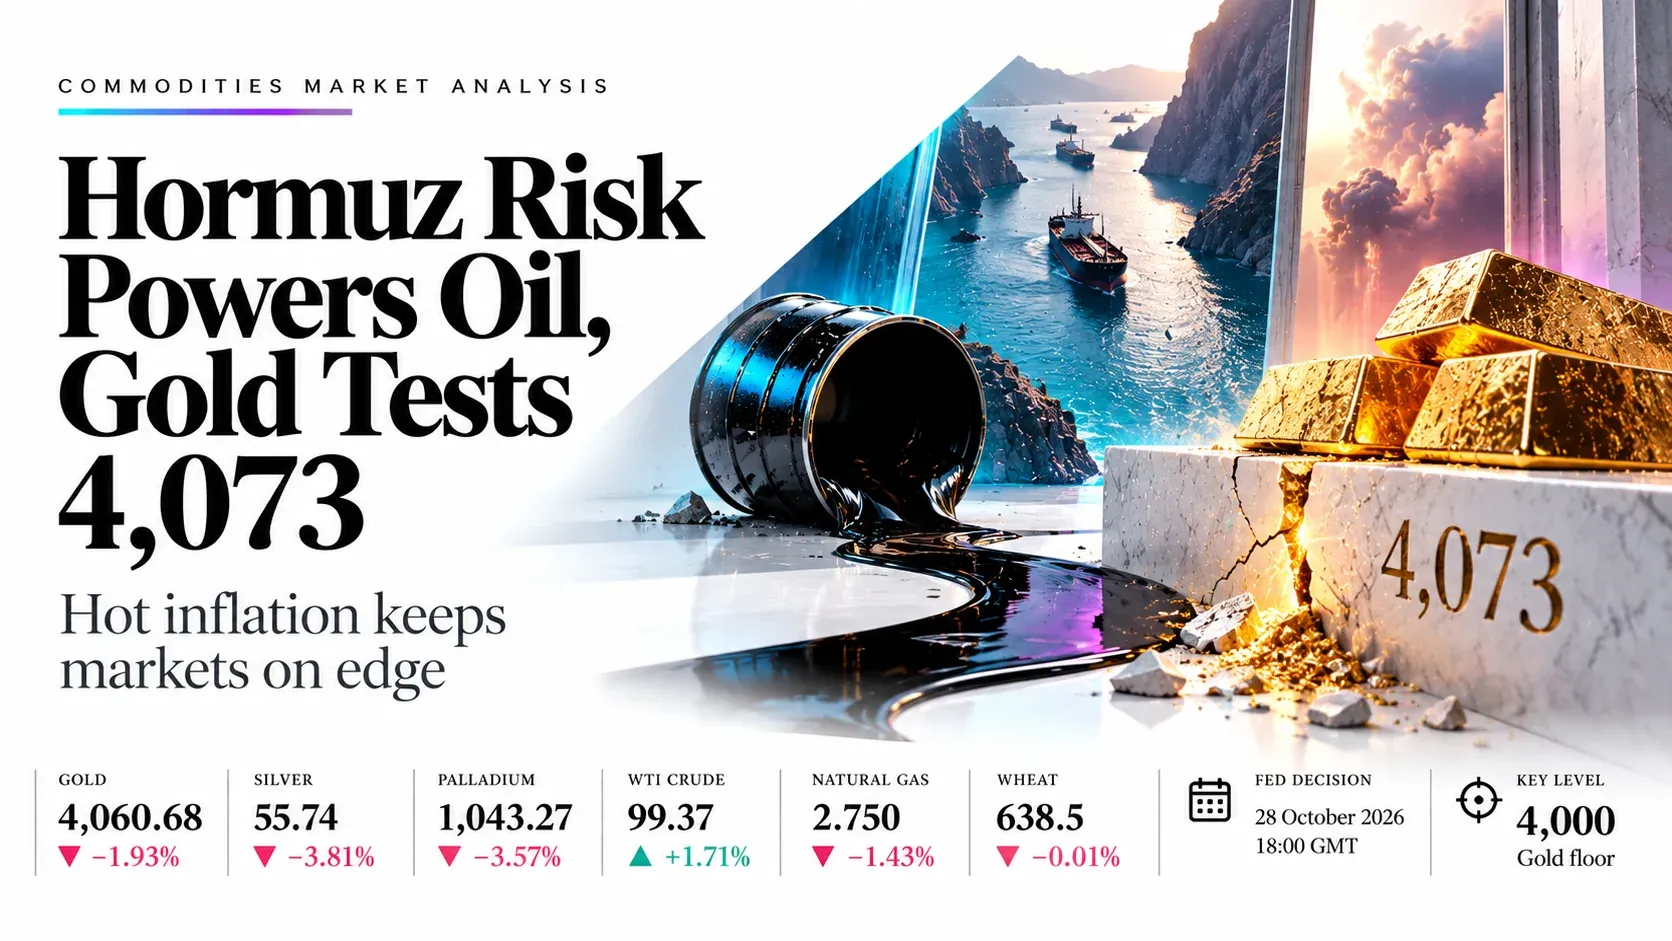
Metals fell hard on Thursday while crude oil rose. At about 11:56 GMT gold was 4,060.68 (−1.93%), silver 55.74 (−3.81%), palladium 1,043.27 (−3.57%), WTI crude 99.37 (+1.71%), natural gas 2.750 (−1.43%) and wheat 638.5 (−0.01%). Reuters reported that spot gold hit its lowest since 14 October by 05:30 GMT as higher oil prices revived the higher-for-longer rate view, and the slide has since extended below the 4,073 October low to a session low of 4,058. Brent touched $112.17 at 08:18 GMT, its highest since May, after Houthi strikes on Wednesday hit a Saudi airport and an Aramco oil field and the US ordered some diplomats to leave Saudi Arabia.
The rate outlook is the common thread for the metals. CME FedWatch currently shows about a 15% chance of a hike at the 27–28 October meeting and about 91% for December, after the Fed raised rates to 3.75%–4.00% in September; the Fed will announce its decision on 28 October at 18:00 GMT, and PCE inflation data will follow next week. Natural gas is under pressure from mild weather, and the EIA storage report, due at 14:30 GMT, is expected to show an 83 Bcf injection after 67 Bcf. Wheat fell to an 11-week low on Wednesday after US envoy Steve Witkoff met Vladimir Putin and the Kremlin agreed in principle to restart three-way talks, which would resume after 10 November, although Black Sea exports remain constrained. US jobless claims and USDA export sales are also due at 12:30 GMT today.
We read the session so far as a rate-driven sell-off in precious metals, a geopolitical bid in crude and a weather- and peace-talk-driven fall in gas and wheat. Gold, silver and palladium are all pressing falling-channel floors, wheat and palladium have oversold RSI readings that make a bounce likely, and WTI is at the roof of a triangle where Gulf headlines could break it either way.
Key highlights
- Gold: Price is 4,060.68 under the 4,152 average and the broken 4,073 low; 4,000 is the next floor, and RSI is 37.17.
- Silver: Price is 55.74 on a falling-channel floor under all three averages; RSI 35.28 and the gold/silver ratio near 72.9.
- Palladium: Price is 1,043.27 with RSI 28.52 oversold; 1,083 and the 1,139.5 average cap rallies.
- Crude oil: WTI is 99.37 at the triangle roof near 103 with Brent near $111; 93.67 is the key floor.
- Natural gas: Price is 2.750 after breaking a rising channel; the EIA storage report due at 14:30 GMT is the test and 2.70 the first floor.
- Wheat: Price is 638.5 near a channel floor with RSI 28.44 oversold; 670.3 caps rallies and hopes of Russia–Ukraine talks after 10 November drive the premium.
What’s Moving Commodities Today
Gold slips under its 14 October low as oil feeds rate-hike bets
Reuters reported spot gold down about 1.3% to $4,085 by 05:30 GMT, its weakest since 14 October, as higher oil prices stoked inflation worries and supported a higher-for-longer rate path. CME FedWatch pricing currently shows about a 15% chance of a hike at the 27–28 October meeting and about 91% for December, after the Fed raised rates in September to 3.75%–4.00%. The slide continued through the European morning to a low of 4,058, below the 4,073 level that Reuters analyst Wang Tao had named as the target; the Fed will announce its decision on 28 October at 18:00 GMT.
Houthi strikes on Saudi Arabia lift Brent to about $111–112
Brent reached $112.17 by 08:18 GMT, its highest since May, after Houthi attacks on Wednesday hit a civilian airport in Dammam and an Aramco oil field, killing at least three people, and the US ordered some diplomats and family members to leave its Saudi missions. A pipeline valve shutdown at Libya's Hamada and Tahara fields added to supply worries. Wednesday's settlements were Brent $108.82 and WTI $97.15; no major share of global supply has been confirmed lost, so much of the move is risk premium.
Silver and palladium fall about 3.5% with gold
Kitco showed silver at $55.84 (−3.48%), palladium at $1,037 (−3.36%) and platinum down 2.65% at 05:19 GMT, and Trading Economics has silver about 12.8% lower over the past month. Both metals extended those losses later in the morning (silver 55.74 and palladium 1,043 at 11:56 GMT). We found no new palladium-specific headline today; US duties on Russian palladium, finalised earlier this year, remain background volatility.
Natural gas sinks on mild weather before the EIA storage report
Natural Gas Intelligence said November futures fell below $2.80 on Wednesday as forecasts turned milder, and the 21 October slump left prices at their lowest since September. Today's EIA report, due at 14:30 GMT, is expected to show an 83 Bcf injection after 67 Bcf the week before, which was below forecasts. South Central salt storage is 35 Bcf under its five-year average, a reminder that winter supply is thinner than the headline price suggests.
Wheat extends losses on hopes of renewed Russia–Ukraine talks
CBOT December soft red winter wheat fell 2.3% on Wednesday to an 11-week low, according to UkrAgroConsult, and Bloomberg noted a fifth straight daily decline after US envoy Steve Witkoff met Russian President Vladimir Putin. Grain Central reported that the Kremlin agreed in principle to restart three-way talks after 10 November, which would be the first since February, although earlier rounds produced little. USDA has cut its 2026–27 US wheat export forecast to 750 million bushels, the second lowest since 1971–72, which also weighs.
Black Sea supply stays tight and funds may be near the end of their selling
Grain Central argues the 6–7% weekly drop reflects positioning rather than fundamentals: Ukraine's July–October wheat shipments are the lowest since 2011/12, Russia's southern terminals are effectively shut and SovEcon cut Ukraine's 2026/27 grain export forecast by 5.1 million tonnes. Jordan is tendering for 120,000 tonnes with offers due 27 October, and US export sales data, due at 12:30 GMT today, are expected near 400,000 tonnes.
Key Drivers Ahead
Six events that set direction for gold, silver, palladium, crude oil, natural gas and wheat. All times are GMT.
- US jobless claims
- 200K
- Thu 22 Oct, 12:30 GMT
- Forecast 200K after 199K
- USDA export sales
- ~400K t
- Thu 22 Oct, 12:30 GMT
- Wheat sales seen at 250K–550K t
- EIA natural gas storage
- 83 Bcf
- Thu 22 Oct, 14:30 GMT
- Forecast 83 Bcf after 67 Bcf
- FOMC decision
- 28 Oct
- Wed 28 Oct, 18:00 GMT
- Hold about 85% priced; December hike about 91%
- Nov natural gas expiry
- 28 Oct
- Wed 28 Oct
- Front month rolls to December; PCE data due the same week
- Russia–Ukraine–US talks
- 10 Nov
- After Tue 10 Nov
- Wheat risk premium; no concessions yet
Swipe the strip to see every driver.
Trade Setups for Today
Ranked in the order gold, silver, palladium, crude oil, natural gas and wheat, valid for today’s session and the Asian open. A 1-hour close beyond the stop cancels the idea.
| Instrument | Direction | Entry | Stop | Target 1 | Target 2 | Reward:risk | Conviction |
|---|---|---|---|---|---|---|---|
| Gold | Short | 4,100 | 4,165 | 4,000 | 3,950 | 1.5 / 2.3 | Medium |
| Silver | Short | 57.50 | 59.60 | 54.00 | 52.50 | 1.7 / 2.4 | Medium |
| Palladium | Short | 1,085 | 1,125 | 1,010 | 960 | 1.9 / 3.1 | Low |
| Crude Oil | Long | 97.00 | 93.30 | 102.50 | 106.50 | 1.5 / 2.6 | Medium |
| Natural Gas | Short | 2.88 | 3.00 | 2.70 | 2.50 | 1.5 / 3.2 | Medium |
| Wheat | Short | 660 | 677 | 625 | 600 | 2.1 / 3.5 | Low |
Reward:risk is the distance from entry to each target divided by the distance from entry to the stop. Prices are read at about 11:56 GMT on 22 October from TradingView daily charts; every entry sits away from the current price and needs a bounce or a pullback to trigger. The gold, silver and palladium shorts share the same rate-driven theme, so they are not independent trades. Levels are conditional technical references, not recommendations.
Risk Scenario Analysis
Fed hike pricing, Gulf headlines and the 14:30 GMT EIA gas report are the swing factors.
Hawkish Fed and an oil spike: higher yields, firmer hike odds and a bigger Gulf premium
More Saudi attacks would lift crude through its triangle roof, while higher yields would pressure the metals, gas and wheat.
- Gold4,000, then 3,950
- Silver54.00, then 52.50
- Palladium1,000, then 950
- Crude oil103.00, then 106.50
- Natural gas2.70, then 2.50
- Wheat620, then 600
Gulf calm and softer yields: lower oil, a smaller December hike chance and short covering
A calmer Gulf would pull oil back toward its averages and let oversold metals, gas and wheat bounce to their short averages.
- Gold4,073, then 4,152
- Silver57.50, then 59.43
- Palladium1,083, then 1,139.5
- Crude oil93.67, then 91.98
- Natural gas2.96, then 3.08
- Wheat660, then 670.3
Gold | XAU/USD, TVC feed
Gold Analysis: Price Breaks Under the 4,073 October Low and Sits Below All Three Falling Averages at 4,061
4,060.68 −80.07 (−1.93%) at about 11:56 GMT Day range 4,058.44–4,146.37
Outlook: Bias is lower while 4,152 caps rallies. Gold has slipped under its 14 October low as higher oil lifts inflation worries and keeps a December Fed hike priced above 90%, which outweighs Middle East safe-haven demand.

Key levels
- Support 2
- 3,950
- Support 1
- 4,000
- Resistance 1
- 4,073
- Resistance 2
- 4,152
- Price (4,060.68) is under the 4,152.15, 4,234.42 and 4,309.10 averages; the 4,152 average sits close to the channel roof, and the broken 4,073 October low is now the first ceiling, with Reuters analyst Wang Tao flagging 4,135 above it.
- RSI 37.17 is under its signal line at 41.66, weak but not yet oversold; a daily close under 4,000 would open the June–July lows near 3,930–3,960, while a close back over 4,152 would end the sell-off.
Setup: Short at 4,100, stop 4,165, targets 4,000 and 3,950. Reward:risk 1.5 / 2.3, medium conviction.
Silver | XAG/USD, TVC feed
Silver Analysis: Price Falls 3.81% to 55.74 and Presses the Floor of a Falling Channel Under Every Average
55.74 −2.21 (−3.81%) at about 11:56 GMT Day range 55.67–57.97
Outlook: Bias is lower while 59.43 caps rallies. Silver is falling faster than gold, so the gold/silver ratio has risen to about 72.9 from about 71.9 yesterday, and a firmer rate-hike outlook is cutting demand for metals that pay no yield.

Key levels
- Support 2
- 52.50
- Support 1
- 54.00
- Resistance 1
- 57.50
- Resistance 2
- 59.43
- Price (55.74) is under the 59.43, 62.64 and 63.29 averages; the channel floor near 54 and the October and July lows near 53–54 are the first support zone, and 57.50 is where Wednesday's bounce stalled.
- RSI 35.28 is under its signal line at 39.13, a soft reading that is close to oversold; a close under 54.00 would open 52.50, while a close above 59.43 would show buyers regaining control.
Setup: Short at 57.50, stop 59.60, targets 54.00 and 52.50. Reward:risk 1.7 / 2.4, medium conviction.
Palladium | XPD/USD CFD, OANDA feed
Palladium Analysis: Price Drops 3.57% to 1,043 Through Support With RSI Below 30 at 28.5
1,043.27 −38.57 (−3.57%) at about 11:56 GMT Day range 1,039.54–1,083.09
Outlook: Bias is lower while 1,139.5 caps rallies, but an oversold RSI means a bounce is likely before any new low. Palladium opened at 1,083 and has fallen through the session with the rest of the precious metals; no palladium-specific headline was found today.

Key levels
- Support 2
- 950
- Support 1
- 1,000
- Resistance 1
- 1,083
- Resistance 2
- 1,139.5
- Price (1,043.27) is under the 1,139.50, 1,248.83 and 1,254.60 averages and has dropped through the June–July lows near 1,130; today's open and high at 1,083 is the first resistance, and the 1,139.50 average is the next.
- RSI 28.52 is under its signal line at 32.65 and is below 30, so a squeeze is possible; a close under 1,000 would open 950, while a close above 1,139.5 would break the channel roof.
Setup: Short at 1,085, stop 1,125, targets 1,010 and 960. Reward:risk 1.9 / 3.1, low conviction.
WTI Crude Oil | CFD, TVC feed
Crude Oil Analysis: WTI Rises 1.71% to $99.37 and Presses the Roof of a Narrowing Triangle Near 103
99.37 +1.67 (+1.71%) at about 11:56 GMT Day range 97.72–100.09
Outlook: Bias is higher while 93.67 holds, with a cap near 103. Houthi attacks on Saudi targets pushed Brent to about $111–112, its highest since May, and the US ordered some diplomats to leave its missions in the kingdom.

Key levels
- Support 2
- 91.98
- Support 1
- 93.67
- Resistance 1
- 103.00
- Resistance 2
- 106.50
- Price (99.37) is above the 93.67, 91.98 and 86.03 averages; the triangle roof near 103 and the September high near 106–107 are the resistance, and the rising floor sits on the 91.98 average.
- RSI 61.92 is above its signal line at 54.74, firm but not overbought; a close over 103–104 would break the triangle upward, while a close under 93.67 would put the 92 floor in play. Reuters and Oilprice.com report no confirmed loss of a major share of supply, so much of the move is risk premium.
Setup: Long at 97.00, stop 93.30, targets 102.50 and 106.50. Reward:risk 1.5 / 2.6, medium conviction.
Natural Gas | NYMEX futures, TradingView feed
Natural Gas Analysis: Price Falls 1.43% to 2.750 After Breaking Below a Rising Channel and All Three Averages
2.750 −0.040 (−1.43%) at about 11:56 GMT Day range 2.726–2.789
Outlook: Bias is lower while 2.96 caps rallies, with the EIA storage report due at 14:30 GMT the main test. Mild weather and falling forecasts have driven the November contract below 2.80, though thin South Central stocks limit the downside.

Key levels
- Support 2
- 2.50
- Support 1
- 2.70
- Resistance 1
- 2.96
- Resistance 2
- 3.08
- Price (2.750) is under the 2.956, 2.984 and 3.083 averages; the 2.96–3.00 zone is also the underside of the broken channel, so it is the first place sellers may return.
- RSI 35.75 is under its signal line at 53.93 and falling; the August lows near 2.70 are the first floor, and a close under them opens the April low near 2.50, while a build above the forecast 83 Bcf in the 14:30 GMT report would add to the pressure.
Setup: Short at 2.88, stop 3.00, targets 2.70 and 2.50. Reward:risk 1.5 / 3.2, medium conviction.
Wheat | CFD, FOREX.com feed
Wheat Analysis: Price Holds 638.5 Near the Floor of a Falling Channel With RSI Oversold at 28.4
638.5 −0.1 (−0.01%) at about 11:56 GMT Day range 636.0–640.8
Outlook: Bias is lower while 670 caps rallies, but a bounce is likely first. Wheat has fallen for several sessions as hopes grow that Russia–Ukraine talks will restart after 10 November, though traders call the 6–7% weekly drop positioning rather than a change in supply.

Key levels
- Support 2
- 600
- Support 1
- 620
- Resistance 1
- 660
- Resistance 2
- 670.3
- Price (638.5) is under the 670.3, 681.3 and 708.4 averages; the channel floor near 620 and the 600 round number are the support, and the 660 breakdown area and the 670.3 average are the supply.
- RSI 28.44 is under its signal line at 39.19 and oversold, so a relief bounce is likely; a close under 620 would open 600, while a close above 681 would cancel the downtrend. This CFD quotes above the December CBOT futures (about 628 on Investing.com's cached page).
Setup: Short at 660, stop 677, targets 625 and 600. Reward:risk 2.1 / 3.5, low conviction.
Conclusion
Gold, silver and palladium are all pressing falling-channel floors, so the key question today is whether the floors hold. We prefer selling gold bounces under 4,165, silver under 59.60 and palladium under 1,125, treating the palladium idea as lower conviction because its RSI is already below 30. We also prefer selling natural gas bounces under 3.00 after its channel break, buying WTI pullbacks toward 97 while the 93.67 average holds, and treating the wheat short at 660 as lower conviction because RSI 28.44 argues for a bounce first. The nearest risks are US jobless claims and USDA export sales due at 12:30 GMT, the EIA gas storage report due at 14:30 GMT, the FOMC decision due on 28 October at 18:00 GMT and the Russia–Ukraine talks expected after 10 November. A daily gold close over 4,152 or a WTI close under 93.67 would end the main setups.
Trade Gold, Silver, Palladium, Crude Oil, Natural Gas and Wheat with Capital Street FX.
Frequently Asked Questions
Why is gold falling below $4,100?
Higher oil is feeding inflation worries, so traders price about a 91% chance of a Fed hike in December and see rates staying higher for longer, which makes non-yielding gold less attractive. Spot gold has broken under its 14 October low near 4,073 and the chart low is 4,058, with 4,000 the next round-number support.
Why is crude oil rising toward $100?
Houthi attacks on a Saudi airport and an Aramco oil field, a US order for some diplomats to leave Saudi Arabia and a Libyan pipeline-valve shutdown pushed Brent to about $111–112. WTI at 99.37 is testing the triangle roof near 103, and a close above it would be a bullish break.
Is wheat oversold, and where is support?
RSI of 28.44 is oversold after a 6–7% weekly fall, so a bounce is likely. The channel floor near 620 and the 600 round number are the next supports, while the 670.3 average is the first big cap.
How will the EIA report move natural gas today?
The EIA will publish its report at 14:30 GMT, with an 83 Bcf injection forecast after 67 Bcf. A larger build would confirm the mild-weather, weak-demand story and could push price toward 2.70, while a smaller one would lift it toward the 2.956 average.
How does the 28 October Fed meeting affect gold, silver and palladium?
A hold is expected, but a hawkish message that confirms a December hike would lift yields and the dollar and could send gold toward 4,000, silver toward 54.00 and palladium toward 1,000. A cautious tone would let the metals bounce to their short averages at 4,152, 59.43 and 1,139.5.