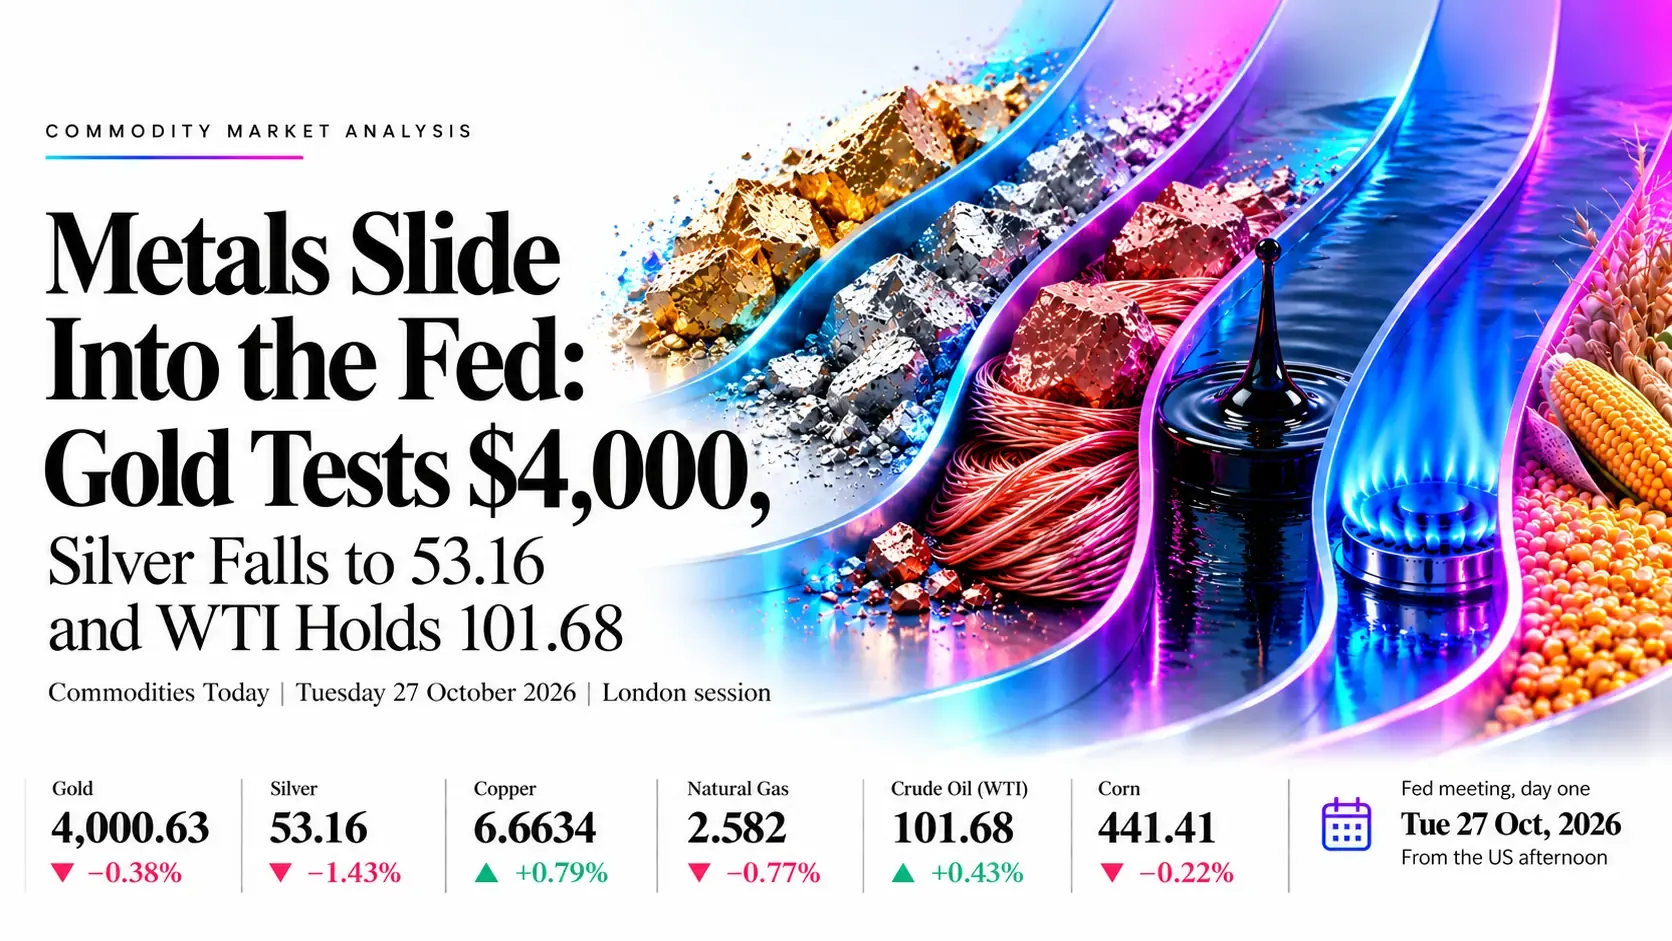
Metals Slide Into the Fed: Gold Tests $4,000, Silver Falls to 53.16 and WTI Holds 101.68 | Technical Analysis – Commodity Report | 27 Oct 2026
Commodities Today | Tuesday 27 October 2026 | London session
Metals Slide Into the Fed: Gold Tests $4,000, Silver Falls to 53.16 and WTI Holds 101.68
Market Overview
The London session opens with commodities split in two: bullion, gas and grains are being sold, while crude oil and copper hold their ground. As of about 09:15 GMT, silver is the weakest at 53.16 (−1.43%) after closing under 54 for the first time in 2026, and gold is pressing the 4,000 line at 4,000.63 (−0.38%). Natural gas at 2.582 (−0.77%) and corn at 441.41 cents (−0.22%) sit near their recent lows with RSI at 30.40 and 23.64, while copper at 6.6634 (+0.79%) and WTI at 101.68 (+0.43%) are the firm spots of the morning.
A dollar near a multi-day high and the Fed meeting that begins later today are driving the metals lower. The Houthi threat to Saudi supply keeps a floor under crude despite Monday’s Tehran talks, with Brent near 114.70. US durable goods at 12:30 GMT and consumer confidence at 14:00 GMT are the next tests, and the Fed decision follows tomorrow at 18:00 GMT, so positioning is likely to set the tone until then.
Key highlights
- Silver: Price is 53.16 on the floor of a falling channel with RSI 30.26; 52.67 is the key support.
- Copper: Price is 6.6634, back inside a rising channel and testing the 6.6788 average.
- Gold: Price is 4,000.63 under three falling averages; 3,989 and 3,900 are the supports.
- Natural gas: Price is 2.582 near six-month lows with RSI 30.40 oversold.
- Crude oil: Price is 101.68 at the falling triangle roof near 104 to 105.
- Corn: Price is 441.41 cents with RSI 23.64 deeply oversold under three averages.
What’s Moving Commodities Today
Gold slips toward $4,000 and silver falls 1.4% as the dollar firms ahead of the Fed
Spot gold eased to about 4,007 in Asia and trades near 4,000 on the chart feed, while silver slid to about 53.5 and then 53.16. The dollar is near a multi-day high, and the Fed’s two-day meeting starts today with a hold priced near 86% to 90%; the rate stands at 3.75% to 4.00% after September’s hike.
Crude eases on Tehran talks while Houthi attacks keep a risk premium
Brent is near 114.70 and WTI near 100.8 on wire quotes after talks between Saudi, Turkish, Pakistani and Iranian officials in Tehran, with Qatar also mediating. Houthi attacks on Saudi Arabia limit the drop, and Brent topped 117 in recent sessions, its highest since April.
Natural gas hovers near 2.58 after a 4% slide to a six-month low
US gas fell on Monday on milder forecasts and is down about 21% over seven sessions, with the front month oversold for a fourth day. Above-normal temperatures are forecast across the eastern US, and speculators hold their largest net short since February 2024.
Corn trades near 441 cents as the harvest weighs
Dec futures lost 1 cent to 4.55 dollars on Monday, and the harvest was 60% complete on Sunday, six points behind the average. Export commitments are about 34% under last year, while soybeans are supported by Chinese buying.
Copper climbs 0.8% to 6.6634 on Chinese demand
LME three-month copper is near 14,360 dollars a tonne, and the Yangshan premium, a gauge of Chinese import demand, is at its highest since 2014. Rising LME stocks and high energy costs cap the gains.
Gold-silver ratio near 75 as silver leads the slide
Silver is down about 9% over recent sessions against roughly 3% to 4% for gold, which pushed the ratio to a multi-month high. Rate-hike bets tied to oil-driven inflation are the main weight on both metals.
Key Drivers for the Rest of Today
Seven things that set direction for the rest of the session in silver, copper, gold, natural gas, crude oil and corn. All times are GMT.
- Tehran talks and Houthi attacks
- Ongoing
- Any time
- Headlines swing crude oil first, then gold through inflation and Fed bets
- Dollar near multi-day high
- Ongoing
- Any time
- A firm dollar weighs on gold, silver, copper and corn
- US durable goods
- 12:30
- Tue 27 Oct, 12:30 GMT
- September orders; a strong print lifts the dollar and yields
- Consumer confidence
- 14:00
- Tue 27 Oct, 14:00 GMT
- Conference Board index for October
- Fed meeting, day one
- Today
- From the US afternoon
- No decision until Wed 18:00 GMT; positioning and yields drive late flows
- API crude inventories
- 20:30
- Tue 27 Oct, 20:30 GMT
- Private stock estimate; a draw would back WTI near the 104 roof
- Mild weather and harvest
- Ongoing
- Any time
- Warm forecasts weigh on natural gas; harvest pace weighs on corn
Swipe the strip to see every driver.
Trade Setups for Today
Ranked in the order silver, copper, gold, natural gas, crude oil and corn, valid for the rest of today’s session. A 1-hour close beyond the stop cancels the idea.
| Instrument | Direction | Entry | Stop | Target 1 | Target 2 | Reward:risk | Conviction |
|---|---|---|---|---|---|---|---|
| Silver | Long | 52.50 | 51.50 | 54.80 | 57.00 | 2.3 / 4.5 | Low |
| Copper | Long | 6.5800 | 6.4900 | 6.7500 | 6.8800 | 1.9 / 3.3 | Medium |
| Gold | Short | 4,075 | 4,125 | 3,990 | 3,900 | 1.7 / 3.5 | Medium |
| Natural Gas | Long | 2.520 | 2.420 | 2.800 | 2.950 | 2.8 / 4.3 | Low |
| Crude Oil (WTI) | Short | 103.80 | 106.30 | 99.80 | 95.25 | 1.6 / 3.4 | Medium |
| Corn | Short | 453.00 | 463.00 | 438.00 | 431.00 | 1.5 / 2.2 | Low |
Reward:risk is the distance from entry to each target divided by the distance from entry to the stop. Prices are feed prices from the daily charts at about 09:12 GMT on 27 October; corn is in US cents per bushel. Every entry sits away from the current price and needs a pullback or a bounce to trigger, and the US data at 12:30 and 14:00 GMT can gap prices through them. Levels are conditional technical references, not recommendations.
Risk Scenario Analysis
US durable goods at 12:30 GMT, consumer confidence at 14:00 GMT and Middle East headlines are the swing factors for the rest of today.
Strong US data and a firm dollar: higher yields, rate-hike bets and pressure on metals and grains
Firm durable goods and confidence readings would back a hawkish Fed tone, lift yields and the dollar, and push bullion and copper to their lower supports. Natural gas stays driven by weather.
- Silver52.67, then 50.00
- Copper6.5449, then 6.40
- Gold3,989, then 3,900
- Natural Gas2.50, then 2.35
- Crude Oil100.00, then 95.24
- Corn438, then 431
Soft US data and a weaker dollar: lower yields and a relief bounce in oversold markets
Weak orders or confidence would ease rate-hike bets and let oversold silver, gold, gas and corn recover toward resistance, while a Houthi strike on Saudi sites would add to crude.
- Silver55.00, then 58.10
- Copper6.6788, then 6.80
- Gold4,035, then 4,122
- Natural Gas2.80, then 2.95
- Crude Oil104.50, then 107.00
- Corn453, then 464.6
Silver | TVC feed
Silver Analysis: Price Presses the Floor of a Falling Channel With RSI Deeply Oversold
53.16 −0.77 (−1.43%) at about 09:15 GMT Previous close 53.93
Outlook: Bias is lower while 55.00 caps rallies, but the move is stretched. Silver is down about 1.4% near 53.16 after its first close under 54 in 2026, and it is the weakest metal on the screen as a firmer dollar and rate-hike risk weigh into the Fed meeting.

Key levels
- Support 2
- 50.00
- Support 1
- 52.67
- Resistance 1
- 55.00
- Resistance 2
- 58.10
- Price (53.16) is far under the 58.10 short average and the 62.02 and 62.59 averages, so every bounce meets supply; the gold-silver ratio near 75 shows silver lagging gold.
- RSI 30.26 is at the oversold line and under its signal at 36.76; a close under 52.67 targets 50.00, while a recovery over 55.00 opens 58.10.
Setup: Long at 52.50, stop 51.50, targets 54.80 and 57.00. Reward:risk 2.3 / 4.5, low conviction. This is a counter-trend bounce from the channel floor and needs a 1-hour close back over 53.50 to confirm; a 1-hour close under 51.50 cancels it.
Copper | Capital.com feed
Copper Analysis: Price Recovers Back Into a Rising Channel and Meets the 6.6788 Average
6.6634 +0.0525 (+0.79%) at about 09:15 GMT Previous close 6.6109
Outlook: Bias is neutral to higher while 6.5449 holds. Copper is up 0.8% near 6.6634 after reclaiming the channel floor, helped by firm Chinese import demand, but a stronger dollar and high energy costs keep gains capped under 6.6788.

Key levels
- Support 2
- 6.4000
- Support 1
- 6.5449
- Resistance 1
- 6.6788
- Resistance 2
- 6.8000
- Price (6.6634) sits between the 6.6788 and 6.6553 averages and above the 6.5449 long average, so the zone is the pivot for the session.
- RSI 50.67 is just above its signal at 48.69, a neutral reading; a close over 6.6788 targets 6.80, while a close under 6.5449 puts 6.40 in play.
Setup: Long at 6.5800, stop 6.4900, targets 6.7500 and 6.8800. Reward:risk 1.9 / 3.3, medium conviction. A dip to the channel floor and the 6.5449 average is the entry; a strong dollar after US data would hurt this idea, and a 1-hour close under 6.4900 cancels it.
Gold | TVC feed
Gold Analysis: Price Tests the $4,000 Level Inside a Falling Channel Under Three Falling Averages
4,000.63 −15.20 (−0.38%) at about 09:15 GMT Previous close 4,015.83
Outlook: Bias is lower while 4,122 caps rallies. Spot gold is near 4,000 after a sharp slide, held back by a firmer dollar near a multi-day high and bets that the Fed could lean hawkish; Tastylive’s Ilya Spivak says a break of 3,900 would open 3,800.

Key levels
- Support 2
- 3,900
- Support 1
- 3,989
- Resistance 1
- 4,122
- Resistance 2
- 4,220
- Price (4,000.63) is under all three averages, and the 4,122 short average aligns with the channel roof, so that area is the supply zone for any bounce.
- RSI 34.53 is under its signal at 40.53 but not yet oversold; a close under 3,989 targets 3,900, while a close over 4,122 puts 4,220 in play.
Setup: Short at 4,075, stop 4,125, targets 3,990 and 3,900. Reward:risk 1.7 / 3.5, medium conviction. A bounce toward 4,075 that stalls under the 4,122 average is the entry; a soft US print and a weaker dollar can squeeze it, and a 1-hour close over 4,125 cancels it.
Natural Gas | NYMEX futures
Natural Gas Analysis: Price Breaks Down From a Rising Channel and Hovers Near Six-Month Lows
2.582 −0.020 (−0.77%) at about 09:15 GMT Previous close 2.602
Outlook: Bias is lower while 2.80 caps rallies, though the market is stretched. US gas fell about 4% on Monday to a six-month low on milder forecasts, is down 21% over seven sessions, and is again near 2.58 as speculators hold their largest net short since February 2024.

Key levels
- Support 2
- 2.35
- Support 1
- 2.50
- Resistance 1
- 2.80
- Resistance 2
- 2.95
- Price (2.582) is about 14% under the cluster of averages near 2.95 to 3.01, and the 2.50 April low is the nearest floor; forecasts for above-normal temperatures in the east keep demand soft.
- RSI 30.40 is oversold and well under its signal at 48.16; a close under 2.50 opens 2.35, while a bounce over 2.80 would target 2.95 as shorts cover.
Setup: Long at 2.520, stop 2.420, targets 2.800 and 2.950. Reward:risk 2.8 / 4.3, low conviction. This is a bounce trade from the April low with record-sized short positions as fuel; mild weather is the risk, and a 1-hour close under 2.420 cancels it.
Crude Oil (WTI) | TVC feed
Crude Oil Analysis: Price Meets the Falling Roof of a Large Triangle With Diplomacy in Focus
101.68 +0.44 (+0.43%) at about 09:15 GMT Previous close 101.24
Outlook: Bias is neutral to lower while 104.50 caps rallies. WTI is near 101.68 on the chart feed, while wire-quoted front-month futures trade a little lower near 100.8 to 101.3 after Monday’s talks involving Saudi, Turkish, Pakistani and Iranian officials in Tehran eased supply fears; continued Houthi attacks on Saudi Arabia limit the drop.

Key levels
- Support 2
- 95.24
- Support 1
- 100.00
- Resistance 1
- 104.50
- Resistance 2
- 107.00
- Price (101.68) is well above the 95.24, 93.13 and 86.26 averages, so the trend is up, but the falling roof near 104 to 105 has capped every rally since March.
- RSI 62.93 is above its signal at 58.63, firm but not overbought; a close over 104.50 targets 107.00, while a close under 100.00 puts the 95.24 average in play. Brent is near 114.70, after topping 117 in recent sessions.
Setup: Short at 103.80, stop 106.30, targets 99.80 and 95.25. Reward:risk 1.6 / 3.4, medium conviction. A rejection at the falling roof is the entry; a Houthi strike on Saudi export sites can spike prices through it, and a 1-hour close over 106.30 cancels it.
Corn | Skilling feed
Corn Analysis: Price Extends the Slide After Breaking a Rising Channel, With RSI Deeply Oversold
441.41 −0.99 (−0.22%) at about 09:15 GMT Previous close 442.40
Outlook: Bias is lower while 453 caps rallies, but selling is stretched. Corn is near 441.41 cents, down 0.2% on the day, as harvest pressure and weak export commitments outweigh stronger soybean demand; the feed trades under the Dec futures settlement of about 455 cents on Monday.

Key levels
- Support 2
- 431.00
- Support 1
- 438.00
- Resistance 1
- 453.00
- Resistance 2
- 464.60
- Price (441.41) is under all three averages and the broken channel floor near 465 is now supply; the US harvest was 60% complete on Sunday, six points behind the average, and export commitments are down about 34% from last year.
- RSI 23.64 is deeply oversold, so a sharp bounce is possible; a close under 438 opens 431, while a close over 453 targets 464.6.
Setup: Short at 453.00, stop 463.00, targets 438.00 and 431.00. Reward:risk 1.5 / 2.2, low conviction. A bounce into the 453 supply is the entry, because RSI under 25 makes selling at the lows risky; a 1-hour close over 463.00 cancels it.
Conclusion
The dollar is firm into the Fed meeting, so we prefer selling bounces in gold near 4,075, crude oil near 103.80 and corn near 453, with all three tied to clear supply zones. Silver, natural gas and copper are the three dip-buying ideas, on the 52.50 channel floor, the 2.52 April-low area and the 6.58 channel support, though silver and natural gas are low-conviction rebounds from oversold readings. The session risks are durable goods at 12:30 GMT, consumer confidence at 14:00 GMT, Tehran headlines and the API stock estimate at 20:30 GMT. A 1-hour close over 4,125 in gold or under 51.50 in silver would change the picture.
Trade silver, copper, gold, natural gas, crude oil and corn with Capital Street FX.
Frequently Asked Questions
Why is gold falling today?
Gold is near 4,000 on a firmer dollar near a multi-day high and expectations that the Fed could lean hawkish at its meeting that starts today. A hold is priced near 86% to 90%, so the tone of the statement matters more than the decision.
Where is support for gold and silver?
Gold has 3,989 as the first floor and 3,900 below it, a break of which could open 3,800. Silver has 52.67 and then 50.00, and silver needs a close over 55.00 to ease the pressure.
Why is crude oil holding above 100?
Houthi attacks on Saudi Arabia and risks to shipping routes keep a premium in prices, even as talks in Tehran ease supply fears. WTI faces the falling roof near 104 to 105 and the 100.00 level as first support.
Why is natural gas so low?
Milder weather forecasts cut heating demand, and US production is strong. The contract is oversold, and large speculative short positions mean a sharp bounce is possible if forecasts turn colder.