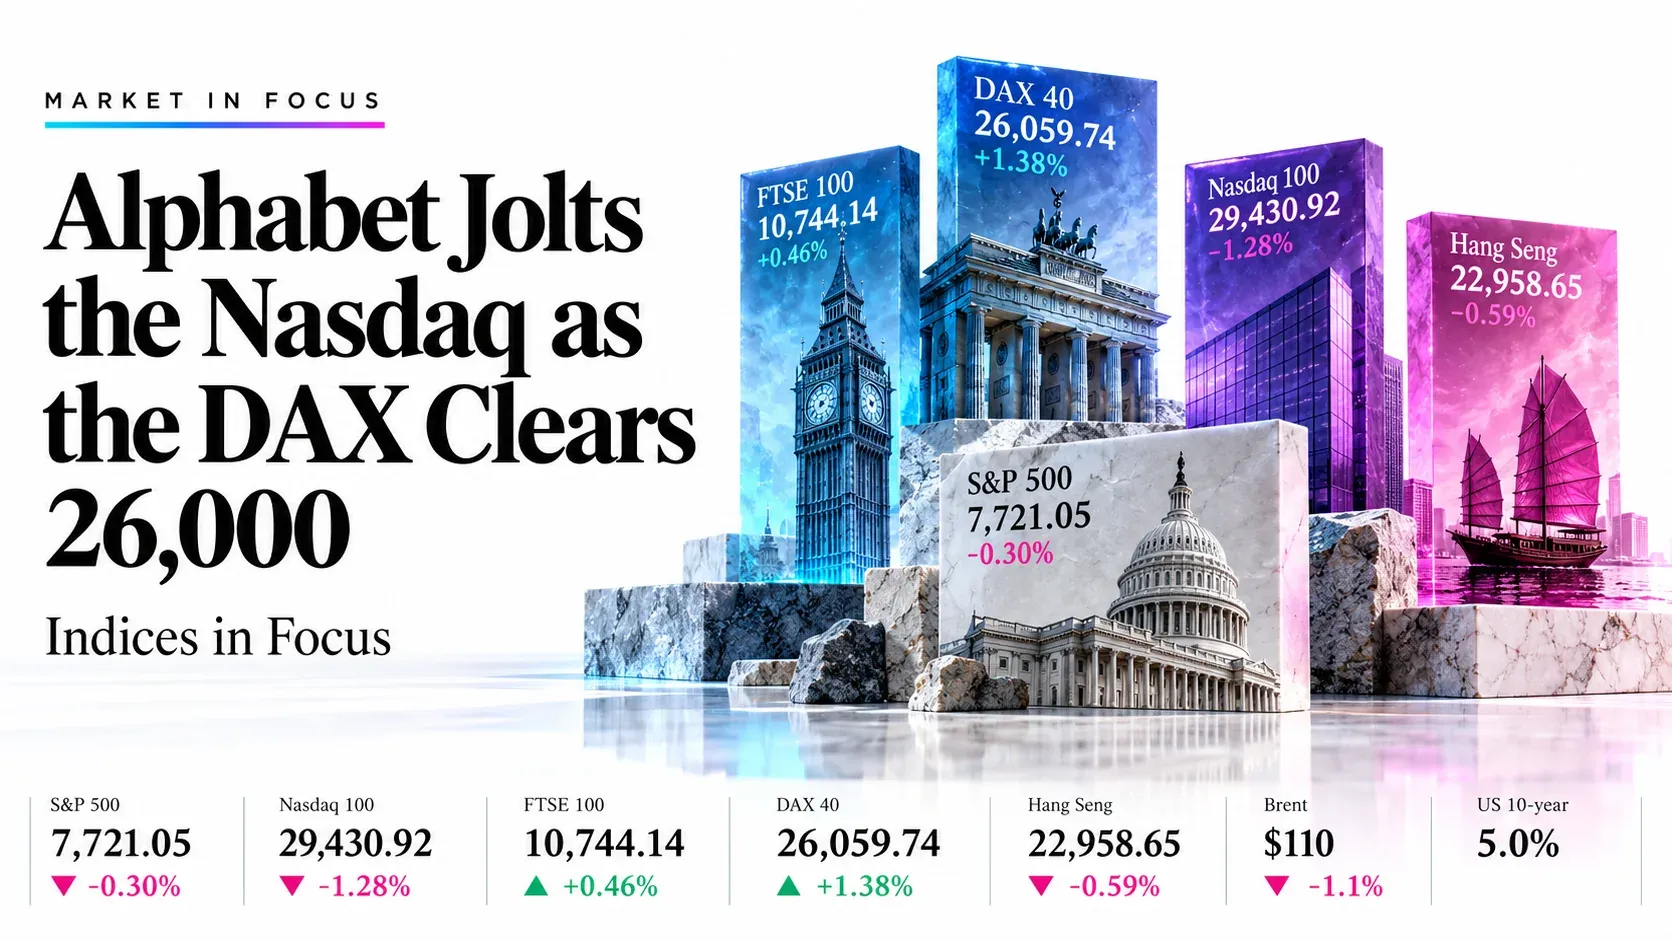
Alphabet Jolts the Nasdaq as the DAX Clears 26,000: Indices in Focus | Technical Analysis – Index Report | 29 Oct 2026
LIVE | Market in Focus | Indices | Thursday 29 October 2026 | Updated 15:00 GMT
Alphabet Jolts the Nasdaq as the DAX Clears 26,000: Indices in Focus
S&P 500SPX · 14:55 GMT
7,721.05
−22.93 pts (−0.30%)
Open 7,699.61 · High 7,726.78 · Low 7,695.75
Daily RSI 50.85
NeutralNasdaq 100NDX · 14:55 GMT
29,430.92
−382.23 pts (−1.28%)
Open 29,421.18 · High 29,470.59 · Low 29,257.05
Daily RSI 44.28
BearishFTSE 100UKX · 14:55 GMT
10,744.14
+49.65 pts (+0.46%)
Open 10,694.02 · High 10,773.70 · Low 10,694.02
Daily RSI 53.55
NeutralDAX 40DAX · 14:55 GMT
26,059.74
+355.72 pts (+1.38%)
Open 25,724.02 · High 26,106.19 · Low 25,720.69
Daily RSI 61.74
BullishHang SengHSI · Close 08:00 GMT
22,958.65
−136.18 pts (−0.59%)
Open 23,088.14 · High 23,184.09 · Low 22,928.27
Daily RSI 31.31
BearishCross-assetReference · 29 Oct
Brent $110
−1.1% on the day
WTI about $101 · Gold about $4,030
US 10-year near 5.0%
NeutralDesk bias, today Selective Long S&P 500, FTSE 100 and DAX on dips; short Nasdaq 100 and Hang Seng on rallies; Amazon and Intel at 21:00 GMT decide the tech tone
Market Overview
Europe is breaking out while US tech and Hong Kong chips break down. The DAX (26,059.74, +1.38%) cleared 26,000 after the ECB held at 2.50% and Christine Lagarde confirmed she will leave in February, while the Nasdaq 100 (29,430.92, −1.28%) was hit by Alphabet’s earnings miss. US data landed hawkish but in line: GDP 3.4%, core PCE 3.1%, with December Fed hike odds near 83%. The desk plan: buy dips in the DAX, FTSE 100 and S&P 500, and sell rallies in the Nasdaq 100 and Hang Seng.
The FTSE 100 (10,744.14, +0.46%) is firm on Shell’s strongest quarter since 2022 and a calm UK Budget reaction, but it is still inside a triangle capped near 10,870. The S&P 500 (7,721.05, −0.30%) is holding mid-channel as Microsoft offsets Alphabet. The Hang Seng (22,958.65, −0.59%) closed under its falling channel with the Tech index down 2.84%, only 440 points above its 52-week low at 22,518.
Key highlights
- Bias: Long S&P 500, FTSE 100 and DAX 40 on dips; short Nasdaq 100 and Hang Seng on rallies.
- Levels: SPX 7,737 and 7,698; NDX 29,560 and 29,257; UKX 10,870 and 10,705; DAX 26,106 and 25,720; HSI 23,184 and 22,518.
- Event risk: Europe close 16:30 GMT, US close 20:00 GMT, Amazon and Intel 21:00 GMT, BoJ around 03:00 GMT and eurozone GDP 10:00 GMT on Friday.
Index Trade Tickets for Today
S&P 500 (SPX)
LongMedium conviction- Entry zone
- 23,150–23,260Average 7,687.50
- Stop loss
- 7,605−82 pts
- Take profit 1
- 7,780+92 pts
- Take profit 2
- 7,840+152 pts
- Take profit 3
- 7,930+242 pts
- Valid until
- 20:00 GMTFri 30 Oct
Average entry 7,687.50. Risk 82 points (about 1.07% of entry). Reward:risk 1.1 to TP1, 1.8 to TP2, 2.9 to TP3. 1 point = 1.0 index point.
Why this trade: Buy a dip into the medium average. The index sits mid-channel at 7,721 after a 0.30% slide, and the 7,698 average and 7,696 session low form a tight floor under Alphabet’s tech wobble.
Cancel if: A 4-hour close below 7,605, under the slow average, or a sharp Amazon/Intel miss that reopens the AI-spend selloff. Cancel if unfilled by 20:00 GMT Friday.
Nasdaq 100 (NDX)
ShortLow–medium conviction- Entry zone
- 23,150–23,260Average 29,680
- Stop loss
- 30,060−380 pts
- Take profit 1
- 29,260+420 pts
- Take profit 2
- 28,800+880 pts
- Take profit 3
- 28,500+1180 pts
- Valid until
- 20:00 GMTFri 30 Oct
Average entry 29,680. Risk 380 points (about 1.28% of entry). Reward:risk 1.1 to TP1, 2.3 to TP2, 3.1 to TP3. 1 point = 1.0 index point.
Why this trade: Sell a bounce into the slow and medium averages. Alphabet’s miss reopened AI-spend doubts, price is under all three averages and RSI 44.28 sits under its 44.70 average.
Cancel if: A 4-hour close above 30,060, over the fast average, or a strong Amazon print that revives the AI trade. Cancel if unfilled by 20:00 GMT Friday.
FTSE 100 (UKX)
LongLow–medium conviction- Entry zone
- 23,150–23,260Average 10,685
- Stop loss
- 10,610−75 pts
- Take profit 1
- 10,775+90 pts
- Take profit 2
- 10,870+185 pts
- Take profit 3
- 10,985+300 pts
- Valid until
- 16:30 GMTFri 30 Oct
Average entry 10,685. Risk 75 points (about 0.70% of entry). Reward:risk 1.2 to TP1, 2.5 to TP2, 4.0 to TP3. 1 point = 1.0 index point.
Why this trade: Buy a pullback into the average cluster. Shell’s record-since-2022 profit and a calm Budget reaction support the index, and the 10,663–10,705 zone has held all week.
Cancel if: A 4-hour close below 10,610, or a sharp oil drop that unwinds the Shell and energy bid. Cancel if unfilled by 16:30 GMT Friday.
DAX 40 (DAX)
LongMedium conviction- Entry zone
- 23,150–23,260Average 25,750
- Stop loss
- 25,480−270 pts
- Take profit 1
- 26,106+356 pts
- Take profit 2
- 26,350+600 pts
- Take profit 3
- 26,570+820 pts
- Valid until
- 16:30 GMTFri 30 Oct
Average entry 25,750. Risk 270 points (about 1.05% of entry). Reward:risk 1.3 to TP1, 2.2 to TP2, 3.0 to TP3. 1 point = 1.0 index point.
Why this trade: Buy the retest after the channel breakout. The DAX cleared 26,000 for the first time in about seven weeks, RSI 61.74 is rising, and the old channel top and averages sit 150–350 points below.
Cancel if: A daily close below 25,480, which would put price back inside the falling channel. Cancel if unfilled by 16:30 GMT Friday.
Hang Seng (HSI)
ShortLow–medium conviction- Entry zone
- 23,150–23,260Average 23,205
- Stop loss
- 23,450−245 pts
- Take profit 1
- 22,800+405 pts
- Take profit 2
- 22,518+687 pts
- Take profit 3
- 22,000+1205 pts
- Valid until
- 08:00 GMTFri 30 Oct
Average entry 23,205. Risk 245 points (about 1.06% of entry). Reward:risk 1.7 to TP1, 2.8 to TP2, 4.9 to TP3. 1 point = 1.0 index point.
Why this trade: Sell a retest of the broken channel floor. The index closed at 22,958.65, under the falling channel after a heavy tech day, with the Hang Seng Tech Index down 2.84%.
Cancel if: A daily close above 23,450, or a surprise Beijing stimulus package. RSI 31.31 is near oversold, so a sharp relief bounce is the main risk. Cancel if unfilled by 08:00 GMT Friday.
Conditional levels, not investment advice. Index CFD ticks are quoted in index points.
Price Ladders: Every Level That Matters Today
S&P 500
| Price | Level | What it is | Distance |
|---|---|---|---|
| 7,840 | Resistance 3 | Early-October swing high | +119 pts |
| 7,737.07 | Resistance 2 | Fast average | +16 pts |
| 7,726.78 | Resistance 1 | Session high | +6 pts |
| 7,721.05 | Price now | Captured 14:55 GMT | 0 pts |
| 7,675–7,700 | Entry zone | Long idea; stop 7,605 | −46 to −21 pts |
| 7,698.32 | Support 1 | Medium average, near the 7,695.75 session low | −23 pts |
| 7,613.06 | Support 2 | Slow average, recent low zone | −108 pts |
| 7,480 | Support 3 | Rising channel floor | −241 pts |
Nasdaq 100
| Price | Level | What it is | Distance |
|---|---|---|---|
| 30,055.68 | Resistance 3 | Fast average | +625 pts |
| 29,813.44 | Resistance 2 | Medium average, Wednesday’s 29,813 close | +383 pts |
| 29,559.88 | Resistance 1 | Slow average | +129 pts |
| 29,430.92 | Price now | Captured 14:55 GMT | 0 pts |
| 29,560–29,800 | Entry zone | Short idea; stop 30,060 | +129 to +369 pts |
| 29,257.05 | Support 1 | Session low | −174 pts |
| 28,800 | Support 2 | Channel floor, recent swing low | −631 pts |
| 28,000 | Support 3 | Round number, July base | −1,431 pts |
FTSE 100
| Price | Level | What it is | Distance |
|---|---|---|---|
| 10,985 | Resistance 3 | August swing high | +241 pts |
| 10,870 | Resistance 2 | Falling triangle top | +126 pts |
| 10,773.70 | Resistance 1 | Session high | +30 pts |
| 10,744.14 | Price now | Captured 14:55 GMT | 0 pts |
| 10,665–10,705 | Entry zone | Long idea; stop 10,610 | −79 to −39 pts |
| 10,704.82 | Support 1 | Medium average | −39 pts |
| 10,663.30 | Support 2 | Fast average, near the 10,670 slow average | −81 pts |
| 10,500 | Support 3 | Rising triangle floor | −244 pts |
DAX 40
| Price | Level | What it is | Distance |
|---|---|---|---|
| 26,570 | Resistance 3 | Record close 26,569.99 from 28 August | +510 pts |
| 26,350 | Resistance 2 | Mid-way to the August record | +290 pts |
| 26,106.19 | Resistance 1 | Session high | +46 pts |
| 26,059.74 | Price now | Captured 14:55 GMT | 0 pts |
| 25,700–25,800 | Entry zone | Long idea; stop 25,480 | −360 to −260 pts |
| 25,720.69 | Support 1 | Session low, Wednesday’s 25,704 close | −339 pts |
| 25,585.72 | Support 2 | Broken channel top, medium average | −474 pts |
| 25,368.13 | Support 3 | Fast average | −692 pts |
Hang Seng
| Price | Level | What it is | Distance |
|---|---|---|---|
| 23,803.43 | Resistance 3 | Fast average | +845 pts |
| 23,260 | Resistance 2 | Broken channel floor, retest zone | +301 pts |
| 23,184.09 | Resistance 1 | Session high | +225 pts |
| 22,958.65 | Price now | Captured 14:55 GMT | 0 pts |
| 23,150–23,260 | Entry zone | Short idea; stop 23,450 | +191 to +301 pts |
| 22,928.27 | Support 1 | Session low | −30 pts |
| 22,518 | Support 2 | 52-week low | −441 pts |
| 22,000 | Support 3 | Round number below the June base | −959 pts |
Technical Summary: Five Daily Charts
S&P 500

- Trend
- Price sits in the middle of a rising channel that runs from late July, roughly 7,480 at the floor to 7,990 at the top.
- Averages
- Price is under the 7,737.07 fast average and above the 7,698.32 medium and 7,613.06 slow averages.
- Momentum
- RSI 50.85 sits just above its 50.29 average: neutral.
Nasdaq 100

- Trend
- Price is in a rising channel but has slipped from the early-October peak near 31,300 and trades in the lower half, with the floor near 28,800.
- Averages
- Price is under the 29,559.88 slow, 29,813.44 medium and 30,055.68 fast averages.
- Momentum
- RSI 44.28 under its 44.70 average: weak and turning down.
FTSE 100

- Trend
- Price is inside a wide symmetrical triangle, with the falling top near 10,870 and the rising floor near 10,500; the October 16 spike was rejected at the top line.
- Averages
- Price is above the 10,704.82 medium, 10,670.42 slow and 10,663.30 fast averages, which are bunched together.
- Momentum
- RSI 53.55 slightly under its 54.51 average: neutral.
DAX 40

- Trend
- Price has broken above the falling channel that ran from the late-August record, and now trades near the session high at 26,106.
- Averages
- Price is above all three averages: 25,368.13 fast, 25,500.29 and 25,585.72, which sit close to the broken channel top.
- Momentum
- RSI 61.74 against a 51.21 average: firmly positive.
Hang Seng

- Trend
- Price has dropped out of the falling channel that began in late July and closed near a one-week low, with the 22,518 52-week low below.
- Averages
- Price is under the 23,803.43 fast average and the 24,619.93 and 24,629.27 averages, which cap any rally.
- Momentum
- RSI 31.31 under its 37.08 average: weak, near oversold.
Bull vs Bear Signal Board
| Market | Trend | Averages | Momentum | Today’s catalyst |
|---|---|---|---|---|
| S&P 500 | Neutral | Neutral | Neutral | Alphabet, Amazon/Intel after close Neutral |
| Nasdaq 100 | Neutral | Bearish | Bearish | Alphabet cash burn Bearish |
| FTSE 100 | Neutral | Bullish | Neutral | Shell, UK Budget, oil near $110 Bullish |
| DAX 40 | Bullish | Bullish | Bullish | ECB hold, Airbus, Siemens earnings Bullish |
| Hang Seng | Bearish | Bearish | Bearish | China tech selloff, no stimulus yet Bearish |
Today on the GMT Clock
- Europe cash close (DAX, FTSE)
- 16:30 GMT
- today · Medium impact
- Closes decide whether the DAX holds above 26,000 and the FTSE above 10,705
- US cash close
- 20:00 GMT
- today · Medium impact
- Settlement near 7,720 on the S&P and 29,400 on the Nasdaq-100 sets Friday’s tone
- Amazon and Intel earnings
- 21:00 GMT
- today · High impact
- AWS growth and AI capex can swing the Nasdaq-100 trade ideas overnight
- Hang Seng reopens
- 01:30 GMT
- Fri 30 Oct · Medium impact
- Reaction to Wall Street tech and China stimulus hopes near 23,150
- Bank of Japan decision
- ~03:00 GMT
- Fri 30 Oct · High impact
- Hold at 1.25% expected; guidance on a December hike moves Asian indices
- Eurozone Q3 GDP flash
- 10:00 GMT
- Fri 30 Oct · High impact
- A weak print would test the DAX retest zone at 25,700–25,800
Swipe sideways for all events.
If-Then Playbook
If S&P 500: price dips to 7,675–7,700
Then go long; targets 7,780, 7,840, 7,930
If S&P 500: a 4-hour candle closes below 7,605
Then drop the long; the idea is wrong
If Nasdaq 100: price rallies into 29,560–29,800
Then go short; targets 29,260, 28,800, 28,500
If Nasdaq 100: a 4-hour candle closes above 30,060
Then drop the short; the idea is wrong
If FTSE 100: price dips to 10,665–10,705
Then go long; targets 10,775, 10,870, 10,985
If FTSE 100: a 4-hour candle closes below 10,610
Then drop the long; the idea is wrong
If DAX 40: price dips to 25,700–25,800
Then go long; targets 26,106, 26,350, 26,570
If DAX 40: a 4-hour candle closes below 25,480
Then drop the long; the idea is wrong
If Hang Seng: price rallies into 23,150–23,260
Then go short; targets 22,800, 22,518, 22,000
If Hang Seng: a 4-hour candle closes above 23,450
Then drop the short; the idea is wrong
Catalyst Wire: Fundamental News Today
Alphabet’s miss and heavy cash burn knock about $450 billion off its value
Search ad growth and EPS came in below forecasts while AI spending accelerated, so Alphabet fell 10%–13% and Microsoft rose on cloud strength. The drop accounts for most of the roughly $660 billion the Nasdaq-100 was set to lose at the open.
Source: Reuters via KFGO and Globe and Mail, Benzinga, 29 Oct 2026
US GDP beats at 3.4%; PCE and claims match the hawkish Fed backdrop
Q3 GDP printed 3.4% against 3.2% expected, September PCE rose 3.6% y/y, core PCE 3.1% y/y and jobless claims were 194,000. The Fed held at 3.75%–4.00% in a 10–2 vote, and December hike odds sit near 83%.
Source: Benzinga, QSG Capital, Market Pulse, 29 Oct 2026
ECB holds at 2.50% and Lagarde confirms she will leave on 7 February 2027
The hold was widely expected, and the ECB said inflation risks from energy are rising, which keeps a December hike in play. The DAX still pushed above 26,000 for the first time in about seven weeks, helped by Airbus and Siemens results.
Source: Reuters, Irish Times, Newsquawk, ARIVA, 29 Oct 2026
Shell lifts the FTSE 100 after its best quarter since 2022
Shell reported $10.81 billion adjusted earnings and raised its quarterly buyback to $5 billion, while Brent held near $110. Haleon and Lloyds fell, and the Budget drew a calm reaction from gilts.
Source: Investing.com, Reuters via AOL, Yahoo Finance UK, 29 Oct 2026
Hang Seng falls 0.59% as chip names slide and the Tech index drops 2.84%
SMIC, Lenovo and Tencent led the declines, and mainland shares stayed weaker as traders wait for fresh Beijing stimulus. Chinese equities are near one-year lows after a month-long fall.
Source: TechFlow, Vibiznews, 24/7 Wall St, Investing.com, 29 Oct 2026
Brent near $110, gold near $4,030 and the US 10-year around 5.0%
Energy costs keep inflation risk alive for both the Fed and the ECB, and a hot oil move would pressure yield-sensitive growth indices more than the FTSE.
Source: Investing.com, Stockopedia, Saxo, 28–29 Oct 2026
Amazon and Intel report at 21:00 GMT; BoJ and eurozone GDP follow on Friday
The results land right after the US cash close and set the tone for the AI trade. The BoJ decision is due around 03:00 GMT Friday, with eurozone Q3 GDP at 10:00 GMT, and US midterm elections follow on 3 November.
Source: TradingKey, Yardeni, MarketScreener, Newsquawk, 26–29 Oct 2026
Conclusion
Desk verdict: buy the dips in Europe and the S&P 500; sell the bounces in the Nasdaq 100 and Hang Seng.
The DAX and FTSE 100 carry the cleanest longs while they hold 25,480 and 10,610, and the S&P 500 dip-buy is stopped under 7,605. The Nasdaq 100 short (stop 30,060) and Hang Seng short (stop 23,450) lean on Alphabet’s AI-spend shock and China’s tech weakness. The book mixes long and short exposure, so a single risk-off shock hurts less. The main risks are Amazon and Intel at 21:00 GMT and Friday’s BoJ and eurozone GDP releases, which can break these levels quickly.
Trade the S&P 500, Nasdaq 100, FTSE 100, DAX 40 and Hang Seng with Capital Street FX.
Frequently Asked Questions
What is the indices outlook for today?
Mixed. The DAX is breaking out and the FTSE 100 is firm, while the Nasdaq 100 and Hang Seng are under pressure from the AI-spend and China tech selloffs.
Which index trade ideas are live today?
Long the S&P 500, FTSE 100 and DAX 40 on dips; short the Nasdaq 100 and Hang Seng on rallies, each with a stop and three targets.
What time are the key events in GMT?
Europe cash close 16:30 GMT, US cash close 20:00 GMT, Amazon and Intel results 21:00 GMT, then the BoJ decision around 03:00 GMT and eurozone Q3 GDP at 10:00 GMT on Friday.
Why did the Nasdaq 100 fall today?
Alphabet’s weak search advertising and surging AI spending sent its shares down roughly 10%–13%, dragging the index even as Microsoft rose.
Why did the DAX break above 26,000?
The ECB held rates as expected, earnings from Airbus and others were solid, and the index cleared the falling channel that had capped it since the late-August record.