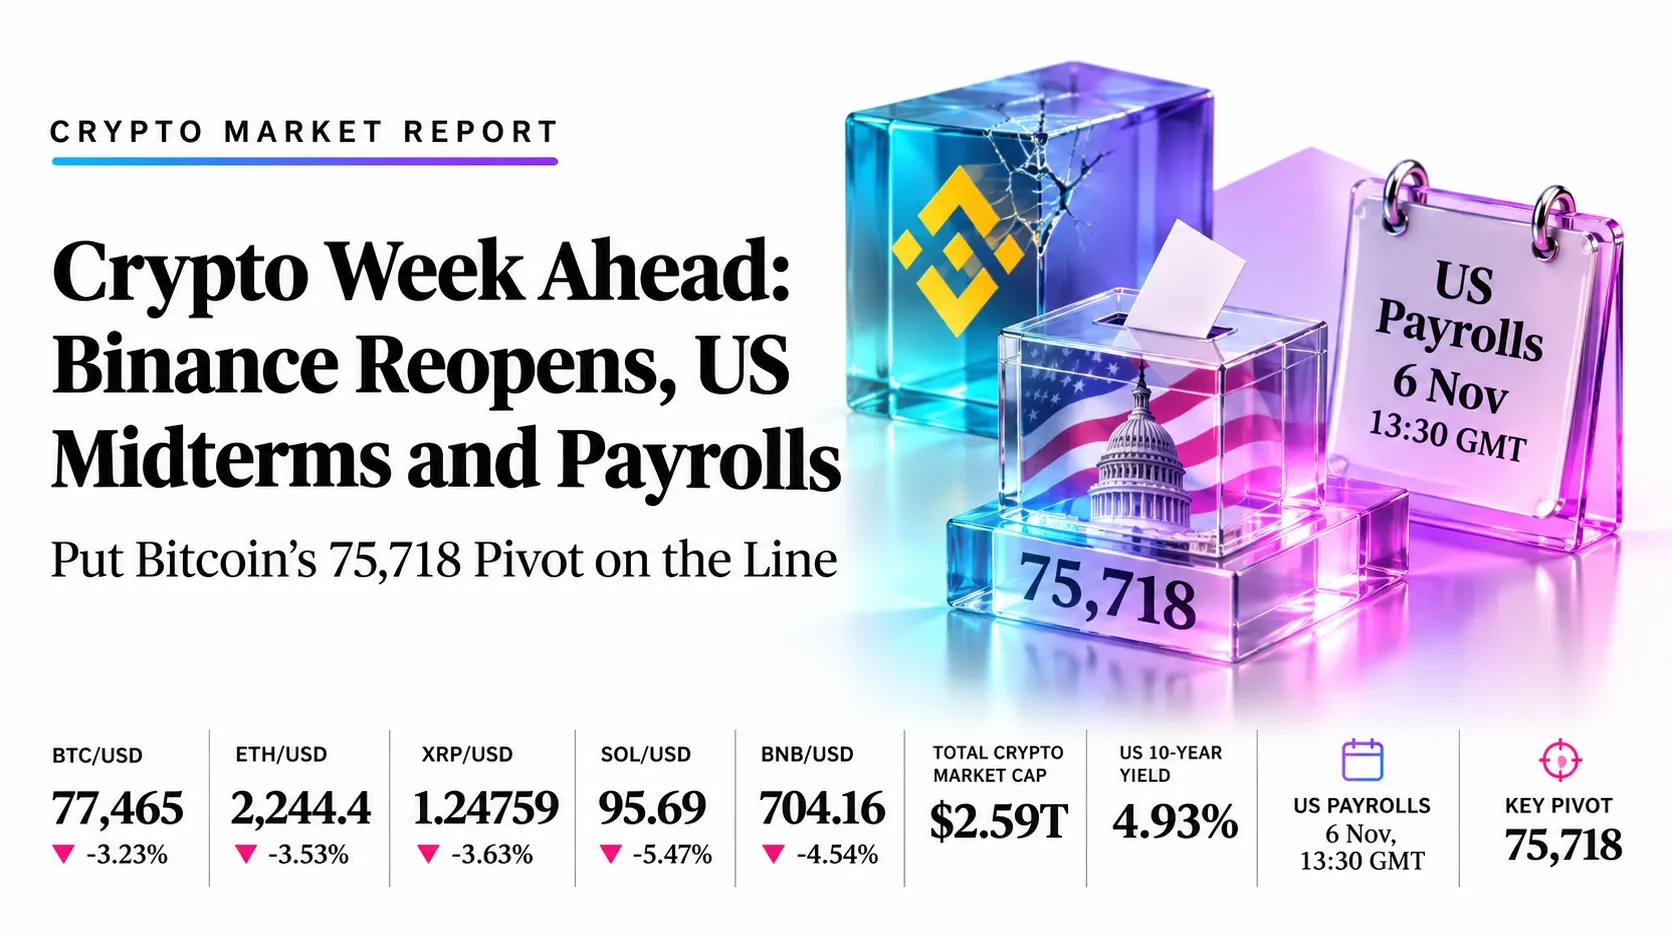
Crypto Week Ahead: Binance’s Planned Reopening, US Midterms and Payrolls Put Bitcoin’s 75,718 Pivot on the Line | Technical Analysis – Crypto Report | 31 Oct 2023
Crypto Week Ahead | 2–6 November 2026
Crypto Week Ahead: Binance’s Planned Reopening on Sunday as US Midterms and Payrolls Put Bitcoin’s 75,718 Pivot on the Line
- Weekly bias
- Event-led, bearish tilt
- Fed December hike odds near 80%; BTC capped under 80,000
- Expected volatility
- High
- A possible Binance reopening, midterms and payrolls between Sunday and 13:30 GMT Friday
- Key event
- US payrolls
- Friday 6 Nov, 13:30 GMT
- Key pivot level
- 75,718
- BTC/USD weekly average; a weekly close below it exposes 72,956
Market Overview
Three catalysts land inside five trading days, and each one can move Bitcoin: Binance’s planned reopening on Sunday after the largest theft in crypto history, US midterm voting on Tuesday, and non-farm payrolls at 13:30 GMT on Friday. Bitcoin enters the week at 77,465, down 3.2% from last Monday’s open of 80,048 and capped below 80,000. The level that decides the week is 75,718, the weekly average: a weekly close beneath it exposes 72,956. Our bias is event-led with a bearish tilt, and we expect high volatility from Sunday’s reopening to the payrolls release.
The backdrop is fragile. Attackers moved about $6.3 billion out of Binance’s wallets from around 20:05 GMT on 29 October; about $3 billion has been frozen on-chain and Binance has pledged to cover all losses, setting aside more than $6.34 billion of company funds. That shock landed on a hawkish Fed hold at 3.75–4.00%, where Cook and Hammack dissented in favour of a hike, and an AI-led equity rout that took the Nasdaq down 2.9% on Friday. Ether, XRP, Solana and BNB have lost between 3.5% and 5.5% on their weekly candles, and the crypto market capitalisation stood near $2.59 trillion on Investing.com data.
The calendar is crowded. Binance aims to reopen deposits and withdrawals on Sunday morning and has promised updated proof of reserves on Monday. US clocks go back on Sunday 1 November, so New York releases land one hour later in GMT terms: ISM manufacturing on Monday at 15:00 GMT, ISM services and ADP on Wednesday, and payrolls on Friday. The RBA (03:30 GMT Tuesday) and the BoE (12:00 GMT Thursday) are both expected to hike, which keeps global tightening in focus. Bitcoin is trading in step with AI stocks, so the Nasdaq’s reaction matters as much as exchange headlines.
We rank the strongest setups where macro direction and chart structure agree, and the weakest where a single event, such as Binance reopening, can overwhelm the chart.
Key highlights
- Binance: The record $6.3 billion breach is attributed by TRM Labs and other analysts to North Korea’s TraderTraitor group. Withdrawals are paused and expected back on Sunday, with proof of reserves promised on Monday.
- Fed: Rates were held with two dissents for a hike. Futures price a December hike near 80%, so payrolls are decisive; the 10-year yield closed Friday at 4.93%.
- Equities: Intel fell 28.6% and Alphabet 12.6% in the AI sell-off, and the Nasdaq booked its worst month since March 2025. Crypto has tracked the move.
- ETFs: US spot Bitcoin ETFs took in about $424 million over three sessions to 28 October, but Ether funds have had outflows for three straight weeks and XRP funds’ 13-week inflow run ended in mid-October.
- Midterms: Prediction markets favour Democrats for the House, and the CLARITY Act failed a Senate vote 49–50 on 15 September, so Tuesday shapes US crypto law.
- Corporates: Coinbase missed Q3 revenue estimates and Strategy paused bitcoin purchases; both shares fell sharply on Friday.
Market Snapshot: Weekly Candle, 31 October 2026
BTC/USD Bitcoin / US Dollar
77,465
-2,583-3.23% week
Range 76,173–81,888
72,95681,888
Sell near 79,800ETH/USD Ethereum / US Dollar
2,244.4
-82.1-3.53% week
Range 2,170.0–2,389.0
2,0502,389
Sell near 2,310XRP/USD XRP / US Dollar
1.24759
-0.04697-3.63% week
Range 1.19800–1.34293
1.07001.4514
Buy near 1.1800SOL/USD Solana / US Dollar
95.69
-5.54-5.47% week
Range 92.14–103.77
85.00103.77
Sell near 97.00BNB/USD BNB / US Dollar
704.16
-33.47-4.54% week
Range 679.98–761.19
667.74761.19
Buy near 685- Total crypto market cap
- $2.59T
- Investing.com, 30 Oct; 24h volume $128.6B
- BTC dominance
- 59.7%
- ETH dominance 10.6%
- Fed December hike odds
- ~80%
- Payrolls decide
- US 10-year yield
- 4.93%
- Friday close; Brent $113.10
Prices are from the weekly charts at 12:06–12:09 GMT on 31 October (BTC, ETH and XRP on Bitstamp, SOL on Coinbase, BNB on the TradingView crypto feed). Weekly change is measured from the Monday open.
Trade Setups for the Week
| Pair | Direction | Entry | Stop | Target 1 | Target 2 | Reward:risk | Conviction |
|---|---|---|---|---|---|---|---|
| BTC/USD | Short | 79,800 | 82,000 | 76,200 | 72,950 | 1.6 / 3.1 | Medium |
| ETH/USD | Short | 2,310 | 2,395 | 2,170 | 2,050 | 1.6 / 3.1 | Medium |
| XRP/USD | Long | 1.1800 | 1.1100 | 1.2940 | 1.4500 | 1.6 / 3.9 | Low |
| SOL/USD | Short | 97.00 | 101.00 | 92.14 | 85.00 | 1.2 / 3.0 | Medium |
| BNB/USD | Long | 685 | 650 | 728.16 | 760 | 1.2 / 2.1 | Low |
Reward:risk is the distance from entry to target 1 and target 2, divided by the distance from entry to the stop. Levels are in US dollars and are conditional technical references, not recommendations. Crypto trades 24/7, so weekend gaps and thin liquidity can move price through levels.
Key Market Drivers
Binance’s reopening and proof of reserves decide the confidence trade
The exchange says an engineer’s compromised laptop let an attacker submit unauthorised withdrawals, including 17,985 BTC, and that it has since found additional points of breach. It has reserved $6.34 billion to cover losses, including about $5 billion in matching tokens. A smooth reopening would help relief rallies; a delay would revive fears about exchange counterparty risk.
Key events: Sunday 1 November, withdrawals targeted to resume (time TBC); Monday 2 November, proof of reserves (time TBC).
Payrolls decide whether the Fed hikes in December
The Fed held at 3.75–4.00% with two dissents for a hike, and December pricing is near 80%. Consensus for October payrolls is roughly +55k to +63k with unemployment at 4.2% and earnings up 0.3%, after September’s weak +29k. A beat would seal December pricing and pressure risk assets; a miss would let yields keep falling.
Key events: Monday 2 November, ISM manufacturing at 15:00 GMT; Wednesday 4 November, ADP at 13:15 GMT and ISM services at 15:00 GMT; Friday 6 November, payrolls at 13:30 GMT.
The AI equity rout is the transmission channel
Alphabet’s record drop and Friday’s 2.9% Nasdaq fall, with Intel down 28.6%, hit risk appetite, and Bitcoin has traded alongside AI stocks. Brent at $113.10 and Iran-war headlines, including talk of renewed US action after the midterms, keep inflation fears alive. Gold fell to a one-year low, so it is not offering a haven bid.
Key events: Wednesday 4 November, ISM services at 15:00 GMT; daily Nasdaq open at 14:30 GMT; any US–Iran headline after Tuesday’s vote.
Midterms, CLARITY and ETF flows frame the institutional bid
Voters will decide control of Congress on Tuesday, and the CLARITY Act’s path depends on the result after it failed a Senate vote 49–50 in September. Meanwhile ETF flows have split: Bitcoin funds had inflows earlier in the week, but Ether and XRP funds are under pressure. Strategy paused purchases and Coinbase missed revenue estimates.
Key events: Tuesday 3 November, US elections; Wednesday 4 November, first results; daily ETF flow prints after the US close.
BTC at 75,718 and ETH at 2,190 mark the two lines most exposed to a payrolls surprise. A weekly close beyond either would change the picture for the crypto complex.
NFP Scenario Analysis
Consensus is for payrolls of about +55k to +63k, unemployment at 4.2% and average hourly earnings up 0.3% on the month. The report is due on Friday 6 November at 13:30 GMT. Crypto reacts through yields, the dollar and the Nasdaq, so a weak print helps only if it is not read as a growth shock.
Strong payrolls: a beat with firm earnings would seal December
Higher yield expectations and a firmer dollar would pressure equities and crypto together.
- BTC/USD76,173, then 72,956
- ETH/USD2,170, then 2,050
- XRP/USD1.1980, then 1.0700
- SOL/USD92.14, then 85.00
- BNB/USD679.98, then 667.74
Weak payrolls: a miss would reopen the December debate
Lower yield expectations would support a relief bounce, provided growth fears do not dominate.
- BTC/USD80,000, then 81,888
- ETH/USD2,313, then 2,389
- XRP/USD1.2537, then 1.2940
- SOL/USD96.84, then 103.77
- BNB/USD728.16, then 761.19
BTC/USD | Bitcoin / US Dollar
Bitcoin Outlook: Binance Shock Leaves BTC Pinned Beneath 80,000 as the Weekly Channel Tests 75,718
77,465 -2,583 (-3.23%) week Range 76,173–81,888
Outlook: Bias is lower while 80,000 caps rallies. Bitcoin has fallen 3.23% on the weekly candle, opening at 80,048 and sliding to a low of 76,173 after the record Binance hack, and now sits mid-channel between the 75,718 and 89,341 averages. ETF demand was positive earlier in the week, but the shock, a hawkish Fed hold and an AI-led equity rout pushed price lower. Rallies into 79,500–80,000 are the zone to work from; a weekly close below 75,718 would expose 72,956.

Key levels
- Support 2
- 72,956
- Support 1
- 75,718
- Resistance 1
- 80,000
- Resistance 2
- 81,888
Weekly chart structure
- Structure: a falling channel since the October 2025 peak near 126,000; price rejected near 87,000–88,000 in the autumn and now trades in the middle of the channel, with the lower edge near 52,000.
- Averages: 89,341 sits above price, while 75,718 and 72,956 sit below and form the first support band.
- Candle: bearish, opened 80,048, has ranged 76,173–81,888 and is 3.23% lower at the time of the chart, with a long upper wick showing sellers near 82,000.
- Momentum: RSI 51.24 sits under its 53.66 signal line, a neutral reading that is turning down.
Key technical levels
80,000 is the first cap, with 81,888 the week’s high above it. A weekly close above 81,888 would reopen the 87,000–89,000 region. 76,173 is the week’s low and first support; a weekly close below the 75,718 average exposes 72,956, which matches the bottom of the NordFX base case of 72,000–80,000.
Fundamental drivers
Binance shock and ETF flows
The attacker withdrew 17,985 BTC, about $1.45 billion at the time, as part of the roughly $6.3 billion taken from Binance. US spot Bitcoin ETFs took in about $424 million over three sessions earlier in the week, though flow data for Thursday and Friday had not yet been confirmed. Strategy, which holds 848,517 BTC, paused its bitcoin purchases while repurchasing $204.9 million of its STRC preferred stock, removing a steady bid.
Macro and correlation
Bitcoin is trading in step with AI stocks, so the Nasdaq reaction to the midterms and Friday’s payrolls matters as much as exchange headlines. With December Fed hike odds near 80% and the 10-year yield at 4.93%, a strong jobs print would pressure risk assets; a weak one could help if growth fears do not take over.
Bitcoin trade setup
ShortMedium conviction- Entry
- 79,800
- Stop loss
- 82,000
- Target 1
- 76,200
- Target 2
- 72,950
Risk $2,200 per coin. Reward:risk 1.6 to target 1, 3.1 to target 2.
Rationale: Failure to reclaim 80,000, a Fed leaning towards a December hike and a tight link to falling AI stocks favour selling rallies; the 80,000–82,000 band defines the risk.
Invalidation: A daily close above 82,000. A smooth Binance reopening combined with a weak payroll print that drags yields lower is the main risk.
ETH/USD | Ethereum / US Dollar
Ethereum Outlook: Ether Slips Under the 2,190 Average as ETF Outflows and the Glamsterdam Delay Weigh
2,244.4 -82.1 (-3.53%) week Range 2,170.0–2,389.0
Outlook: Bias is lower while 2,313 caps rallies. Ether has lost 3.53% on the weekly candle, dipped to 2,170 and is sitting on the rising trendline of a symmetrical triangle. US spot Ether funds have seen outflows three full weeks running, and the Glamsterdam testnet upgrade has been postponed with no new date. A bounce into 2,300–2,320 is the zone to work from.

Key levels
- Support 2
- 2,050
- Support 1
- 2,190
- Resistance 1
- 2,313
- Resistance 2
- 2,389
Weekly chart structure
- Structure: a symmetrical triangle, with a falling line from the August 2025 high near 4,950 and a rising line from the June 2026 low near 1,500; price was rejected near 2,780 and has returned to the rising line.
- Averages: 2,725.5 and 2,313.2 sit above price, while 2,189.8 sits just below.
- Candle: bearish, opened 2,326.3, has ranged 2,170.0–2,389.0 and is 3.53% lower, with the low pushing under the rising trendline.
- Momentum: RSI 47.77 sits under its 54.37 signal line, so momentum is weakening.
Key technical levels
2,313 is the first resistance and 2,389 the week’s high; a weekly close above 2,389 would erase this week’s losses and reopen the 2,470 area. 2,190 is first support, and a weekly close below it takes price out of the triangle and exposes 2,050 and then 2,000.
Fundamental drivers
ETF outflows and upgrade delay
US spot Ether funds lost about $220.6 million in the week from 19 October and have recorded net outflows in each of the last three full weeks. The Ethereum Foundation postponed the Glamsterdam upgrade on the Hoodi testnet, which had been due on 26 October, and has not set a new date.
Binance fallout and higher beta
Circle, Tether and Ripple moved to freeze funds tied to the hack, helping lock about $3 billion, and Aave reopened deposits and borrowing across its V3 and V4 markets after a precautionary freeze. Ether fell 4.6% on the first reports and remains the higher-beta leg of the crypto complex, so it is likely to underperform on any further risk-off move.
Ethereum trade setup
ShortMedium conviction- Entry
- 2,310
- Stop loss
- 2,395
- Target 1
- 2,170
- Target 2
- 2,050
Risk $85 per coin. Reward:risk 1.6 to target 1, 3.1 to target 2.
Rationale: A loss of the 2,190 average, three weeks of ETF outflows and a postponed upgrade favour selling the bounce into the 2,313 average; the stop sits above the 2,389 week high.
Invalidation: A daily close above 2,395. A short squeeze once Binance reopens and a weak payroll print are the main risks.
XRP/USD | XRP / US Dollar
XRP Outlook: Ripple’s Token Holds the 1.2537 Average Inside a Narrowing Triangle
1.24759 -0.04697 (-3.63%) week Range 1.19800–1.34293
Outlook: Bias is neutral to higher while 1.1980 holds. XRP has fallen 3.63% on the weekly candle but lost less than Ether and Solana over seven days (about 2.0% on CoinMarketCap data) and is sitting on the 1.2537 average. The triangle apex is approaching, with a floor near 1.07 and a ceiling near 1.45–1.50. A sweep of last week’s low around 1.1800 is the zone to work from for a rebound.

Key levels
- Support 2
- 1.0700
- Support 1
- 1.1980
- Resistance 1
- 1.2537
- Resistance 2
- 1.4514
Weekly chart structure
- Structure: a triangle between a falling line from the July 2025 high near 3.65 and a rising line from mid-2024; price was rejected near 1.45–1.50 and the rising floor sits near 1.07.
- Averages: 1.99745 and 1.45136 sit above price, while price is on the 1.25366 average.
- Candle: bearish, opened 1.29409, has ranged 1.19800–1.34293 and is 3.63% lower.
- Momentum: RSI 45.06 sits under its 47.34 signal line, a soft reading short of oversold.
Key technical levels
1.2537 is the pivot; a weekly close above it and then above 1.2940, the week’s open, would target the 1.4514 average and the triangle ceiling. 1.1980 is the week’s low, and a weekly close below it exposes the rising floor near 1.07.
Fundamental drivers
ETF demand cools
US spot XRP funds recorded $1.84 million of net outflows in the week to 16 October, ending a 13-week run of inflows, though cumulative inflows are close to $1.8 billion. XRP held up better than most large coins this week, but its price is about 60% below its August 2025 level despite the dismissal of Ripple’s SEC lawsuit in 2025.
Regulation and the midterms
The CLARITY Act failed a Senate vote 49–50 on 15 September, so Tuesday’s midterms now shape whether a US market-structure law passes. Ripple also helped freeze funds linked to the Binance hack, which supports its institutional narrative but has not lifted the token.
XRP trade setup
LongLow conviction- Entry
- 1.1800
- Stop loss
- 1.1100
- Target 1
- 1.2940
- Target 2
- 1.4500
Risk $0.07 per coin. Reward:risk 1.6 to target 1, 3.9 to target 2.
Rationale: Relative strength against peers and a floor near 1.07 give a defined-risk dip buy at 1.1800, but the long is against the wider crypto trend, so conviction is low.
Invalidation: A daily close below 1.1100. Renewed ETF outflows or a hot payroll print are the main risks.
SOL/USD | Solana / US Dollar
Solana Outlook: SOL Is the Weakest Major on the Week as It Hugs the 96.84 and 92.46 Averages
95.69 -5.54 (-5.47%) week Range 92.14–103.77
Outlook: Bias is lower while 96.84 caps rallies. Solana has fallen 5.47% on the weekly candle, the worst of the five coins, and is about 20% below its 30 September level of $117.84. Price is trading between the 96.84 and 92.46 averages after a low of 92.14. Bounces into 96.00–98.00 are the zone to work from, and a weekly close below 92.14 would open the 85 area.

Key levels
- Support 2
- 85.00
- Support 1
- 92.14
- Resistance 1
- 96.84
- Resistance 2
- 103.77
Weekly chart structure
- Structure: a wide triangle, with a falling line from the September 2025 peak near 250 (now near 115) and a rising line from 2023 (now near 72).
- Averages: 137.74 sits well above price, while 96.84 and 92.46 bracket it tightly.
- Candle: bearish, opened 101.23, has ranged 92.14–103.77 and is 5.47% lower.
- Momentum: RSI 48.53 sits under its 53.56 signal line, so momentum is neutral and fading.
Key technical levels
96.84 is the first resistance, with the 103.77 week’s high above it; a weekly close above 103.77 would aim at the falling line near 115. 92.14 is first support, and a weekly close below it exposes 85.00 and then the rising line near 72.
Fundamental drivers
Risk beta and flows
Solana lost 5.6% over seven days on CoinMarketCap data and has fallen about 20% in a month. CoinGecko links the latest move to ETF outflows, even as the network integrated a Hong Kong dollar stablecoin and Ondo moved tokenised investment portfolios onto Solana.
Exchange risk and sentiment
SOL dropped about 6.8% in the first reaction to the Binance hack, as counterparty fears hit altcoins hardest. Hyperliquid, Zcash and Monero have been the week’s winners, which shows money rotating away from large smart-contract coins rather than out of crypto altogether.
Solana trade setup
ShortMedium conviction- Entry
- 97.00
- Stop loss
- 101.00
- Target 1
- 92.14
- Target 2
- 85.00
Risk $4.00 per coin. Reward:risk 1.2 to target 1, 3.0 to target 2.
Rationale: The weakest weekly candle, a month-long slide and tight averages overhead favour selling rallies into 96.84–98.00; the stop sits above the 101 area.
Invalidation: A daily close above 101.00. A relief rally once Binance withdrawals reopen is the main risk.
BNB/USD | BNB / US Dollar
BNB Outlook: Exchange Token Defends the Rising Trendline as Binance Plans to Reopen Withdrawals on Sunday
704.16 -33.47 (-4.54%) week Range 679.98–761.19
Outlook: Bias is neutral to higher while 680 holds, but the outcome is binary. BNB has fallen 4.54% on the weekly candle and dropped about 6.3% in the first hour after the hack, yet its 3.6% seven-day loss is smaller than Bitcoin, Ether or Solana. Price sits on the 697.64 average and the rising trendline. A dip to 680–690 is the zone to work from, with Binance’s reopening the swing factor.

Key levels
- Support 2
- 667.74
- Support 1
- 679.98
- Resistance 1
- 728.16
- Resistance 2
- 761.19
Weekly chart structure
- Structure: a triangle, with a falling line from the October 2025 peak near 1,350 (now near 760) and a rising line from the June 2026 low near 540 (now near 690).
- Averages: 728.16 sits above price, while 697.64 and 667.74 sit at and below it.
- Candle: bearish, opened 737.62, has ranged 679.98–761.19 and is 4.54% lower, with a long upper wick near 760.
- Momentum: RSI 51.07 sits under its 54.65 signal line, a neutral reading.
Key technical levels
728.16 is the first resistance and 761.19 the week’s high; a weekly close above 761.19 would break the falling line. 680 is first support, with the 667.74 average below; a weekly close under it breaks the rising trendline and exposes 650.
Fundamental drivers
The exchange-token paradox
Binance has set aside more than $6.34 billion in company funds, including about $5 billion in matching tokens, to cover losses, and says user funds are safe. Reports noted no reduction in BNB holdings among the stolen assets, which helps explain why BNB held up better than the wider market. Binance.US was not affected.
Reopening and proof of reserves
Binance expects withdrawals to resume on Sunday and has promised updated proof of reserves, with a technical post-mortem to follow. It has found additional points of breach beyond the compromised engineer laptop it first reported, and analysts link the attack to North Korea’s TraderTraitor group. A delay or a further finding would hit BNB first.
BNB trade setup
LongLow conviction- Entry
- 685
- Stop loss
- 650
- Target 1
- 728.16
- Target 2
- 760
Risk $35 per coin. Reward:risk 1.2 to target 1, 2.1 to target 2.
Rationale: A rising trendline, relative strength and a funded loss-cover plan favour buying a dip into 680–690; the stop sits below the 667.74 average, but conviction is low because the trade hinges on one event.
Invalidation: A daily close below 650. A delayed reopening, a new breach finding or a weak proof of reserves is the main risk.
Economic Calendar: 2–6 November 2026
| Date | Event | Market | Impact | Context |
|---|---|---|---|---|
| Time TBC | Binance targets reopening of deposits and withdrawals | BNB, all crypto | High | Binance said service should resume by Sunday morning; a delay would revive counterparty fears |
| Time TBC | Binance has promised updated proof of reserves | BNB, BTC, ETH | High | Reserve data after the $6.3 billion hack; a technical post-mortem is to follow |
| 15:00 GMT | US ISM Manufacturing PMI (October), forecast 54.7 | BTC, ETH, SOL | Medium | Prices-paid and employment details feed December Fed pricing |
| All day | US midterm elections | All crypto | High | Control of Congress and the CLARITY Act’s future; markets favour a Democratic House |
| 03:30 GMT | RBA rate decision, hike to 4.85% expected | BTC, ETH | Medium | A 25 bps hike to 4.85% is expected; a hawkish surprise would add to dollar strength |
| 15:00 GMT | US JOLTS job openings (September), forecast 7.11 million | BTC, ETH, SOL | Medium | Labour-demand read ahead of payrolls |
| 10:00 GMT | Euro area flash CPI (October), headline forecast 4.0% | BTC, ETH | Medium | Hot inflation keeps global hike pricing and the dollar firm |
| 13:15 GMT | US ADP employment (October) | BTC, ETH, SOL | Medium | Early read on Friday’s payrolls |
| 13:30 GMT (approx.) | US Treasury quarterly refunding announcement | BTC, ETH | Medium | Auction-size guidance steers long-end yields |
| 15:00 GMT | US ISM Services PMI (October), forecast 54.9 | BTC, ETH, SOL | Medium | Prices-paid component matters for the Fed |
| 12:00 GMT | BoE rate decision, hike to 4.00% expected | BTC, ETH | Medium | A first hike to 4.00% is expected; the vote split and guidance steer the dollar |
| 13:30 GMT | US initial jobless claims | BTC, ETH, SOL | Low | Last labour read before payrolls |
| 13:30 GMT | US nonfarm payrolls (October), forecast +55k to +63k; unemployment 4.2%; earnings 0.3% | All crypto | High | Decides December Fed hike pricing; expect a sharp first move |
| 15:00 GMT | University of Michigan sentiment, preliminary November, forecast 47.8 | BTC, ETH | Low | Inflation expectations were last at 4.7% |
| After US close | US spot Bitcoin and Ether ETF daily flow data (SoSoValue, Farside) | BTC, ETH, SOL, XRP | Medium | Tests whether institutional demand returns after the Binance shock |
All times are GMT. US clocks change on Sunday 1 November, so New York releases move one hour later in GMT terms. Binance has not announced exact times for the reopening or the proof of reserves.
Conclusion
An exchange shock, a hawkish Fed and a falling AI trade set the theme. A Binance reopening on Sunday, if it happens, will decide whether confidence returns; the midterms add policy uncertainty, and Friday’s payrolls will decide whether the Fed follows through in December. A strong print would test the 75,718 and 2,190 supports, while a weak one could lift the complex towards 80,000 and 2,313.
On conviction, BTC/USD, ETH/USD and SOL/USD rate medium as sells into resistance, while XRP/USD and BNB/USD rate low because they are dip buys against the wider trend, and BNB hinges on a single exchange event.
We treat every level as conditional, let the event windows pass before adding exposure and size positions so that a stop-out is affordable. Crypto trades all weekend, so gaps and wider spreads are likely around the Binance reopening, the midterm results and payrolls.
| Pair | Bias | Key level | Targets | Invalidation | Principal risk |
|---|---|---|---|---|---|
| BTC/USD | Sell near 79,800 | 75,718 | 76,200 / 72,950 | Above 82,000 | Weak payrolls, smooth Binance reopening |
| ETH/USD | Sell near 2,310 | 2,190 | 2,170 / 2,050 | Above 2,395 | Short squeeze after Binance reopens |
| XRP/USD | Buy near 1.1800 | 1.2537 | 1.2940 / 1.4500 | Below 1.1100 | ETF outflows, hot payrolls |
| SOL/USD | Sell near 97.00 | 96.84 | 92.14 / 85.00 | Above 101.00 | Relief rally on reopening |
| BNB/USD | Buy near 685 | 680 | 728.16 / 760 | Below 650 | Delayed Binance reopening |
Trade BTC/USD, ETH/USD and other crypto with Capital Street FX.
Frequently Asked Questions
What happened at Binance and why does it matter this week?
About $6.3 billion of assets were drained from Binance wallets on 29 October in the largest crypto theft on record, and about $3 billion has been frozen. Binance says it will cover all losses and expects withdrawals to resume on Sunday, so the planned reopening and Monday’s proof of reserves are the next tests of confidence.
When are the US jobs figures and why do they matter for Bitcoin?
Nonfarm payrolls are due on Friday 6 November at 13:30 GMT. With December Fed hike odds near 80%, a strong print would lift yields and pressure risk assets including crypto, while a weak one would reopen the debate and pull yields lower.
How could the US midterm elections affect crypto?
Voting takes place on Tuesday 3 November. The result shapes the future of the CLARITY Act, which failed a Senate vote 49–50 in September, and the broader fiscal and yield backdrop. Markets tend to react to the read-across for regulation and Treasury yields more than to the partisan result.
Why are Ether and Solana weaker than Bitcoin?
US spot Ether funds have had outflows for three straight weeks and the Glamsterdam testnet upgrade was postponed, while Solana is about 20% below its level a month ago. Both are higher-beta coins that tend to fall further when risk appetite weakens.
How can traders manage risk in an event-heavy week?
Reduce size before announcements, avoid new entries in the minutes around a release and allow for wider spreads and weekend gaps. Use defined stops rather than adding exposure after an initial spike, and avoid leaving large positions on any single exchange.