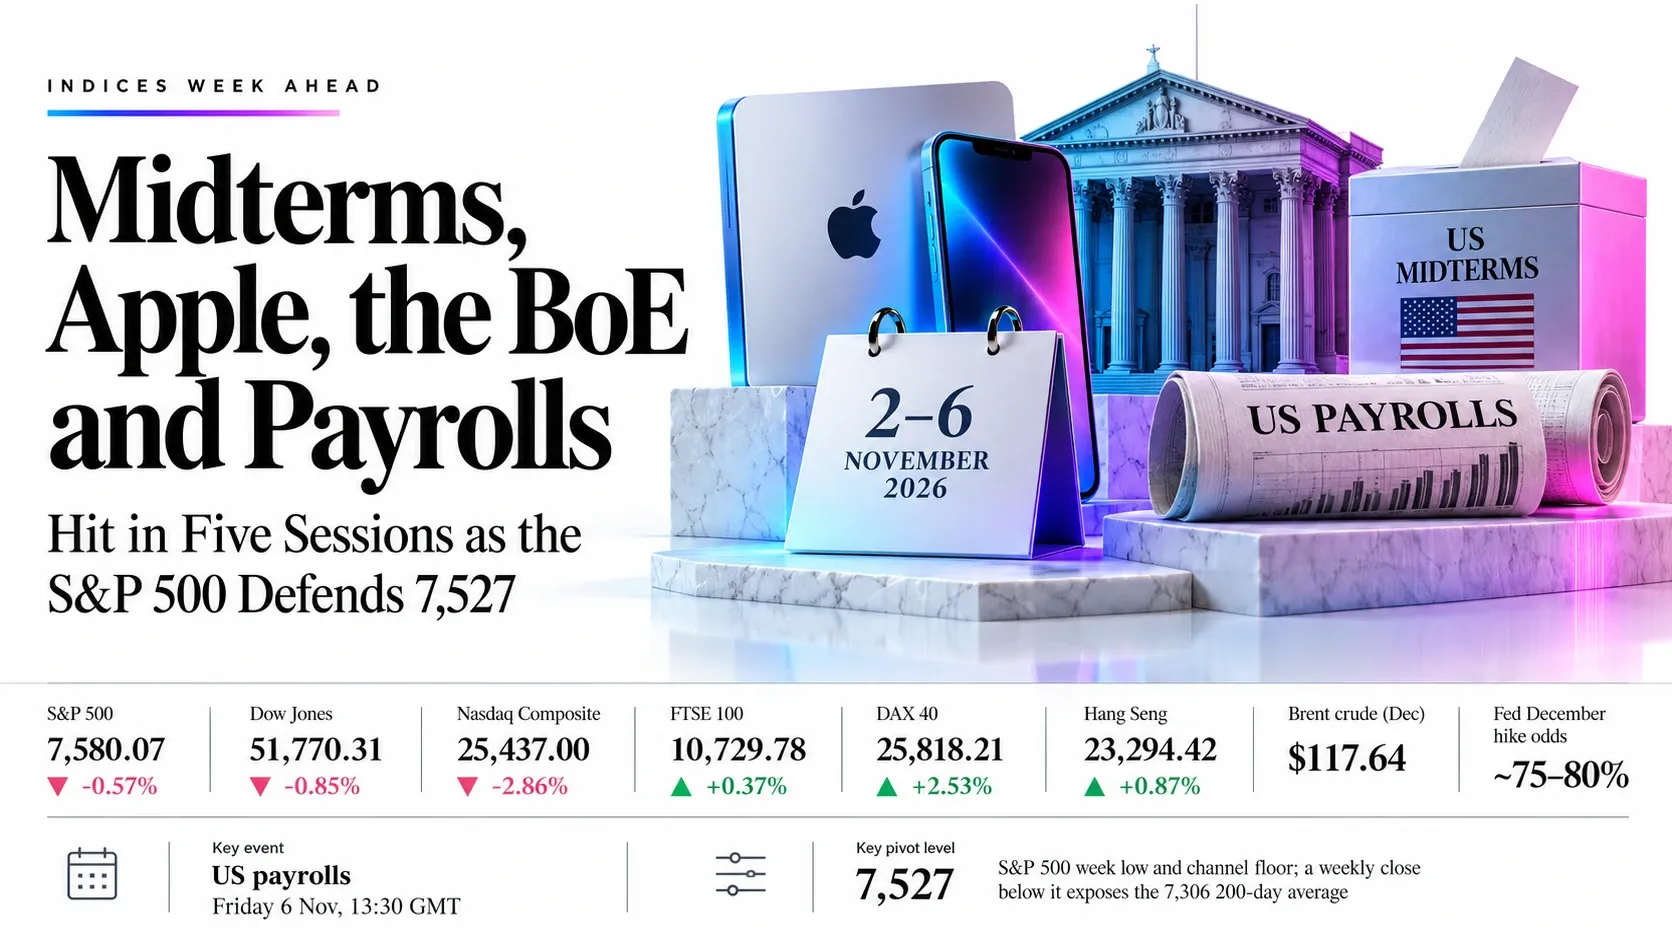
Week Ahead: Midterms, Apple, the BoE and Payrolls Hit in Five Sessions as the S&P 500 Defends 7,527 | Technical Analysis – Index Report | 31 Oct 2026
Indices Week Ahead | 2–6 November 2026
Week Ahead: Midterms, Apple, the BoE and Payrolls Land in Five Sessions as the S&P 500 Defends 7,527
- Weekly bias
- Event-led, cautious
- Tech-led selloff; Fed December hike odds 75–80%; UK and Germany relatively firm
- Expected volatility
- High
- Apple, midterms, BoE and payrolls between 21:00 GMT Monday and 13:30 GMT Friday
- Key event
- US payrolls
- Friday 6 Nov, 13:30 GMT
- Key pivot level
- 7,527
- S&P 500 week low and channel floor; a weekly close below it exposes the 7,306 200-day average
Market Overview
Five sessions, four catalysts, one fragile market. The week ahead stacks Apple and Palantir earnings (Monday), the US midterm elections (Tuesday), the Bank of England’s first hike in over three years (Thursday) and October payrolls (Friday) onto an equity market that has just been hit hard. The S&P 500 fell 1.82% on Friday to 7,580.07, its worst day since June, and now sits on its rising channel floor at 7,527. The Nasdaq Composite lost 2.86% and ended October down 5.3%, its worst month since March 2025, after Intel (-29%) and Amazon followed Alphabet in disappointing. A weekly close below 7,527 would expose the 7,306 200-day average.
Last week by index. The Dow fell 0.85% to 51,770.31 and the S&P 500 lost 0.57%. Europe held up better: the DAX gained 2.53% on the week to 25,818.21 despite a 0.85% drop on Friday, and the FTSE 100 added 0.37% to 10,729.78. The Hang Seng rebounded 1.46% on Friday to 23,294.42, up 0.87% on the week but down 5.36% in October. The Fed, ECB and BoJ all held rates, and Brent crude settled near $117 amid the Iran conflict, which keeps inflation, and therefore central banks, in focus.
What to watch, in GMT. US clocks go back on Sunday 1 November, so New York releases land one hour later. After Monday’s Apple and Palantir results (about 21:00 GMT), the midterms decide control of Congress on Tuesday, with AMD reporting after the US close. Euro area flash CPI follows on Wednesday at 10:00 GMT, the BoE decides on Thursday at 12:00 GMT, and payrolls arrive on Friday at 13:30 GMT with December Fed hike odds near 75–80%. More than 130 S&P 500 companies report in total.
We rank the strongest setups where macro direction and chart structure agree, and the weakest where an index sits mid-pattern ahead of a binary event.
Key highlights
- Fed: The Fed held and upgraded its view of the economy; Q3 GDP grew 3.4% and headline PCE rose to 3.6% y/y. December hike odds sit near 75–80%, so payrolls are decisive.
- AI trade: Intel fell 29% on Friday and Nvidia about 4–5%. Apple, Palantir, AMD and Qualcomm results decide whether the selloff widens.
- Midterms: Wall Street expects Democrats to win at least one chamber; AI oversight, defence spending and pharma pricing are the market risks.
- BoE: A hike to 4.00% is about 95% priced; the vote split matters more than the move.
- Europe: The ECB held; euro area flash CPI is forecast near 3.9–4.0%, and oil above $114 keeps inflation pressure high.
- China: The official manufacturing PMI fell to 49.3, and the Hang Seng Tech Index lost 11.73% in October.
Market Snapshot: Close, 30 October 2026
Dow Jones Dow Jones Industrial Average
51,770.31
-444.85-0.85% week
Range 51,569.16–52,639.26
50,19054,700
Sell near 52,430S&P 500 S&P 500 Index
7,580.07
-43.61-0.57% week
Range 7,527.56–7,758.43
7,3067,819
Sell near 7,640FTSE 100 UK 100 Index
10,729.78
+39.41+0.37% week
Range 10,643.25–10,778.72
10,40310,950
Buy near 10,690DAX 40 Germany 40 Index
25,818.21
+636.56+2.53% week
Range 25,217.15–26,106.19
24,77626,700
Buy near 25,560Hang Seng Hong Kong Hang Seng Index
23,294.42
+201.05+0.87% week
Range 22,928.27–23,400.02
22,51824,414
Buy near 22,900- Nasdaq Composite
- 25,437.00
- -2.86% Friday; -5.3% in October
- Brent crude (Dec)
- $117.64
- WTI settled at $104.12
- Fed December hike odds
- ~75–80%
- Payrolls decide
- Hang Seng Tech Index
- 3,754.90
- Near a two-year low; -11.73% in October
Trade Setups for the Week
| Index | Direction | Entry | Stop | Target 1 | Target 2 | Reward:risk | Conviction |
|---|---|---|---|---|---|---|---|
| FTSE 100 | Long | 10,690 | 10,580 | 10,880 | 10,950 | 1.7 / 2.4 | Medium |
| DAX 40 | Long | 25,560 | 25,150 | 26,100 | 26,700 | 1.3 / 2.8 | Medium |
| S&P 500 | Short | 7,640 | 7,765 | 7,440 | 7,306 | 1.6 / 2.7 | Medium |
| Hang Seng | Long | 22,900 | 22,400 | 23,500 | 24,414 | 1.2 / 3.0 | Low |
| Dow Jones | Short | 52,430 | 52,950 | 51,570 | 50,190 | 1.7 / 4.3 | Low |
Reward:risk is the distance from entry to target 1 and target 2, divided by the distance from entry to the stop. Levels are conditional technical references, not recommendations.
Key Market Drivers
Tech earnings decide whether the AI selloff widens
Alphabet, Amazon and Intel left investors questioning AI returns, and Nvidia, AMD and Broadcom fell sharply on Friday. Apple and Palantir report on Monday, AMD on Tuesday and Qualcomm in the same week, so guidance tone matters more than the headline beat. BTIG flags a possible test of the S&P 500’s 200-day average at 7,306.
Key events: Monday 2 November, Apple and Palantir after the US close; Tuesday 3 November, AMD after the US close.
Midterms add policy risk to an AI-wary market
Early polls and prediction markets give Democrats a shot at both chambers. Bloomberg reports strategists fear tougher AI oversight, data-centre pushback and defence cuts, while the Dow has averaged a 2.8% gain around midterms since 1934 and November is a strong month for midterm years. A Democratic sweep could lower Treasury yields and hurt tech.
Key events: Tuesday 3 November, US elections; results flow into Wednesday 4 November GMT.
Payrolls decide whether the Fed hikes in December
The Fed held rates this week and called the economy stronger after Q3 GDP of 3.4%, with headline PCE at 3.6%. Consensus for October payrolls is about +55k with unemployment steady at 4.2%, after September’s +29k. A beat would lift December odds above 80% and pressure rate-sensitive equities; a miss would pull yields lower but raise growth fears.
Key events: Monday 2 November, ISM manufacturing at 15:00 GMT; Wednesday 4 November, ISM services at 15:00 GMT; Friday 6 November, payrolls at 13:30 GMT.
The BoE, euro area CPI and China data steer the other three indices
The BoE is expected to lift rates to 4.00% on Thursday, the first hike in over three years, while euro area flash CPI on Wednesday is forecast near 3.9–4.0%. China’s official PMI fell to 49.3, leaving the Hang Seng reliant on stimulus hopes. Brent above $114 ties the three together through inflation.
Key events: Wednesday 4 November, euro area flash CPI at 10:00 GMT; Thursday 5 November, BoE at 12:00 GMT and Bailey at 12:30 GMT; Thursday 5 November, Lagarde at 18:00 GMT.
S&P 500 7,527 and DAX 25,540 mark the two lines most exposed to a payrolls surprise. A weekly close beyond either would change the picture for equities.
NFP Scenario Analysis
Consensus is for payrolls of about +55k, unemployment at 4.2% and a steady earnings gain. The report is due on Friday 6 November at 13:30 GMT, after the midterm result and the BoE decision, so its impact stacks on top of two earlier shocks.
Strong payrolls: a beat seals December and lifts yields
Higher yield expectations pressure valuations and extend the AI-led selloff.
- Dow Jones51,569, then 50,190
- S&P 5007,527, then 7,306
- FTSE 10010,685, then 10,403
- DAX 4025,540, then 25,217
- Hang Seng22,803, then 22,518
Weak payrolls: a miss reopens the December debate
Lower yield expectations support a relief rally, unless growth fears take over.
- Dow Jones52,429, then 53,000
- S&P 5007,618, then 7,758
- FTSE 10010,779, then 10,880
- DAX 4026,106, then 26,700
- Hang Seng23,500, then 24,000
Dow Jones | Dow Jones Industrial Average
Dow Jones Outlook: Blue Chips Slip to the Triangle Floor Below the 52,429 Average
51,770.31 -444.85 (-0.85%) week Range 51,569.16–52,639.26
Outlook: Bias is lower while 52,429 caps rallies. The Dow fell 0.85% on the week, 1.09% on Friday alone, and closed under the 52,429 average inside a narrowing triangle. The October gain of 1.5% shows defensives held up better than tech, but Friday’s broad selloff pulled price to the rising floor near 51,570. The zone to sell from is 52,300–52,450; a weekly close below 51,569 opens 50,190.

Key levels
- Support 2
- 50,190
- Support 1
- 51,569
- Resistance 1
- 52,429
- Resistance 2
- 54,700
Weekly chart structure
- Structure: a falling line from the August high near 54,700 and a rising line from the spring low are converging, so a breakout is close.
- Averages: 52,429 sits just above price; 50,190 and 46,962 sit below and rising.
- Candle: bearish, opened 52,325, ranged 51,569–52,639 and closed 0.85% lower.
- Momentum: RSI 52.05 sits under its 59.63 signal line, so momentum is fading from neutral.
Key technical levels
52,429 is the cap; a weekly close above the triangle top near 53,000 would reopen the August high. 51,569 is the week’s low and triangle floor; a close beneath it exposes the 50,190 average.
Fundamental drivers
Earnings and AI sentiment
Apple and Palantir report on Monday after the US close, and AMD, Amgen and Pfizer follow on Tuesday. The Dow has less tech weight than the Nasdaq, which is why it gained 1.5% in October while the Nasdaq lost 5.3%, but Friday’s 572-point drop shows it is not immune.
Midterms and payrolls
Stock Trader’s Almanac data cited by CNBC show the Dow averaging a 2.8% gain in the eight sessions around midterm elections since 1934, a seasonal tailwind against the selloff. Payrolls at 13:30 GMT on Friday decide the December Fed hike pricing.
Dow Jones trade setup
ShortLow conviction- Entry
- 52,430
- Stop loss
- 52,950
- Target 1
- 51,570
- Target 2
- 50,190
Risk 520 points. Reward:risk 1.7 to target 1, 4.3 to target 2.
Rationale: Two overhead caps, a falling triangle line and tech-led selling favour selling rallies; the 52,430–52,950 band defines the risk.
Invalidation: A daily close above 52,950. Midterm-driven relief and a soft payroll print that lowers yields are the main risks.
S&P 500 | S&P 500 Index
S&P 500 Outlook: Worst Day Since June Leaves Index on the 7,527 Channel Floor
7,580.07 -43.61 (-0.57%) week Range 7,527.56–7,758.43
Outlook: Bias is lower while 7,618 caps rallies. The index lost 0.57% on the week after a 1.82% drop on Friday, its biggest one-day fall since 5 June, and sits 3.05% below the 7,818.93 record close of 6 October. Intel, Amazon and Alphabet results revived doubts over AI spending. BTIG’s Jonathan Krinsky flagged a test of the 200-day average at 7,306. Sell rallies into 7,600–7,650 rather than chase.

Key levels
- Support 2
- 7,306
- Support 1
- 7,527
- Resistance 1
- 7,618
- Resistance 2
- 7,819
Weekly chart structure
- Structure: a rising channel since the spring low; price is at its lower boundary, so a weekly close below 7,527 would break it.
- Averages: 7,618 sits above price; 7,226 and 6,670 sit below and rising.
- Candle: bearish, opened 7,639.70, ranged 7,527.56–7,758.43 and closed 0.57% lower, giving back most of Thursday’s gains.
- Momentum: RSI 53.57 sits under its 62.06 signal line, a bearish cross that is still above 50.
Key technical levels
7,527 is first support; a weekly close below it exposes 7,306 (200-day) and the 7,226 weekly average. 7,618 and the 7,758 week high are the barriers, and the 7,819 record close is the line for bulls.
Fundamental drivers
AI trade under test
Nasdaq ended October down 5.3%, its worst month since March 2025, and tech fell almost 5% on Friday as Intel dropped 29% and Nvidia fell about 4–5%. Apple and Palantir report on Monday, AMD on Tuesday and Qualcomm this week; more than 100 S&P 500 companies report in total.
Midterms and policy
Bloomberg reports Wall Street expects Democrats to win at least one chamber, with AI oversight, defence spending and crypto legislation in play. Seasonality is supportive, with November the best month for the Nasdaq in midterm years, which is why conviction is limited.
S&P 500 trade setup
ShortMedium conviction- Entry
- 7,640
- Stop loss
- 7,765
- Target 1
- 7,440
- Target 2
- 7,306
Risk 125 points. Reward:risk 1.6 to target 1, 2.7 to target 2.
Rationale: A rising channel at risk, a bearish RSI cross and a hawkish Fed backdrop favour selling rallies; the 7,640–7,765 band defines the risk.
Invalidation: A daily close above 7,765. A relief rally on soft payrolls or strong Apple and AMD results is the main risk.
FTSE 100 | UK 100 Index
FTSE 100 Outlook: London Holds the 10,685 Average Into the BoE’s First Hike
10,729.78 +39.41 (+0.37%) week Range 10,643.25–10,778.72
Outlook: Bias is neutral to higher while 10,685 holds. The index gained 0.37% on the week to 10,729.78 and edged up on Friday with oil majors in support, while AstraZeneca jumped 7% on results during the week and NatWest slid 8.6%. A quarter-point hike to 4.00% is about 95% priced, so the vote split decides. Dips toward 10,685–10,700 are the zone to work from.

Key levels
- Support 2
- 10,403
- Support 1
- 10,685
- Resistance 1
- 10,779
- Resistance 2
- 10,950
Weekly chart structure
- Structure: a rising lower line from the spring low and a flat-to-falling upper line form a narrowing triangle near its apex.
- Averages: 10,684.82 sits just beneath price; 10,403 and 9,617 sit below.
- Candle: small bullish body, opened 10,690.94, ranged 10,643–10,779 and closed 0.37% higher.
- Momentum: RSI 54.47 sits under its 57.01 signal line, so momentum is neutral.
Key technical levels
10,685 is the line to hold; a weekly close below it and the triangle floor exposes 10,403. 10,779 is the week’s high, and a close above the triangle top near 10,880 opens the 10,950 early-2026 high.
Fundamental drivers
BoE decision
Consensus is a 25 bps hike to 4.00% from 3.75% at 12:00 GMT on Thursday, the first rise in over three years. Oxford Economics calls it “a done deal”, and MUFG sees a further hike in February to 4.25%. Bailey’s press conference follows at 12:30 GMT.
Energy, banks and the Budget
Brent near $117 supports BP and Shell. Chancellor Healey doubled the bank surcharge to 6% and kept about £15bn of headroom, so banks reacted well, though NatWest’s result was a drag. A hawkish vote split lifts banks and caps exporters.
FTSE 100 trade setup
LongMedium conviction- Entry
- 10,690
- Stop loss
- 10,580
- Target 1
- 10,880
- Target 2
- 10,950
Risk 110 points. Reward:risk 1.7 to target 1, 2.4 to target 2.
Rationale: Triangle floor, a rising average and oil-major support favour buying dips; the 10,580 level below the week’s low defines the risk.
Invalidation: A daily close below 10,580. A dovish BoE vote split or a sharp fall in oil is the main risk.
DAX 40 | Germany 40 Index
DAX 40 Outlook: Germany Gains 2.5% on the Week but Stalls Under 26,106
25,818.21 +636.56 (+2.53%) week Range 25,217.15–26,106.19
Outlook: Bias is higher while 25,540 holds. The DAX rose 2.53% on the week, its best of the group, after a four-day winning streak ended on Friday with a 0.85% drop to 25,818.21 as oil rose and tech sold off. The ECB hold on Thursday and strong earnings drove the rally to a high of 26,106. Pullbacks to 25,540–25,600 are the zone to work from.

Key levels
- Support 2
- 24,776
- Support 1
- 25,540
- Resistance 1
- 26,106
- Resistance 2
- 26,700
Weekly chart structure
- Structure: a rising channel from the spring low; price is above the midline and well clear of the lower boundary.
- Averages: 25,539.88, 24,775.60 and 23,812.61 all sit below price and rising.
- Candle: bullish with an upper wick, opened 25,235.84, ranged 25,217–26,106 and closed 2.53% higher.
- Momentum: RSI 55.32 sits just under its 55.91 signal line, so momentum is neutral to positive.
Key technical levels
26,106 is the week’s high and the first barrier; a weekly close above it points to the 26,700 late-summer high. 25,540 is first support, and a close beneath it and the 25,217 week low exposes 24,776.
Fundamental drivers
ECB and euro area inflation
The ECB held on Thursday, noting no second-round effects from energy prices so far. Euro area flash CPI is due on Wednesday at 10:00 GMT, with forecasts of about 3.9–4.0% (prev. 3.8%); a hot print keeps a December hike alive and weighs on rate-sensitive stocks.
Earnings and energy
Bayer, BMW, Deutsche Telekom, Rheinmetall and Commerzbank report in the coming days. Brent above $114 and the Iran conflict add cost pressure, while European tech followed the US lower on Friday. German ZEW current conditions improved to -35.9 in October, showing a fragile recovery.
DAX 40 trade setup
LongMedium conviction- Entry
- 25,560
- Stop loss
- 25,150
- Target 1
- 26,100
- Target 2
- 26,700
Risk 410 points. Reward:risk 1.3 to target 1, 2.8 to target 2.
Rationale: A rising channel, rising averages and a strong weekly close favour buying pullbacks; the 25,150 level below the week’s low defines the risk.
Invalidation: A daily close below 25,150. A hot euro area CPI print or a further AI-led Wall Street slide is the main risk.
Hang Seng | Hong Kong Hang Seng Index
Hang Seng Outlook: Index Rebounds 1.46% Off the Triangle Floor After a 5.4% October Loss
23,294.42 +201.05 (+0.87%) week Range 22,928.27–23,400.02
Outlook: Bias is cautiously higher while 22,803 holds. The index gained 0.87% on the week, ending a two-week losing streak, after Friday’s 1.46% rebound to 23,294.42, though it lost 5.36% in October and the Tech Index fell 11.73%. China’s official PMI slipped to 49.3, so rallies face supply under 24,414. The zone to buy from is 22,800–22,950.

Key levels
- Support 2
- 22,518
- Support 1
- 22,803
- Resistance 1
- 23,500
- Resistance 2
- 24,414
Weekly chart structure
- Structure: a falling line from the January high near 28,056 and a rising line from 2024 are converging; price is at the floor.
- Averages: 24,414, 24,519 and 25,359 all sit above price, so the trend remains down.
- Candle: bullish, opened 23,156.96, ranged 22,928–23,400 and closed 0.87% higher.
- Momentum: RSI 37.96 sits under its 47.08 signal line and near oversold, which argues for a bounce rather than a trend change.
Key technical levels
22,803 is the October low and 22,518 the 52-week low; a weekly close below the floor exposes both. 23,500 is first resistance, and the 24,414–24,519 average cluster is the line a recovery must clear.
Fundamental drivers
China data and stimulus
The official manufacturing PMI fell to 49.3 from 50.1, the composite to 49.7, and new orders dipped below 50 while high-tech stayed above it. Investors are waiting for Beijing support measures; mainland blue chips had their worst month since early 2016.
Tech and global spillover
Tencent, SMIC and AI-linked names led the October losses, and HSBC fell 5.6% after a revenue miss. Friday’s rebound came from financials, energy and consumer stocks, with Sinopec up on a 57% rise in quarterly profit. A weak Wall Street open on Monday is the main risk.
Hang Seng trade setup
LongLow conviction- Entry
- 22,900
- Stop loss
- 22,400
- Target 1
- 23,500
- Target 2
- 24,414
Risk 500 points. Reward:risk 1.2 to target 1, 3.0 to target 2.
Rationale: A rising triangle floor, a 52-week low just below and oversold momentum favour buying dips; the 22,400 level defines the risk.
Invalidation: A daily close below 22,400. A deeper Wall Street tech slide or weak China data is the main risk.
Economic Calendar: 2–6 November 2026
| Date | Event | Market | Impact | Context |
|---|---|---|---|---|
| 01:45 GMT (approx.) | China RatingDog manufacturing PMI (October) | Hang Seng | Med | Follows the official PMI of 49.3; stimulus hopes |
| 15:00 GMT | US ISM Manufacturing PMI (October), forecast 54.7 | Dow, S&P 500 | Med | Prices-paid detail feeds December Fed pricing |
| After US close (~21:00 GMT) | Apple and Palantir earnings (Q3) | S&P 500, Dow | High | First big tech test after Intel, Amazon and Alphabet |
| All day | US midterm elections; results flow into Wed 4 Nov GMT | All US indices | High | Control of Congress; AI regulation, defence and pharma pricing in focus |
| 15:00 GMT | US JOLTS job openings (September), forecast 7.11 million | Dow, S&P 500 | Med | Labour-demand read ahead of payrolls |
| After US close (~21:00 GMT) | AMD, Amgen and Booking earnings | S&P 500 | High | AMD tests AI-chip demand; 7,527 support in focus |
| 10:00 GMT | Euro area flash CPI (October), headline forecast 3.9–4.0%, core 2.5–2.6% | DAX 40 | High | A hot print keeps a December ECB hike in view; 25,540 support |
| 13:15 GMT | US ADP employment (October) | Dow, S&P 500 | Med | Early read on Friday’s payrolls |
| 15:00 GMT | US ISM Services PMI (October), forecast 54.9 | Dow, S&P 500 | Med | Prices-paid component matters for the Fed |
| 12:00 GMT | BoE rate decision and Monetary Policy Report, hike to 4.00% expected | FTSE 100 | High | Vote split and guidance; 10,685 support, 10,779 resistance |
| 12:30 GMT | BoE Governor Bailey press conference | FTSE 100 | Med | Tone on a further hike in February |
| 13:30 GMT | US weekly jobless claims | Dow, S&P 500 | Low | Labour-market signal before payrolls |
| 18:00 GMT | ECB President Lagarde speaks | DAX 40 | Med | December hike signal in focus |
| 10:00 GMT | Euro area retail sales (September) | DAX 40 | Low | Consumer demand under energy-driven inflation |
| 13:30 GMT | US nonfarm payrolls (October), forecast about +55k; unemployment 4.2% | All indices | High | Decides December Fed hike pricing (September was +29k) |
| 15:00 GMT | University of Michigan sentiment, preliminary November, forecast 47.8 | Dow, S&P 500 | Low | Inflation expectations last at 4.7% |
All times are GMT. US clocks change on Sunday 1 November, so New York releases move one hour later in GMT terms. Earnings times are approximate.
Conclusion
Earnings, politics and central banks set the theme. Apple and AMD test the AI trade, the midterms add policy uncertainty, the BoE is expected to hike, and Friday’s payrolls decide whether the Fed follows in December. A strong print would extend the selloff, while a weak one would offer relief.
On conviction, the FTSE 100, DAX 40 and S&P 500 rate medium, while the Hang Seng and the Dow rate low because the first needs China support and the second sits inside a triangle with midterm seasonality against the sellers.
We treat every level as conditional, let the event windows pass before adding exposure and size positions so that a stop-out is affordable. Spreads can widen sharply around Apple, AMD, the BoE and payroll releases.
| Index | Bias | Key level | Targets | Invalidation | Principal risk |
|---|---|---|---|---|---|
| FTSE 100 | Buy near 10,690 | 10,685 | 10,880 / 10,950 | Below 10,580 | Dovish BoE vote split, oil slump |
| DAX 40 | Buy near 25,560 | 25,540 | 26,100 / 26,700 | Below 25,150 | Hot euro CPI, Wall Street slide |
| S&P 500 | Sell near 7,640 | 7,527 | 7,440 / 7,306 | Above 7,765 | Relief rally on soft NFP, strong Apple/AMD |
| Hang Seng | Buy near 22,900 | 22,803 | 23,500 / 24,414 | Below 22,400 | Tech slide, weak China data |
| Dow Jones | Sell near 52,430 | 52,429 | 51,570 / 50,190 | Above 52,950 | Midterm relief, soft payrolls |
Trade the Dow Jones, S&P 500, FTSE 100, DAX 40 and Hang Seng with Capital Street FX.
Frequently Asked Questions
Which events decide the indices this week?
Apple and Palantir report on Monday after the US close, the US midterms are on Tuesday, euro area flash CPI lands on Wednesday at 10:00 GMT, the BoE decides on Thursday at 12:00 GMT and US payrolls arrive on Friday at 13:30 GMT. Payrolls matter most because December Fed hike odds sit near 75–80%.
Why did the S&P 500 and Nasdaq fall so sharply on Friday?
Disappointing results from Intel and Amazon, following Alphabet, revived doubts that heavy AI spending will pay off. The S&P 500 fell 1.82% and the Nasdaq Composite 2.86%, each their worst day since June, with Intel down 29%.
How could the US midterm elections affect stocks?
Wall Street expects Democrats to win at least one chamber, which raises the prospect of tougher AI oversight and changes to defence and pharma policy. History is kinder: the Dow has averaged a 2.8% gain in the eight sessions around midterms, though this year’s AI selloff could outweigh seasonality.
Will the Bank of England hike and what does it mean for the FTSE 100?
Markets put a 25 bps hike to 4.00% at about 95%. The vote split and guidance on February matter more; a hawkish tone lifts banks while a dovish one would weigh on sterling-sensitive and rate-sensitive stocks.
How can traders manage risk in an event-heavy week?
Reduce size before announcements, avoid new entries in the minutes around a release and allow for wider spreads. Index gaps can jump past stops, so use defined stops and size positions so that a stop-out is affordable.