Wall Street Rebounds From AI Rout as Oil Plunges on US-Iran Talks: Dow Surges 1%, S&P 500 Holds 7,618, DAX Tests 26,000 With Apple, Palantir and the Midterms Next | Technical Analysis – Index Report | 02 Nov 2026
Indices Live | Monday 2 November 2026 | 16:25 GMT | London close approaching, US morning session
Wall Street Rebounds From AI Rout as Oil Plunges on US-Iran Talks: Dow Surges 1%, S&P 500 Holds 7,618, DAX Tests 26,000 With Apple, Palantir and the Midterms Next
Market Overview
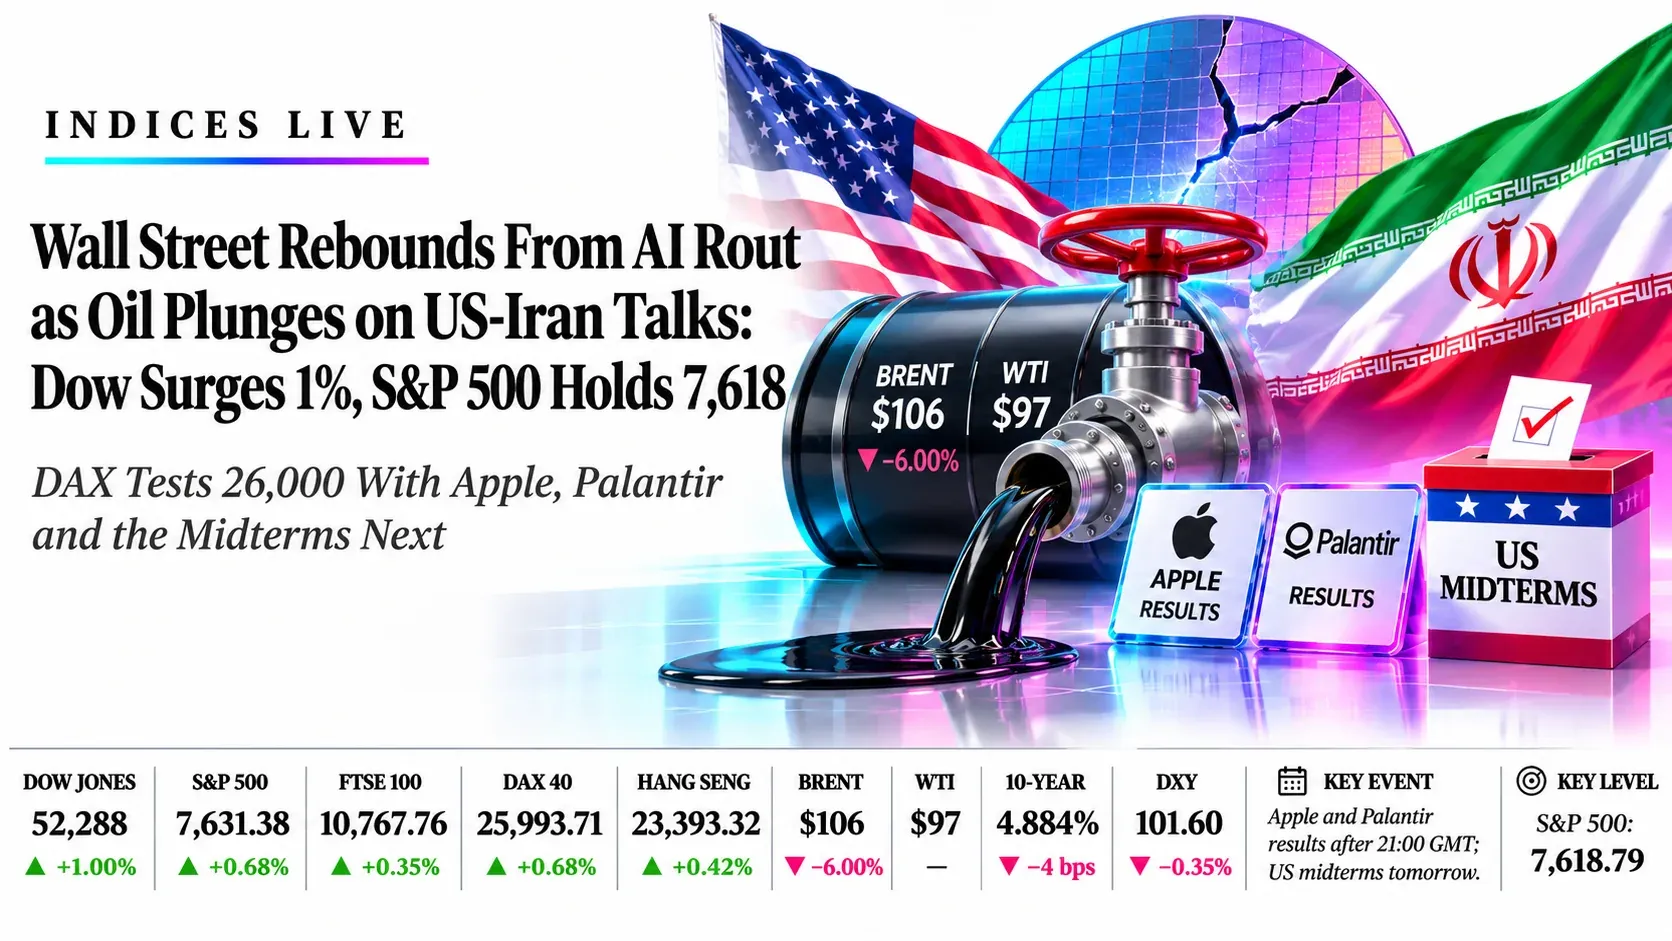
Wall Street is staging a sharp, oil-fuelled rebound from last week’s $5 trillion AI rout: the Dow is up about 1% and the Nasdaq more than 1% as crude plunges on US-Iran diplomacy hopes, but the S&P 500 is clinging to its 7,618.79 slow average and the real tests land after the bell, with Apple and Palantir results tonight and the US midterm elections tomorrow. As of about 16:20 GMT, the Dow (52,288, +1.00%) sits above its 52,198.48 and 52,055.51 averages, and the S&P 500 (7,631, +0.68%) is only about 12 points above its 7,618.79 slow average and under 7,696.52 and 7,723.53. At 16:02 GMT the FTSE 100 (10,767.76, +0.35%) was holding mid-range, the DAX 40 (25,993.71, +0.68%) was pressing 26,000 above three averages, and the Hang Seng closed at 23,393.32 (+0.42%) and remains under all three of its averages inside a falling channel.
Oil is the engine. Brent has fallen about 6% to roughly $106 and WTI is near $97, after Secretary of State Rubio said Trump would rather end the Iran war peacefully, Iran’s foreign minister said a deal is possible if Washington shows goodwill, and Qatar-mediated talks have continued. Brent traded above $114 on Friday. Cheaper crude has pulled the 10-year Treasury yield down about 4 basis points to 4.884% and the dollar index 0.35% lower to 101.60, while ISM prices paid eased to 75.2 from 77.9. The risk is that the market had priced in escalation after the midterms, so any sign that diplomacy is stalling would reverse the move fast. The Fed held at 3.75% to 4.00% on 28 October with two dissents in favour of a hike, and a December hike is still priced near 70%. The clock: Europe closes at 16:30 GMT, Apple and Palantir report after the 21:00 GMT US close, the midterms follow tomorrow, the Bank of England decides this week and the US jobs report lands on Friday.
Key highlights
- Dow Jones: Price is about 52,288, above the 52,198.48 and 52,055.51 averages; 52,800 caps and 51,400 is the triangle floor.
- S&P 500: Price is about 7,631, just above the 7,618.79 slow average and under 7,696.52 and 7,723.53; 7,500 is the next floor.
- FTSE 100: Price was 10,767.76 at 16:02 GMT, mid-range; 10,890 and 10,990 are the highs, 10,640 and 10,470 the supports.
- DAX 40: Price was 25,993.71 at 16:03 GMT, above the 25,576.70, 25,522.91 and 25,433.45 averages; RSI 59.28; 26,022 and 26,520 are the hurdles.
- Hang Seng: Price is 23,393.32 under the 23,708.53 average; RSI 41.37; 22,750 is the key support.
What’s Moving Markets Today
Oil plunges about 6% as the US and Iran signal talks, with Brent near $106 and WTI near $97
Crude fell to session lows after Secretary of State Rubio said Trump would prefer to end the Iran war peacefully and has not decided on an attack, while Iran’s foreign minister said a deal is possible if Washington shows goodwill after two days of Qatar-mediated talks. Axios reported Trump told Netanyahu he would give diplomacy more time. Brent traded above $114 on Friday after jumping about 14% in October, and analysts note the market had priced in escalation after the midterms, so a sharp unwind is possible if none follows. Falling energy costs are lifting airlines, consumer and industrial shares and easing yields, but they are pressing BP and Shell in London.
Source: CNBC, Bloomberg, Yahoo Finance, Axios via The National, Saxo, 2 Nov 2026
Wall Street rebounds from its worst session since June: Dow up about 1%, S&P 500 up about 0.7%, Nasdaq up more than 1%
US stocks opened higher as tech bounced from a rout that took the Nasdaq down 5.2% in October and wiped about $5 trillion from AI-linked shares. Friday’s drop took the S&P 500 down 1.82% and the Nasdaq down 2.86%, and the S&P 500 posted a third straight weekly loss. Energy is the main laggard while consumer discretionary, materials and industrials lead. Strategists describe the recovery as a willingness to buy weakness, but confidence in tech is still fragile.
Source: Yahoo Finance, Investrade, TheStreet, CNBC, 2 Nov 2026
Apple and Palantir report after the US close, with Apple worth about $5 trillion and the only Magnificent Seven stock beating the S&P 500 this year
Apple is expected to report EPS near $2.00 on revenue of about $113.4 billion, with iPhone 18 sales and guidance in focus, and its shares are slightly lower ahead of the print. Palantir is expected to report EPS of $0.41 on revenue of about $2.18 billion after its shares fell 6.3% on Friday. Strong results could stabilise the Nasdaq, while weak guidance could quickly undo today’s rebound, so these will drive after-hours futures and tomorrow’s Asian open rather than today’s cash levels.
Source: Yahoo Finance, Benzinga, Bloomberg consensus, 2 Nov 2026
US midterm elections tomorrow, the Bank of England decision and Friday’s jobs report make this a week packed with catalysts
Tuesday’s midterms are the biggest political event of the week, and investors will watch the balance of power in Congress. History offers some comfort, as the S&P 500 has risen in all 19 November-to-April windows after a midterm election. The Bank of England decides on rates this week, and the October jobs report on Friday is forecast at roughly 62,000 jobs with unemployment steady.
Source: Yahoo Finance, Benzinga, Share Talk, 2 Nov 2026
US factory data stays firm, but prices paid ease to 75.2 and the dollar and yields slip
ISM manufacturing showed new orders at 55.5, up from 55.3, and employment at 52.4, down from 52.7, while prices paid eased to 75.2 from 77.9, still elevated on energy costs and tariffs. A separate S&P Global survey also showed factory expansion at a slower pace. The easing in prices paid, plus cheaper oil, has kept the data from reviving hike bets, and the dollar index is down 0.35% at 101.60.
Source: ISM, Yahoo Finance, ActionForex, FXStreet, 2 Nov 2026
The Fed held at 3.75% to 4.00% last week with two hike dissents, and a December hike is still priced near 70%
Cook and Hammack voted for a quarter-point rise on 28 October. Polymarket put a December hike at about 69.5% on Sunday night. With the 10-year yield at 4.884% and the 2-year at 4.585% after the morning drop, any oil rebound that lifts yields again would be the quickest way to stall the equity bounce.
Source: Rio Times (Polymarket data), CNBC, 2 Nov 2026
Europe edges higher into the 16:30 GMT close as Alstom plunges, energy lags and airlines gain
London was little changed through the morning with BP and Shell down 1% to 2% on crude and IAG up about 2% on cheaper fuel, before the FTSE 100 turned higher into the afternoon. Alstom fell about 27% after cutting its margin outlook, while Lufthansa and Air France gained. At 16:02 to 16:03 GMT the DAX was up 0.68% and the FTSE 100 up 0.35%.
Source: Reuters, Investing.com, Share Talk, Maaal, 2 Nov 2026
Hang Seng closes up 0.42% at 23,393.32, led by a 2.25% jump in the Tech Index
Technology, semiconductor, optical-communications and lithium-battery names supported the market on turnover of HKD 204.84 billion, while Bank of China and Bank of China Hong Kong were among the weakest constituents. Investors are still weighing AI-spending concerns, upcoming US earnings and possible Chinese capital-market support. Hong Kong reopens at 01:30 GMT.
Source: Xinhua via NAMPA, Yahoo Finance, 2 Nov 2026
Key Drivers for the Rest of Today
Six things that set direction for the rest of the session in the Dow, S&P 500, FTSE 100, DAX 40 and Hang Seng. All times are GMT.
- Oil and US-Iran headlines
- Live
- Ongoing, all session
- Brent is down roughly 6% to 7% on diplomacy hopes. A stall in talks would reverse the bid; progress would extend it
- European cash close
- 16:30
- Mon 2 Nov, 16:30 GMT
- Sets the daily close for the FTSE 100 and DAX 40, with the DAX holding 26,000 the key test
- US yields and the dollar after the ISM
- Live
- Ongoing, all session
- The 10-year yield is near 4.88% and the dollar index near 101.60; a reversal higher would pressure the S&P 500 first
- Apple and Palantir results
- After 21:00
- Mon 2 Nov, after the US close
- Both report after the cash close, so they drive after-hours futures and the next Asian open rather than today’s regular-session levels
- US cash close
- 21:00
- Mon 2 Nov, 21:00 GMT
- Daily candles on the Dow and S&P 500 close here, the reference for the 7,618.79 and 52,055.51 levels
- Hong Kong reopens
- 01:30
- Tue 3 Nov, 01:30 GMT
- The Hang Seng’s next cash session, where the 23,708.53 average is the first test after today’s tech-led bounce
Trade Setups for Today
Ranked in the order Dow Jones, S&P 500, FTSE 100, DAX 40 and Hang Seng, valid until 21:00 GMT today. A 4-hour close beyond the stop cancels the idea.
| Instrument | Direction | Entry | Stop | Target 1 | Target 2 | Reward:risk | Conviction |
|---|---|---|---|---|---|---|---|
| Dow Jones Industrial Average (US30 / DJI) | Long | 52,050 | 51,550 | 52,550 | 52,800 | 1.0 / 1.5 | Medium |
| S&P 500 (SPX) | Short | 7,700 | 7,745 | 7,650 | 7,620 | 1.1 / 1.8 | Low–Medium |
| FTSE 100 (UK100 / UKX) | Long | 10,690 | 10,620 | 10,770 | 10,890 | 1.1 / 2.9 | Low–Medium |
| DAX 40 (GER40 / DAX) | Long | 25,650 | 25,430 | 25,990 | 26,250 | 1.5 / 2.7 | Medium |
| Hang Seng (HK50 / HSI) | Short | 23,700 | 24,000 | 23,250 | 22,950 | 1.5 / 2.5 | Low–Medium |
Reward:risk is the distance from entry to each target divided by the distance from entry to the stop. A third target for each index is in its section below. Prices are feed prices from the daily charts captured between 15:48 and 16:04 GMT on 2 November, with the Hang Seng at its 08:00 GMT close. Every entry sits away from the current price and needs a pullback or a bounce to trigger. The Dow, FTSE 100 and DAX ideas are dip-buys and the S&P 500 and Hang Seng ideas are sell-the-bounce, so the five indices are highly correlated and an oil rebound or a Wall Street reversal would hit the longs together. The Hang Seng idea can only trigger on CFDs or futures because Hong Kong cash is closed until 01:30 GMT. Levels are conditional technical references, not recommendations.
Risk Scenario Analysis
Oil and US-Iran headlines are the swing factor for the rest of today, with Treasury yields and the Wall Street tone into the 21:00 GMT close as the confirmation.
Talks stall and oil rebounds: yields rise again and the equity bounce fades
A reversal in crude on any breakdown in US-Iran diplomacy would push the 10-year yield back toward 4.93% and revive the December hike bets near 70%. The S&P 500 would lose its 7,618.79 slow average first, and the Dow would slip back under its averages.
- Dow Jones52,055.51, then 51,400
- S&P 5007,618.79, then 7,500
- FTSE 10010,640, then 10,470
- DAX 4025,522.91, then 24,800
- Hang Seng22,950, then 22,750
Diplomacy progresses and oil sinks further: yields ease and the indices retest their averages
Further progress on talks would take Brent lower, pull yields down and keep the dollar soft. The S&P 500 would retest its 7,696.52 and 7,723.53 averages, the DAX would clear 26,022, and the Dow would press the 52,800 triangle top.
- Dow Jones52,800, then 53,850
- S&P 5007,723.53, then 7,830
- FTSE 10010,890, then 10,990
- DAX 4026,022, then 26,520
- Hang Seng23,708.53, then 24,529.81
Dow Jones Industrial Average (US30 / DJI) | TVC feed
Dow Jones Analysis: Price Squeezes Into the Apex of a Symmetrical Triangle Above the 52,198.48 and 52,055.51 Averages
52,372.25 +597.08 (+1.15%) at about 15:48 GMT Previous close 51,775.17
Outlook: Bias is higher while 52,055 holds, with 52,800 the cap. The Dow is up 1.15% at 52,372, recovering most of Friday’s 1.09% loss as oil sinks and megacap tech rebounds, and the ISM data has not derailed the bid.

Key levels
- Support 2
- 51,400
- Support 1
- 52,055.51
- Resistance 1
- 52,800
- Resistance 2
- 53,850
- Price (52,372.25) is above the 52,198.48 and 52,055.51 averages and level with the 52,396.51 average. Main catalyst: oil and US-Iran talks, the ISM data, Apple and Palantir results after the close.
- RSI 53.37 under its 54.33 average: neutral. A close above 52,800 breaks the triangle top and targets 52,950 and 53,850; a close under 51,400 breaks the floor and opens 50,500.
Setup: Long at 52,050, stop 51,550, targets 52,550, 52,800 and 53,150. Reward:risk 1.0 / 1.5 / 2.2, medium conviction. Dip-buy at 52,050 on the averages, stop 51,550 near the triangle floor. Cancel if a 4-hour close below 51,550, or a sharp oil rebound that revives Fed-hike bets. Cancel if unfilled by 21:00 GMT today.
S&P 500 (SPX) | SP feed
S&P 500 Analysis: Price Reclaims the 7,618.79 Slow Average but Stays Under the 7,696.52 and 7,723.53 Averages Inside a Rising Channel
7,646.52 +66.45 (+0.88%) at about 15:49 GMT Previous close 7,580.07
Outlook: Bias is range-bound with an upside tilt while 7,618 holds, and 7,696 to 7,724 caps rallies. The index is up 0.88% at 7,646.52 after Friday’s 1.82% drop, its worst session since June, with megacaps rebounding while Apple trades lower ahead of its results.

Key levels
- Support 2
- 7,500
- Support 1
- 7,618.79
- Resistance 1
- 7,723.53
- Resistance 2
- 7,830
- Price (7,646.52) is above the 7,618.79 average and under the 7,696.52 and 7,723.53 averages. Main catalyst: oil and Iran talks, the ISM data, Apple results after the close.
- RSI 45.91 under its 47.96 average: soft but off Friday’s low. A close above 7,723.53 targets 7,830; a close under 7,618.79 reopens 7,500.
Setup: Short at 7,700, stop 7,745, targets 7,650, 7,620 and 7,560. Reward:risk 1.1 / 1.8 / 3.1, low–medium conviction. Sell the bounce at 7,700 between the 7,696.52 and 7,723.53 averages, stop 7,745 above the upper average. This runs against today’s bid, so keep size small. Cancel if a 4-hour close above 7,745, or oil keeps sliding with yields lower. Cancel if unfilled by 21:00 GMT today.
FTSE 100 (UK100 / UKX) | FTSE feed
FTSE 100 Analysis: Price Holds Mid-Range Inside an Ascending Triangle Under the 10,890 and 10,990 Highs
10,767.76 +37.98 (+0.35%) at about 16:02 GMT Previous close 10,729.78
Outlook: Bias is range-bound while 10,640 holds and 10,890 caps. The FTSE is up 0.35% at 10,767.76 after opening lower with BP and Shell weaker as crude fell, then turning higher into the 16:30 GMT London close.

Key levels
- Support 2
- 10,470
- Support 1
- 10,640
- Resistance 1
- 10,890
- Resistance 2
- 10,990
- Price (10,767.76) is above today’s low of 10,684.69 and under the 10,890 October high and the 10,990 record area from July. Main catalyst: oil and energy stocks, the 16:30 GMT London close, Wall Street’s tone.
- No RSI reading is visible on this chart. A close above 10,890 targets 10,990; a close under 10,640 puts the 10,470 trendline in play.
Setup: Long at 10,690, stop 10,620, targets 10,770, 10,890 and 10,990. Reward:risk 1.1 / 2.9 / 4.3, low–medium conviction. Dip-buy at 10,690 near today’s low of 10,684.69, stop 10,620 under the recent range floor. Cancel if a 4-hour close below 10,620, or a broad risk-off turn on Wall Street. Cancel if unfilled by 21:00 GMT today.
DAX 40 (GER40 / DAX) | XETR feed
DAX 40 Analysis: Price Tests 26,000 Above a Cluster of Averages Inside a Rising Channel
25,993.71 +175.50 (+0.68%) at about 16:03 GMT Previous close 25,818.21
Outlook: Bias is higher while 25,522 holds, with 26,022 and 26,520 the hurdles. The DAX is up 0.68% at 25,993.71, extending its rebound from the October low after Friday’s 0.9% loss, with cheaper oil having helped airlines such as Lufthansa earlier today.

Key levels
- Support 2
- 24,800
- Support 1
- 25,522.91
- Resistance 1
- 26,022
- Resistance 2
- 26,520
- Price (25,993.71) is above the 25,576.70, 25,522.91 and 25,433.45 averages. Main catalyst: oil, single-stock moves such as Alstom, the 16:30 GMT close, Wall Street.
- RSI 59.28 above its 52.69 average: firm, not overbought. A close above 26,022 targets 26,520; a close under 25,522.91 puts the 24,800 channel floor in play.
Setup: Long at 25,650, stop 25,430, targets 25,990, 26,250 and 26,520. Reward:risk 1.5 / 2.7 / 4.0, medium conviction. Dip-buy at 25,650 above the cluster of averages, stop 25,430 under the lowest one. Cancel if a 4-hour close below 25,430, or a Wall Street reversal after the European close. Cancel if unfilled by 21:00 GMT today.
Hang Seng (HK50 / HSI) | HSI feed
Hang Seng Analysis: Price Bounces Off the Channel Floor but Stays Under the 23,708.53 Average Inside a Falling Channel
23,393.32 +98.90 (+0.42%) at about 08:00 GMT Previous close 23,294.42
Outlook: Bias is lower while 23,708 caps rallies. The Hang Seng closed up 0.42% at 23,393.32, with the Hang Seng Tech Index up 2.25% while banks lagged, but the index is still under all three of its averages.

Key levels
- Support 2
- 22,750
- Support 1
- 23,250
- Resistance 1
- 23,708.53
- Resistance 2
- 24,529.81
- Price (23,393.32) is under the 23,708.53, 24,529.81 and 24,603.92 averages. Main catalyst: tech rebound, AI-spending worries, hopes of Chinese capital-market support, Wall Street’s tone.
- RSI 41.37 above its 36.71 average: turning up from weak. A close above 23,708.53 targets 24,529.81; a close under 22,750 opens 22,518, the 52-week low.
Setup: Short at 23,700, stop 24,000, targets 23,250, 22,950 and 22,750. Reward:risk 1.5 / 2.5 / 3.2, low–medium conviction. Sell the bounce at 23,700 at the 23,708.53 average, stop 24,000. The Hong Kong cash market is shut until 01:30 GMT, so this idea can only trigger on CFDs or futures. Cancel if a 4-hour close above 24,000, or a strong Wall Street close. Cancel if unfilled by 21:00 GMT today.
Conclusion
The bounce is real but oil-dependent, so we prefer buying dips in the Dow near 52,050 and the DAX near 25,650, where price is above its averages, with a smaller dip-buy in the FTSE 100 near 10,690. The S&P 500 near 7,700 and the Hang Seng near 23,700 are sell-the-bounce ideas at the averages overhead, both at low-to-medium conviction. The session risks are oil and US-Iran headlines, Treasury yields after the ISM, the 16:30 GMT European close and Apple and Palantir results after the 21:00 GMT US close. A 4-hour close under 51,550 in the Dow or above 7,745 in the S&P 500 would change the picture.
Trade the Dow Jones, S&P 500, FTSE 100, DAX 40 and Hang Seng with Capital Street FX.
Frequently Asked Questions
What is the stock market outlook for today?
Cautiously positive and oil-driven. The Dow and S&P 500 are rebounding from Friday’s sell-off as oil falls on US-Iran talk hopes, but the S&P 500 and Hang Seng remain under key averages and Apple and Palantir results after the US close are the next test.
Which index trade ideas are live today?
Long the Dow Jones near 52,050, the FTSE 100 near 10,690 and the DAX 40 near 25,650; short the S&P 500 near 7,700 and the Hang Seng near 23,700. Each has a stop and three targets.
What time are the key events in GMT?
The European cash close is at 16:30 GMT, the US cash close at 21:00 GMT, Apple and Palantir report after it, and Hong Kong reopens at 01:30 GMT on Tuesday. The ISM manufacturing PMI was released at 15:00 GMT.
Why is the Dow up more than 1% today?
Oil has fallen sharply on hopes of a diplomatic end to the Iran war, lifting megacap tech after Friday’s sell-off, and ISM prices paid eased to 75.2 from 77.9.
Which index is strongest today?
The Dow is the strongest at +1.15%, followed by the S&P 500 at +0.88%, the DAX at +0.68%, the Hang Seng at +0.42% and the FTSE 100 at +0.35%.