JP Morgan Chase (JPM) Trade Idea Live: 335.00 Is the Line Before the Midterm Result | Trade Idea | 03 Nov 2026
Stocks to Watch Shares, midterm and Fed catalysts
Tuesday 3 November 2026
JPM
JPMorgan Chase & Co. NYSE, United States, banks
339.16
−1.42 (−0.42%) intraday at 14:41 GMT, day range 339.07–340.71
Previous close 340.58, 52-week range 279.10–366.50, US midterm voting under way
JP Morgan Chase (JPM) Trade Idea Live: 335.00 Is the Line Before the Midterm Result
Live Overview: JPM Sits Mid-Channel as the US Votes
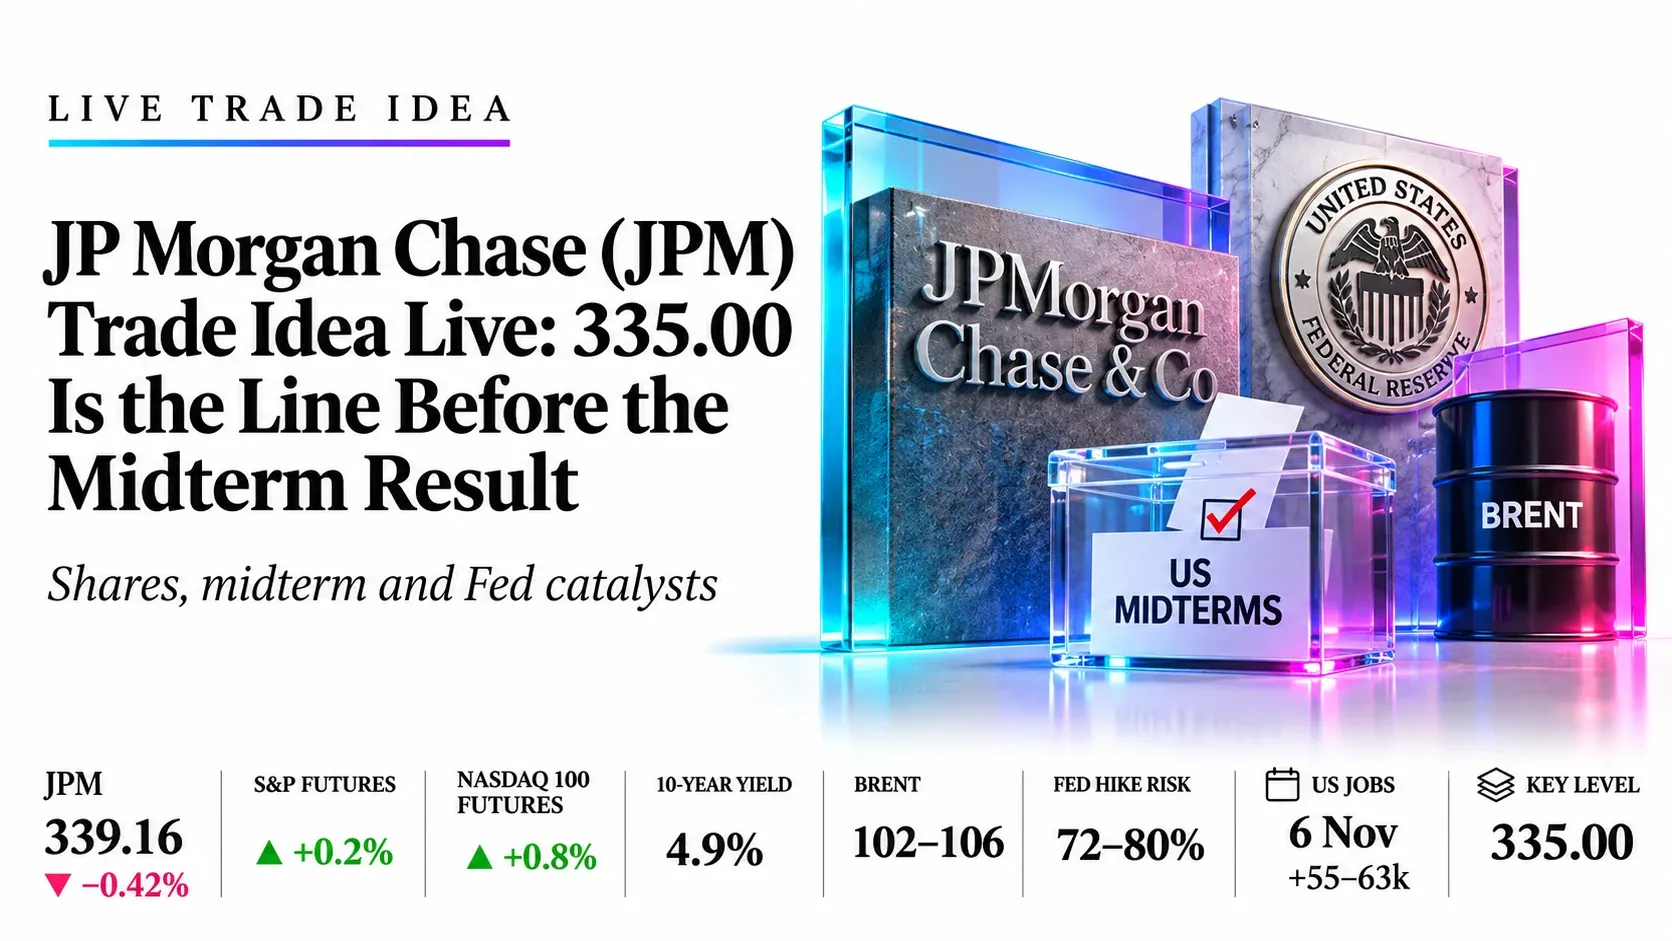
JPMorgan (JPM) trades at 339.16 at 14:41 GMT, down 0.42% from Monday’s 340.58 close, in the middle of a falling channel that has capped it since the August peak near 366.50. The US midterm vote is under way, oil is whipsawing on Iran headlines (Brent fell 7.6% on Monday, then swung from about $106 to below $102 today), and Friday’s October jobs report could lift December Fed-hike odds, now about 72–80%. Price holds above its 20-day average at 335.59 and below the 50- and 100-day pair at 342.72–343.76, with RSI(14) at a neutral 51.43. Our preferred plan is Plan A, a limit buy at 334.50–336.00 with a stop at 330.50. Answer: 335.00 holds for now; a daily close below 331.00 would open 323.50 and then 319.50.
Live highlights, 14:41 GMT
- Catalyst: Midterm results overnight, US jobs on Friday 6 Nov (about +55–63k expected), CPI on 10 Nov and the Fed on 9 Dec
- Fundamentals: Q3 adjusted EPS of $5.75 missed $5.94, but net interest income rose 13% to $27.0bn and the 2026 outlook went up to $106.2bn; net buybacks were cut to $664m
- Levels: Resistance sits at 342.72–343.76, then 347–348 and the channel top near 351; support sits at 335.59, 333–334 and 323–326
- Backdrop: Nasdaq 100 futures are up 0.8% after a technical correction, S&P futures up 0.2%, the 10-year yield is near 4.9%, and Brent is back near $102–106
JPM Trade Setups: Buy 334.50–336.00, Short Below 331.00
Plan A Buy the dip at the 20-day Long, medium conviction
Entry zone334.50–336.00
- Stop loss
- 330.50
- Target 1
- 343.00
- Target 2
- 351.00
- Reward:risk
- 1.6 and 3.3
Average entry 335.25, risk $4.75 a share. A limit order at the 20-day average (335.59), just above the 334 low of 30 October. Target 1 is the 50- and 100-day cluster, target 2 the channel top.
Plan B Short the breakdown Short, on confirmation
TriggerDaily close below 331.00
- Entry
- 330.50
- Stop loss
- 334.50
- Target 1
- 323.50
- Target 2
- 319.50
- Reward:risk
- 1.8 and 2.8
Risk $4.00 a share. A close under 331.00 breaks the 20-day and the 331.43 close of 13 October; 323.50 is the 200-day, 319.50 the channel floor. Expect a pause at the 326 early-October lows.
Event risk: Results from the midterms arrive overnight, so the first full reaction is Wednesday’s 14:30 GMT open and price can gap through either stop. Friday’s jobs report at 13:30 GMT can move yields and bank stocks sharply. A daily close above 344.00 clears the 50- and 100-day averages; wait for a retest of 343 rather than chase. Do not hold size through the vote that you cannot afford to see gap.
JPM Sentiment Heat Map: Neutral, −1
Daily trend
Falling channelLower highs since the August peakNet interest income
Up 13%$27.0bn; 2026 outlook raised to $106.2bnQ3 print
MissEPS $5.75 against $5.94 expectedCapital return
MixedDividend up to $1.65, buyback cut 84%Daily RSI(14)
51.43Neutral, above signal 48.24Valuation
About 3x TBVP/E 14.3; premium to its own historyAnalyst view
Moderate BuyAverage target 368.33, 8.6% above priceMacro
Fed hike riskDecember hike about 72–80% pricedNet score −1 on a scale of −16 to +16. Each tile scores −2 to +2.
Catalyst File: What Moves JPM This Week
| Midterms | Voting today; results overnight into Wednesday, with control of Congress and fiscal and regulatory expectations at stake |
|---|---|
| Fed | Held at 3.75–4.00% on 28 October with two dissents for a hike; a December hike is about 72–80% priced; the 10-year yield is near 4.9% |
| Jobs | October payrolls on Friday 6 November, 13:30 GMT; forecast about +55–63k, unemployment 4.2% |
| Last results | 13 October: adjusted EPS $5.75 against $5.94, revenue $50.17bn against $51.23bn, net income up 6% to $15.3bn |
| Capital | Dividend raised to $1.65 a quarter; net buybacks cut to $664m from $6.2bn; $50bn authorisation remains |
| Oil and Iran | Brent fell 7.6% to $104.77 on Monday on Qatar-mediated talks, then rebounded after a US strike on Qeshm Island before slipping again today |
| Next results | Fourth-quarter 2026 results on Thursday 14 January 2027, about 11:45 GMT |
Reaction Map: 335.00 Decides the Next Leg
Calm vote, soft jobs, oil easing
343.00, then 347–351
No chase; Plan A buys dips only
Muted reaction
335.59, then 342.72
Wait; no edge inside the range
Hot data, oil spike or AI selloff
331.00, then 323.50
Plan B short on daily close
JPM Chart: The 20-Day at 335.59 Frames the Vote

- Trend: Price has made lower highs inside a falling channel since the August peak near 367; the rails sit near 351 and 319, and 339.16 is mid-channel.
- Averages: The 20-day sits at 335.59 as support; the 50- and 100-day (343.76 and 342.72) form overhead resistance; the 200-day is near 323.13. RSI(14) is 51.43, neutral.
- Ceiling: The 30 October spike high near 347–348 and the channel top near 351 cap rallies; the 334 low of 30 October and the early-October lows near 326 are the floors.
JPM by the Numbers: Strong Lending, Smaller Buyback
- Q3 adjusted EPS
- $5.75
- Missed $5.94 estimate
- Q3 net interest income
- $27.0 billion
- Up 13% a year
- 2026 NII outlook
- $106.2 billion
- Raised from $105.5bn
- Q3 net buybacks
- $664 million
- From $6.2bn in Q2
- Quarterly dividend
- $1.65
- Up from $1.50; yield 1.9%
- Average analyst target
- $368.33
- 8.6% above price
Catalyst Calendar in GMT
3 Nov
US open; midterm voting under way, polls begin to close from 23:00 GMT
4 Nov
US open, first full reaction to the midterm result
6 Nov
US October jobs report, feeds December Fed pricing
10 Nov
US October CPI
9 Dec
Fed decision and projections, a hike is priced
14 Jan
JPMorgan fourth-quarter 2026 results
JPM Company News Behind the Move
UBS lifts its JPMorgan target to $400 and keeps Buy
The raise from $395 sits about 18% above the current price; Barclays at $425 and Bank of America at $420 are among the higher targets. MarketBeat, 3 Nov 2026
Oil swings and Nasdaq correction set the tone before the vote
Bloomberg reported Nasdaq 100 futures up 0.8% after the index entered a correction, and Brent below $102 on an unconfirmed Iran memorandum report. Bloomberg, 3 Nov 2026
Fed holds at 3.75–4.00% with two dissents for a hike
Governor Cook and Cleveland Fed President Hammack voted to raise; markets price a December hike at roughly 72–80%. TheStreet and Admiral Markets, Oct 2026
JPMorgan misses Q3 estimates but raises its interest income outlook
Shares hit 344.36, then closed at 331.43 as net buybacks fell to $664 million from $6.2 billion. Benzinga and TIKR, 13 Oct 2026
JPM Price Targets: Street Sits Above Price
MarketBeat shows a Moderate Buy consensus (1 Strong Buy, 14 Buy, 13 Hold) with an average target of 368.33, about 8.6% above the price. Barclays’ 425 is the high we found; Baird’s 312 with a Neutral rating is the low.
Bottom Line
Buy 334.50–336.00, short below 331.00
JPMorgan trades mid-channel with the US vote under way, Fed-hike odds high and oil whipsawing. Plan A is a limit buy at 334.50–336.00 with a stop at 330.50, targeting 343.00 and 351.00, and only fills if the 20-day average is tested. The view turns if JPM closes below 331.00, which opens 323.50 and 319.50, and a daily close above 344.00 shifts the focus to 347–351.
Trade JP Morgan and 2,000+ instruments with Capital Street FX.
Frequently Asked Questions
Why is JPMorgan stock in focus today?
JPM trades mid-channel at 339.16 as US midterm voting is under way, oil swings on Iran headlines and markets price a likely December Fed hike, with the jobs report due on Friday.
What is the JPM trade idea?
Plan A buys 334.50–336.00 with a stop at 330.50 and targets of 343.00 and 351.00. Plan B shorts a daily close below 331.00 toward 323.50 and 319.50.
What are the key JPM support and resistance levels?
Support is the 20-day average at 335.59, then 333–334 and 323–326. Resistance is the 50- and 100-day pair at 342.72–343.76, then 347–348 and the channel top near 351.
What is the JPMorgan analyst price target?
The MarketBeat consensus is Moderate Buy with an average target of 368.33, about 8.6% above the price. Targets range from 312 at Baird to 425 at Barclays.
When does JPMorgan report next?
Fourth-quarter 2026 results are scheduled for Thursday 14 January 2027, with the call at 8:30 a.m. Eastern.